Zip Codes with the Highest Percentage of Self-Employed / Incorporated in Montana
RELATED REPORTS & OPTIONS
Self-Employed / Incorporated
Montana
Compare Zip Codes
Map of Zip Codes with the Highest Percentage of Self-Employed / Incorporated in Montana
0.0%
100.0%
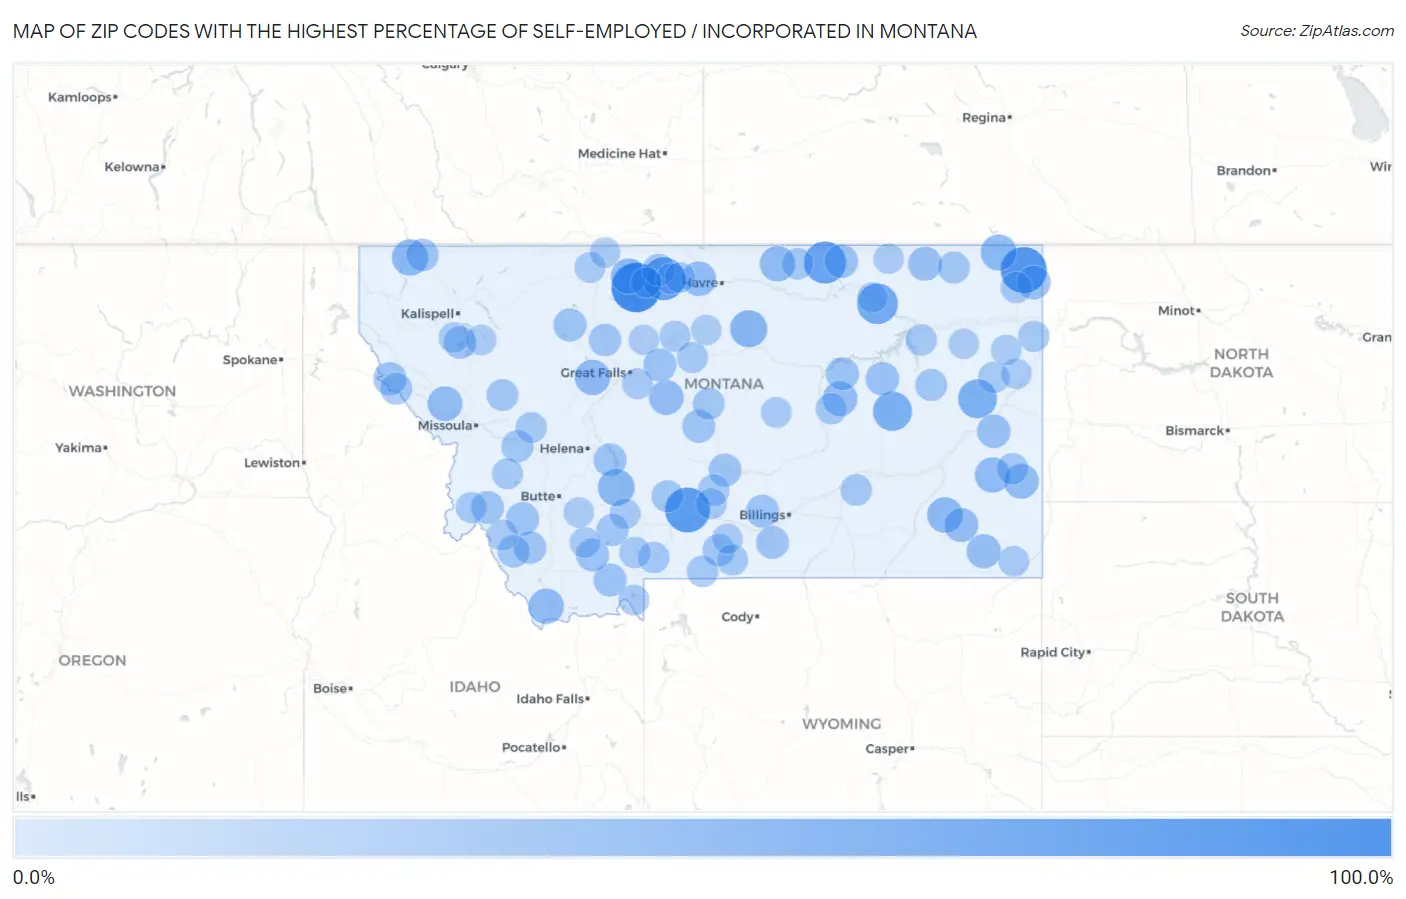
Zip Codes with the Highest Percentage of Self-Employed / Incorporated in Montana
| Zip Code | % Self-Employed / Incorporated | vs State | vs National | |
| 1. | 59461 | 85.0% | 6.0% (+79.0)#1 | 3.8% (+81.2)#28 |
| 2. | 59211 | 71.4% | 6.0% (+65.4)#2 | 3.8% (+67.6)#38 |
| 3. | 59082 | 66.7% | 6.0% (+60.7)#3 | 3.8% (+62.8)#44 |
| 4. | 59530 | 58.9% | 6.0% (+52.9)#4 | 3.8% (+55.1)#59 |
| 5. | 59537 | 56.2% | 6.0% (+50.2)#5 | 3.8% (+52.4)#64 |
| 6. | 59273 | 50.0% | 6.0% (+44.0)#6 | 3.8% (+46.2)#86 |
| 7. | 59322 | 44.2% | 6.0% (+38.2)#7 | 3.8% (+40.4)#112 |
| 8. | 59339 | 42.7% | 6.0% (+36.7)#8 | 3.8% (+38.9)#115 |
| 9. | 59535 | 36.4% | 6.0% (+30.4)#9 | 3.8% (+32.5)#153 |
| 10. | 59643 | 34.6% | 6.0% (+28.6)#10 | 3.8% (+30.8)#167 |
| 11. | 59930 | 33.3% | 6.0% (+27.3)#11 | 3.8% (+29.5)#175 |
| 12. | 59252 | 32.4% | 6.0% (+26.3)#12 | 3.8% (+28.5)#189 |
| 13. | 59444 | 30.9% | 6.0% (+24.9)#13 | 3.8% (+27.0)#207 |
| 14. | 59351 | 30.9% | 6.0% (+24.8)#14 | 3.8% (+27.0)#208 |
| 15. | 59477 | 30.2% | 6.0% (+24.2)#15 | 3.8% (+26.4)#215 |
| 16. | 59529 | 30.0% | 6.0% (+24.0)#16 | 3.8% (+26.2)#216 |
| 17. | 59336 | 29.6% | 6.0% (+23.6)#17 | 3.8% (+25.8)#222 |
| 18. | 59724 | 29.4% | 6.0% (+23.4)#18 | 3.8% (+25.6)#226 |
| 19. | 59354 | 28.3% | 6.0% (+22.3)#19 | 3.8% (+24.5)#247 |
| 20. | 59846 | 27.8% | 6.0% (+21.8)#20 | 3.8% (+24.0)#253 |
| 21. | 59077 | 27.6% | 6.0% (+21.6)#21 | 3.8% (+23.8)#259 |
| 22. | 59469 | 27.4% | 6.0% (+21.4)#22 | 3.8% (+23.6)#261 |
| 23. | 59532 | 26.8% | 6.0% (+20.8)#23 | 3.8% (+22.9)#272 |
| 24. | 59343 | 25.0% | 6.0% (+19.0)#24 | 3.8% (+21.2)#314 |
| 25. | 59316 | 25.0% | 6.0% (+19.0)#25 | 3.8% (+21.2)#316 |
| 26. | 59260 | 23.9% | 6.0% (+17.9)#26 | 3.8% (+20.1)#342 |
| 27. | 59219 | 23.6% | 6.0% (+17.6)#27 | 3.8% (+19.8)#351 |
| 28. | 59544 | 22.9% | 6.0% (+16.9)#28 | 3.8% (+19.1)#373 |
| 29. | 59326 | 22.8% | 6.0% (+16.8)#29 | 3.8% (+19.0)#376 |
| 30. | 59337 | 22.7% | 6.0% (+16.7)#30 | 3.8% (+18.9)#381 |
| 31. | 59762 | 21.8% | 6.0% (+15.8)#31 | 3.8% (+18.0)#417 |
| 32. | 59830 | 21.4% | 6.0% (+15.4)#32 | 3.8% (+17.6)#432 |
| 33. | 59467 | 21.1% | 6.0% (+15.1)#33 | 3.8% (+17.3)#441 |
| 34. | 59452 | 21.1% | 6.0% (+15.1)#34 | 3.8% (+17.3)#443 |
| 35. | 59647 | 20.8% | 6.0% (+14.8)#35 | 3.8% (+17.0)#458 |
| 36. | 59720 | 20.8% | 6.0% (+14.8)#36 | 3.8% (+17.0)#465 |
| 37. | 59755 | 20.8% | 6.0% (+14.7)#37 | 3.8% (+16.9)#467 |
| 38. | 59057 | 20.7% | 6.0% (+14.7)#38 | 3.8% (+16.9)#470 |
| 39. | 59318 | 20.6% | 6.0% (+14.6)#39 | 3.8% (+16.8)#478 |
| 40. | 59450 | 20.4% | 6.0% (+14.4)#40 | 3.8% (+16.6)#486 |
| 41. | 59871 | 20.2% | 6.0% (+14.2)#41 | 3.8% (+16.3)#500 |
| 42. | 59078 | 20.0% | 6.0% (+14.0)#42 | 3.8% (+16.2)#512 |
| 43. | 59026 | 19.6% | 6.0% (+13.6)#43 | 3.8% (+15.7)#527 |
| 44. | 59746 | 19.2% | 6.0% (+13.2)#44 | 3.8% (+15.4)#548 |
| 45. | 59914 | 19.1% | 6.0% (+13.1)#45 | 3.8% (+15.3)#554 |
| 46. | 59917 | 18.9% | 6.0% (+12.9)#46 | 3.8% (+15.0)#564 |
| 47. | 59433 | 18.6% | 6.0% (+12.6)#47 | 3.8% (+14.8)#577 |
| 48. | 59736 | 18.6% | 6.0% (+12.6)#48 | 3.8% (+14.8)#582 |
| 49. | 59531 | 18.5% | 6.0% (+12.5)#49 | 3.8% (+14.7)#590 |
| 50. | 59028 | 18.0% | 6.0% (+12.0)#50 | 3.8% (+14.1)#628 |
| 51. | 59745 | 17.8% | 6.0% (+11.8)#51 | 3.8% (+14.0)#642 |
| 52. | 59832 | 17.6% | 6.0% (+11.6)#52 | 3.8% (+13.8)#657 |
| 53. | 59263 | 17.0% | 6.0% (+11.0)#53 | 3.8% (+13.1)#712 |
| 54. | 59214 | 16.7% | 6.0% (+10.7)#54 | 3.8% (+12.8)#744 |
| 55. | 59086 | 16.5% | 6.0% (+10.5)#55 | 3.8% (+12.7)#761 |
| 56. | 59462 | 16.3% | 6.0% (+10.3)#56 | 3.8% (+12.5)#784 |
| 57. | 59842 | 16.2% | 6.0% (+10.2)#57 | 3.8% (+12.4)#796 |
| 58. | 59868 | 15.9% | 6.0% (+9.90)#58 | 3.8% (+12.1)#834 |
| 59. | 59055 | 15.5% | 6.0% (+9.51)#59 | 3.8% (+11.7)#880 |
| 60. | 59542 | 15.5% | 6.0% (+9.47)#60 | 3.8% (+11.7)#889 |
| 61. | 59020 | 15.4% | 6.0% (+9.38)#61 | 3.8% (+11.6)#900 |
| 62. | 59344 | 15.2% | 6.0% (+9.24)#62 | 3.8% (+11.4)#914 |
| 63. | 59038 | 15.1% | 6.0% (+9.11)#63 | 3.8% (+11.3)#931 |
| 64. | 59247 | 14.9% | 6.0% (+8.90)#64 | 3.8% (+11.1)#970 |
| 65. | 59027 | 14.8% | 6.0% (+8.78)#65 | 3.8% (+11.0)#992 |
| 66. | 59315 | 14.3% | 6.0% (+8.28)#66 | 3.8% (+10.5)#1,082 |
| 67. | 59223 | 14.3% | 6.0% (+8.28)#67 | 3.8% (+10.5)#1,084 |
| 68. | 59058 | 14.3% | 6.0% (+8.28)#68 | 3.8% (+10.5)#1,086 |
| 69. | 59730 | 14.2% | 6.0% (+8.21)#69 | 3.8% (+10.4)#1,091 |
| 70. | 59843 | 13.8% | 6.0% (+7.81)#70 | 3.8% (+10.00)#1,170 |
| 71. | 59442 | 13.7% | 6.0% (+7.66)#71 | 3.8% (+9.85)#1,207 |
| 72. | 59221 | 13.6% | 6.0% (+7.64)#72 | 3.8% (+9.82)#1,211 |
| 73. | 59068 | 13.6% | 6.0% (+7.58)#73 | 3.8% (+9.77)#1,222 |
| 74. | 59827 | 13.4% | 6.0% (+7.41)#74 | 3.8% (+9.60)#1,244 |
| 75. | 59446 | 13.1% | 6.0% (+7.14)#75 | 3.8% (+9.33)#1,291 |
| 76. | 59858 | 13.1% | 6.0% (+7.10)#76 | 3.8% (+9.28)#1,300 |
| 77. | 59011 | 13.0% | 6.0% (+7.03)#77 | 3.8% (+9.21)#1,317 |
| 78. | 59761 | 12.8% | 6.0% (+6.84)#78 | 3.8% (+9.03)#1,345 |
| 79. | 59540 | 12.7% | 6.0% (+6.69)#79 | 3.8% (+8.88)#1,387 |
| 80. | 59454 | 12.5% | 6.0% (+6.49)#80 | 3.8% (+8.68)#1,447 |
| 81. | 59032 | 12.5% | 6.0% (+6.45)#81 | 3.8% (+8.64)#1,458 |
| 82. | 59758 | 12.3% | 6.0% (+6.27)#82 | 3.8% (+8.45)#1,500 |
| 83. | 59472 | 12.1% | 6.0% (+6.14)#83 | 3.8% (+8.33)#1,531 |
| 84. | 59749 | 12.0% | 6.0% (+6.00)#84 | 3.8% (+8.19)#1,562 |
| 85. | 59311 | 12.0% | 6.0% (+5.95)#85 | 3.8% (+8.14)#1,572 |
| 86. | 59528 | 11.8% | 6.0% (+5.76)#86 | 3.8% (+7.95)#1,628 |
| 87. | 59522 | 11.6% | 6.0% (+5.58)#87 | 3.8% (+7.76)#1,697 |
| 88. | 59741 | 11.6% | 6.0% (+5.56)#88 | 3.8% (+7.75)#1,704 |
| 89. | 59262 | 11.6% | 6.0% (+5.55)#89 | 3.8% (+7.74)#1,708 |
| 90. | 59243 | 11.5% | 6.0% (+5.46)#90 | 3.8% (+7.65)#1,732 |
| 91. | 59929 | 11.4% | 6.0% (+5.42)#91 | 3.8% (+7.61)#1,742 |
| 92. | 59274 | 11.4% | 6.0% (+5.36)#92 | 3.8% (+7.55)#1,758 |
| 93. | 59911 | 11.2% | 6.0% (+5.20)#93 | 3.8% (+7.39)#1,808 |
| 94. | 59484 | 11.1% | 6.0% (+5.11)#94 | 3.8% (+7.29)#1,846 |
| 95. | 59250 | 11.0% | 6.0% (+5.04)#95 | 3.8% (+7.23)#1,875 |
| 96. | 59001 | 11.0% | 6.0% (+5.04)#96 | 3.8% (+7.22)#1,878 |
| 97. | 59420 | 11.0% | 6.0% (+5.01)#97 | 3.8% (+7.20)#1,892 |
| 98. | 59520 | 10.7% | 6.0% (+4.72)#98 | 3.8% (+6.91)#1,999 |
| 99. | 59759 | 10.7% | 6.0% (+4.70)#99 | 3.8% (+6.89)#2,015 |
| 100. | 59241 | 10.7% | 6.0% (+4.69)#100 | 3.8% (+6.88)#2,021 |
Common Questions
What are the Top 10 Zip Codes with the Highest Percentage of Self-Employed / Incorporated in Montana?
Top 10 Zip Codes with the Highest Percentage of Self-Employed / Incorporated in Montana are:
What zip code has the Highest Percentage of Self-Employed / Incorporated in Montana?
59461 has the Highest Percentage of Self-Employed / Incorporated in Montana with 85.0%.
What is the Percentage of Self-Employed / Incorporated in the State of Montana?
Percentage of Self-Employed / Incorporated in Montana is 6.0%.
What is the Percentage of Self-Employed / Incorporated in the United States?
Percentage of Self-Employed / Incorporated in the United States is 3.8%.