Zip Codes with the Highest Percentage of Population Employed in Community & Social Service in Montana
RELATED REPORTS & OPTIONS
Community & Social Service
Montana
Compare Zip Codes
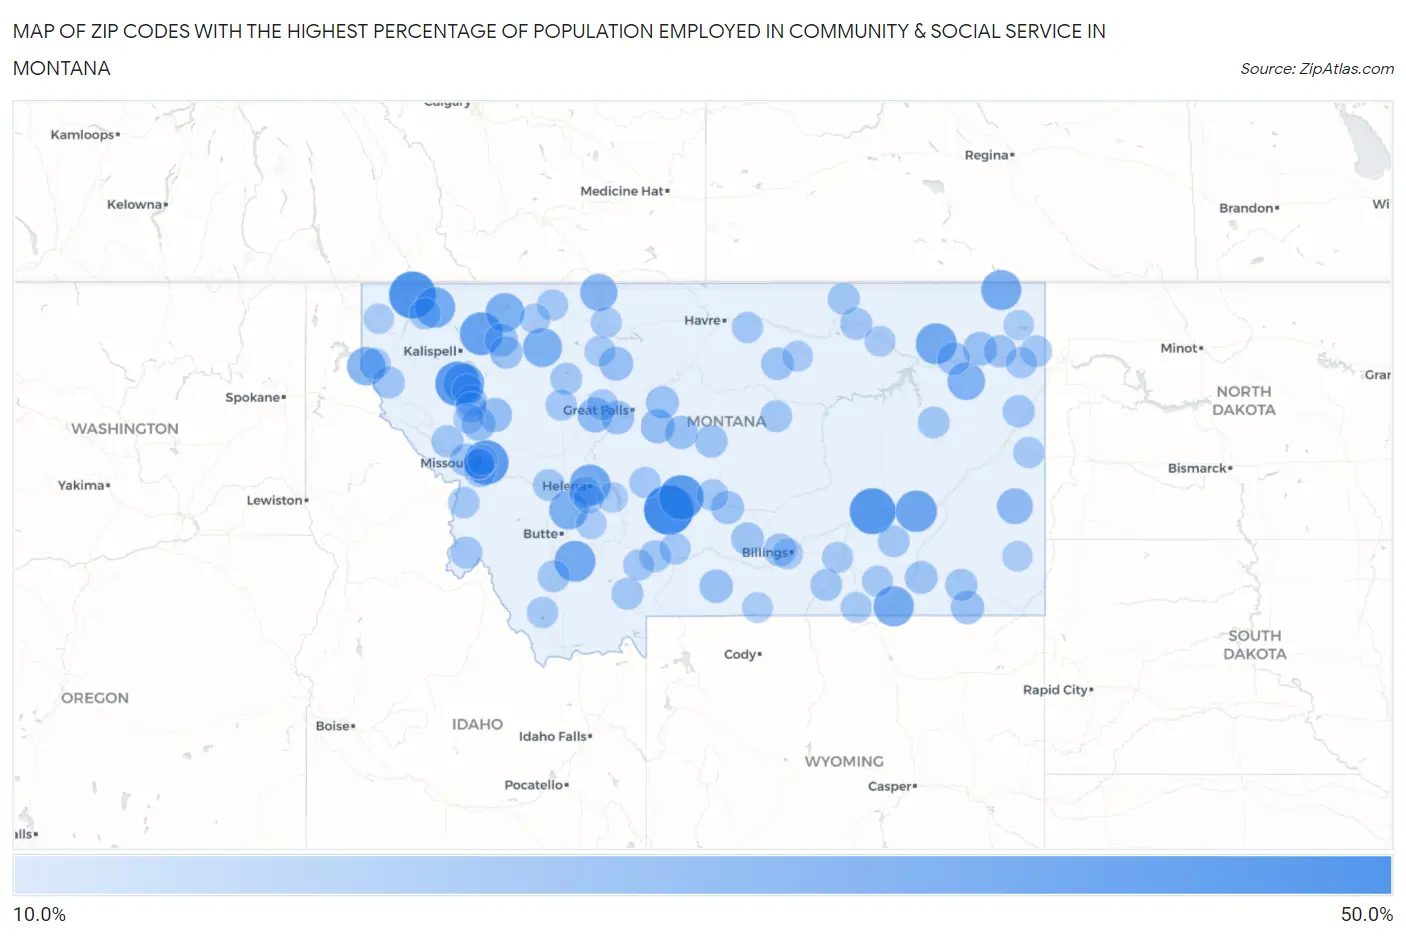
Map of Zip Codes with the Highest Percentage of Population Employed in Community & Social Service in Montana
10.0%
50.0%
Zip Codes with the Highest Percentage of Population Employed in Community & Social Service in Montana
| Zip Code | % Employed | vs State | vs National | |
| 1. | 59642 | 47.1% | 10.6%(+36.5)#1 | 11.2%(+35.8)#194 |
| 2. | 59930 | 42.2% | 10.6%(+31.6)#2 | 11.2%(+30.9)#259 |
| 3. | 59076 | 40.0% | 10.6%(+29.4)#3 | 11.2%(+28.8)#289 |
| 4. | 59053 | 38.0% | 10.6%(+27.4)#4 | 11.2%(+26.7)#330 |
| 5. | 59915 | 37.5% | 10.6%(+26.9)#5 | 11.2%(+26.3)#337 |
| 6. | 59851 | 37.5% | 10.6%(+26.9)#6 | 11.2%(+26.3)#339 |
| 7. | 59913 | 34.5% | 10.6%(+23.9)#7 | 11.2%(+23.2)#406 |
| 8. | 59333 | 31.8% | 10.6%(+21.2)#8 | 11.2%(+20.6)#498 |
| 9. | 59751 | 31.0% | 10.6%(+20.4)#9 | 11.2%(+19.7)#538 |
| 10. | 59625 | 30.9% | 10.6%(+20.3)#10 | 11.2%(+19.7)#543 |
| 11. | 59225 | 30.9% | 10.6%(+20.3)#11 | 11.2%(+19.6)#546 |
| 12. | 59910 | 30.9% | 10.6%(+20.3)#12 | 11.2%(+19.6)#548 |
| 13. | 59933 | 30.0% | 10.6%(+19.4)#13 | 11.2%(+18.8)#589 |
| 14. | 59025 | 29.6% | 10.6%(+19.0)#14 | 11.2%(+18.4)#606 |
| 15. | 59252 | 29.4% | 10.6%(+18.8)#15 | 11.2%(+18.2)#618 |
| 16. | 59448 | 27.4% | 10.6%(+16.9)#16 | 11.2%(+16.2)#732 |
| 17. | 59631 | 27.2% | 10.6%(+16.6)#17 | 11.2%(+16.0)#747 |
| 18. | 59434 | 26.9% | 10.6%(+16.3)#18 | 11.2%(+15.7)#784 |
| 19. | 59844 | 26.3% | 10.6%(+15.7)#19 | 11.2%(+15.1)#838 |
| 20. | 59274 | 25.0% | 10.6%(+14.4)#20 | 11.2%(+13.8)#977 |
| 21. | 59482 | 24.1% | 10.6%(+13.6)#21 | 11.2%(+12.9)#1,082 |
| 22. | 59344 | 21.7% | 10.6%(+11.1)#22 | 11.2%(+10.5)#1,543 |
| 23. | 59477 | 20.2% | 10.6%(+9.57)#23 | 11.2%(+8.94)#1,967 |
| 24. | 59412 | 18.3% | 10.6%(+7.76)#24 | 11.2%(+7.12)#2,658 |
| 25. | 59826 | 18.3% | 10.6%(+7.73)#25 | 11.2%(+7.10)#2,667 |
| 26. | 59416 | 18.2% | 10.6%(+7.60)#26 | 11.2%(+6.97)#2,730 |
| 27. | 59865 | 18.1% | 10.6%(+7.55)#27 | 11.2%(+6.92)#2,759 |
| 28. | 59255 | 17.8% | 10.6%(+7.18)#28 | 11.2%(+6.55)#2,937 |
| 29. | 59485 | 17.2% | 10.6%(+6.66)#29 | 11.2%(+6.03)#3,217 |
| 30. | 59061 | 17.2% | 10.6%(+6.60)#30 | 11.2%(+5.97)#3,259 |
| 31. | 59314 | 17.1% | 10.6%(+6.49)#31 | 11.2%(+5.86)#3,333 |
| 32. | 59447 | 17.0% | 10.6%(+6.40)#32 | 11.2%(+5.77)#3,393 |
| 33. | 59916 | 17.0% | 10.6%(+6.40)#33 | 11.2%(+5.77)#3,394 |
| 34. | 59078 | 16.7% | 10.6%(+6.08)#34 | 11.2%(+5.45)#3,604 |
| 35. | 59450 | 16.4% | 10.6%(+5.82)#35 | 11.2%(+5.19)#3,761 |
| 36. | 59106 | 16.3% | 10.6%(+5.75)#36 | 11.2%(+5.12)#3,819 |
| 37. | 59003 | 16.1% | 10.6%(+5.48)#37 | 11.2%(+4.84)#4,029 |
| 38. | 59201 | 16.0% | 10.6%(+5.38)#38 | 11.2%(+4.75)#4,099 |
| 39. | 59067 | 15.8% | 10.6%(+5.26)#39 | 11.2%(+4.63)#4,197 |
| 40. | 59527 | 15.8% | 10.6%(+5.24)#40 | 11.2%(+4.60)#4,222 |
| 41. | 59804 | 15.8% | 10.6%(+5.21)#41 | 11.2%(+4.58)#4,244 |
| 42. | 59936 | 15.7% | 10.6%(+5.10)#42 | 11.2%(+4.46)#4,355 |
| 43. | 59462 | 15.6% | 10.6%(+4.97)#43 | 11.2%(+4.34)#4,447 |
| 44. | 59213 | 15.5% | 10.6%(+4.96)#44 | 11.2%(+4.33)#4,455 |
| 45. | 59317 | 15.0% | 10.6%(+4.44)#45 | 11.2%(+3.80)#4,944 |
| 46. | 59846 | 15.0% | 10.6%(+4.43)#46 | 11.2%(+3.79)#4,950 |
| 47. | 59829 | 15.0% | 10.6%(+4.39)#47 | 11.2%(+3.76)#4,990 |
| 48. | 59262 | 15.0% | 10.6%(+4.37)#48 | 11.2%(+3.74)#5,012 |
| 49. | 59261 | 14.8% | 10.6%(+4.25)#49 | 11.2%(+3.62)#5,126 |
| 50. | 59874 | 14.8% | 10.6%(+4.21)#50 | 11.2%(+3.57)#5,171 |
| 51. | 59601 | 14.8% | 10.6%(+4.20)#51 | 11.2%(+3.57)#5,178 |
| 52. | 59732 | 14.7% | 10.6%(+4.12)#52 | 11.2%(+3.49)#5,258 |
| 53. | 59544 | 14.6% | 10.6%(+4.00)#53 | 11.2%(+3.37)#5,387 |
| 54. | 59716 | 14.6% | 10.6%(+3.97)#54 | 11.2%(+3.34)#5,419 |
| 55. | 59075 | 14.5% | 10.6%(+3.89)#55 | 11.2%(+3.26)#5,498 |
| 56. | 59715 | 14.4% | 10.6%(+3.81)#56 | 11.2%(+3.18)#5,597 |
| 57. | 59855 | 14.3% | 10.6%(+3.70)#57 | 11.2%(+3.07)#5,718 |
| 58. | 59731 | 14.3% | 10.6%(+3.70)#58 | 11.2%(+3.07)#5,727 |
| 59. | 59214 | 14.3% | 10.6%(+3.70)#59 | 11.2%(+3.07)#5,737 |
| 60. | 59803 | 14.2% | 10.6%(+3.65)#60 | 11.2%(+3.02)#5,793 |
| 61. | 59471 | 14.2% | 10.6%(+3.64)#61 | 11.2%(+3.01)#5,807 |
| 62. | 59422 | 14.1% | 10.6%(+3.52)#62 | 11.2%(+2.89)#5,962 |
| 63. | 59323 | 14.0% | 10.6%(+3.46)#63 | 11.2%(+2.83)#6,039 |
| 64. | 59036 | 14.0% | 10.6%(+3.39)#64 | 11.2%(+2.76)#6,120 |
| 65. | 59212 | 14.0% | 10.6%(+3.38)#65 | 11.2%(+2.75)#6,137 |
| 66. | 59018 | 13.9% | 10.6%(+3.36)#66 | 11.2%(+2.73)#6,164 |
| 67. | 59218 | 13.9% | 10.6%(+3.29)#67 | 11.2%(+2.66)#6,237 |
| 68. | 59860 | 13.8% | 10.6%(+3.26)#68 | 11.2%(+2.63)#6,280 |
| 69. | 59410 | 13.7% | 10.6%(+3.07)#69 | 11.2%(+2.44)#6,537 |
| 70. | 59875 | 13.6% | 10.6%(+3.05)#70 | 11.2%(+2.42)#6,571 |
| 71. | 59427 | 13.5% | 10.6%(+2.91)#71 | 11.2%(+2.28)#6,755 |
| 72. | 59934 | 13.5% | 10.6%(+2.87)#72 | 11.2%(+2.24)#6,822 |
| 73. | 59853 | 13.4% | 10.6%(+2.85)#73 | 11.2%(+2.22)#6,844 |
| 74. | 59645 | 13.4% | 10.6%(+2.80)#74 | 11.2%(+2.17)#6,924 |
| 75. | 59864 | 13.4% | 10.6%(+2.80)#75 | 11.2%(+2.16)#6,935 |
| 76. | 59523 | 13.4% | 10.6%(+2.77)#76 | 11.2%(+2.14)#6,969 |
| 77. | 59718 | 13.3% | 10.6%(+2.76)#77 | 11.2%(+2.13)#6,979 |
| 78. | 59443 | 13.3% | 10.6%(+2.70)#78 | 11.2%(+2.07)#7,101 |
| 79. | 59353 | 13.2% | 10.6%(+2.61)#79 | 11.2%(+1.98)#7,248 |
| 80. | 59725 | 13.1% | 10.6%(+2.54)#80 | 11.2%(+1.91)#7,361 |
| 81. | 59034 | 13.0% | 10.6%(+2.40)#81 | 11.2%(+1.77)#7,589 |
| 82. | 59016 | 12.9% | 10.6%(+2.37)#82 | 11.2%(+1.74)#7,641 |
| 83. | 59474 | 12.8% | 10.6%(+2.20)#83 | 11.2%(+1.57)#7,923 |
| 84. | 59089 | 12.8% | 10.6%(+2.20)#84 | 11.2%(+1.56)#7,929 |
| 85. | 59425 | 12.6% | 10.6%(+2.07)#85 | 11.2%(+1.43)#8,164 |
| 86. | 59524 | 12.6% | 10.6%(+1.98)#86 | 11.2%(+1.35)#8,309 |
| 87. | 59008 | 12.6% | 10.6%(+1.98)#87 | 11.2%(+1.35)#8,317 |
| 88. | 59647 | 12.5% | 10.6%(+1.92)#88 | 11.2%(+1.29)#8,415 |
| 89. | 59273 | 12.5% | 10.6%(+1.92)#89 | 11.2%(+1.29)#8,431 |
| 90. | 59102 | 12.5% | 10.6%(+1.87)#90 | 11.2%(+1.24)#8,497 |
| 91. | 59812 | 12.4% | 10.6%(+1.80)#91 | 11.2%(+1.17)#8,628 |
| 92. | 59801 | 12.3% | 10.6%(+1.70)#92 | 11.2%(+1.07)#8,795 |
| 93. | 59632 | 12.2% | 10.6%(+1.61)#93 | 11.2%(+0.983)#8,973 |
| 94. | 59417 | 11.9% | 10.6%(+1.33)#94 | 11.2%(+0.697)#9,557 |
| 95. | 59824 | 11.8% | 10.6%(+1.23)#95 | 11.2%(+0.597)#9,742 |
| 96. | 59324 | 11.7% | 10.6%(+1.11)#96 | 11.2%(+0.474)#10,033 |
| 97. | 59935 | 11.7% | 10.6%(+1.07)#97 | 11.2%(+0.441)#10,107 |
| 98. | 59802 | 11.6% | 10.6%(+1.04)#98 | 11.2%(+0.408)#10,179 |
| 99. | 59634 | 11.5% | 10.6%(+0.935)#99 | 11.2%(+0.303)#10,417 |
| 100. | 59247 | 11.5% | 10.6%(+0.933)#100 | 11.2%(+0.301)#10,422 |
Common Questions
What are the Top 10 Zip Codes with the Highest Percentage of Population Employed in Community & Social Service in Montana?
Top 10 Zip Codes with the Highest Percentage of Population Employed in Community & Social Service in Montana are:
What zip code has the Highest Percentage of Population Employed in Community & Social Service in Montana?
59642 has the Highest Percentage of Population Employed in Community & Social Service in Montana with 47.1%.
What is the Percentage of Population Employed in Community & Social Service in the State of Montana?
Percentage of Population Employed in Community & Social Service in Montana is 10.6%.
What is the Percentage of Population Employed in Community & Social Service in the United States?
Percentage of Population Employed in Community & Social Service in the United States is 11.2%.