Zip Codes with the Highest Percentage of Population with a Degree in Arts and Humanities in Montana
RELATED REPORTS & OPTIONS
Arts and Humanities
Montana
Compare Zip Codes
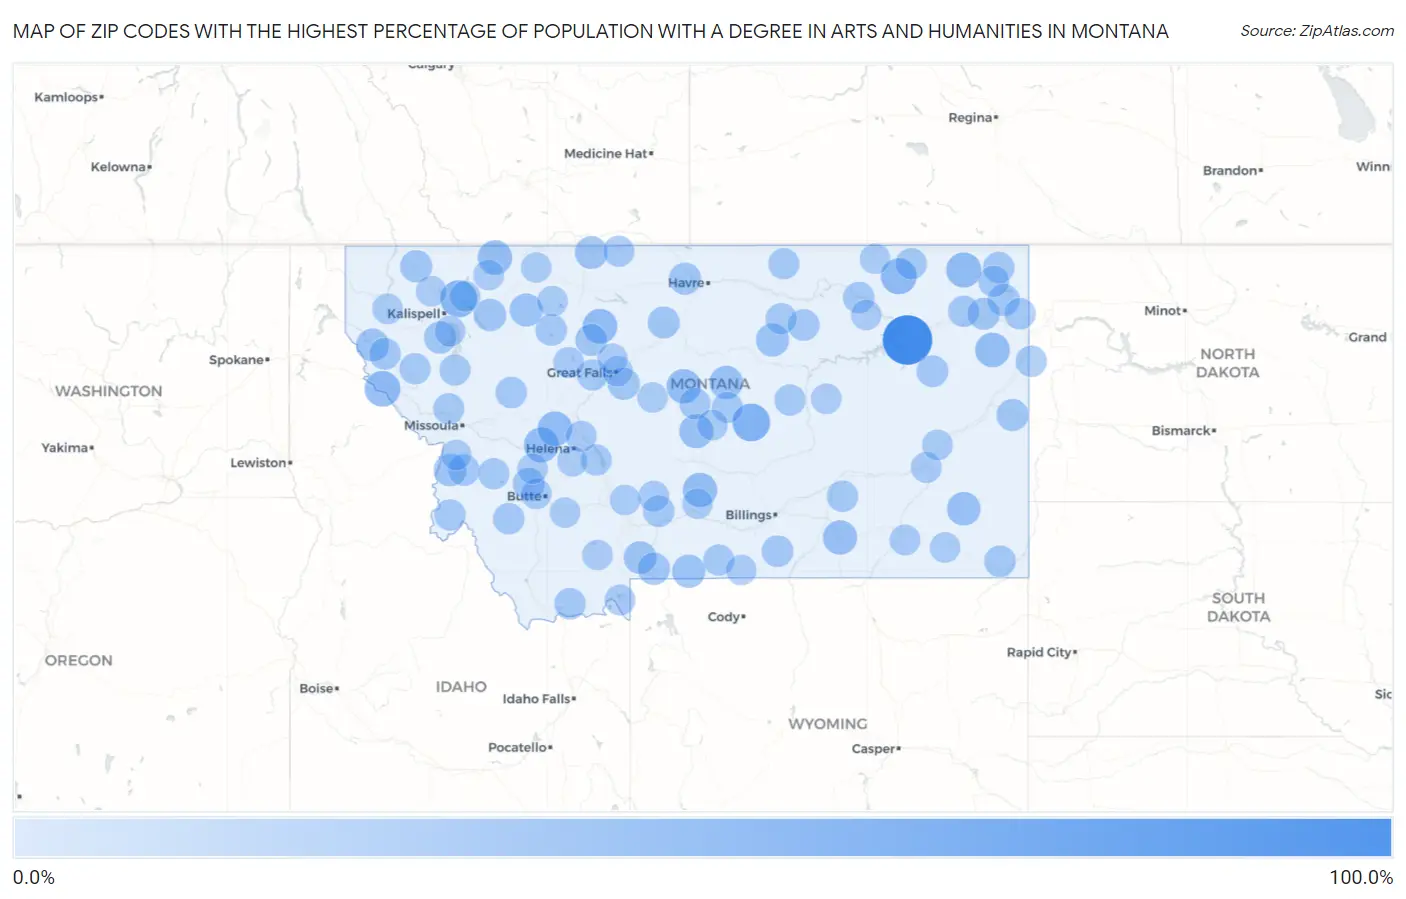
Map of Zip Codes with the Highest Percentage of Population with a Degree in Arts and Humanities in Montana
0.0%
100.0%
Zip Codes with the Highest Percentage of Population with a Degree in Arts and Humanities in Montana
| Zip Code | % Graduates | vs State | vs National | |
| 1. | 59223 | 100.0% | 6.1%(+93.9)#1 | 6.0%(+94.0)#77 |
| 2. | 59441 | 41.9% | 6.1%(+35.8)#2 | 6.0%(+35.9)#316 |
| 3. | 59919 | 38.0% | 6.1%(+31.9)#3 | 6.0%(+32.0)#395 |
| 4. | 59244 | 33.3% | 6.1%(+27.2)#4 | 6.0%(+27.3)#537 |
| 5. | 59842 | 32.3% | 6.1%(+26.1)#5 | 6.0%(+26.3)#570 |
| 6. | 59222 | 29.2% | 6.1%(+23.1)#6 | 6.0%(+23.2)#698 |
| 7. | 59713 | 28.6% | 6.1%(+22.5)#7 | 6.0%(+22.6)#732 |
| 8. | 59416 | 27.3% | 6.1%(+21.2)#8 | 6.0%(+21.3)#802 |
| 9. | 59633 | 27.3% | 6.1%(+21.2)#9 | 6.0%(+21.3)#803 |
| 10. | 59243 | 26.9% | 6.1%(+20.8)#10 | 6.0%(+20.9)#829 |
| 11. | 59411 | 26.4% | 6.1%(+20.3)#11 | 6.0%(+20.4)#865 |
| 12. | 59055 | 26.1% | 6.1%(+20.0)#12 | 6.0%(+20.1)#885 |
| 13. | 59424 | 25.8% | 6.1%(+19.7)#13 | 6.0%(+19.8)#903 |
| 14. | 59031 | 25.0% | 6.1%(+18.9)#14 | 6.0%(+19.0)#961 |
| 15. | 59418 | 24.0% | 6.1%(+17.9)#15 | 6.0%(+18.0)#1,037 |
| 16. | 59345 | 22.2% | 6.1%(+16.1)#16 | 6.0%(+16.2)#1,210 |
| 17. | 59451 | 21.6% | 6.1%(+15.5)#17 | 6.0%(+15.6)#1,275 |
| 18. | 59448 | 20.0% | 6.1%(+13.9)#18 | 6.0%(+14.0)#1,483 |
| 19. | 59546 | 20.0% | 6.1%(+13.9)#19 | 6.0%(+14.0)#1,500 |
| 20. | 59020 | 20.0% | 6.1%(+13.9)#20 | 6.0%(+14.0)#1,507 |
| 21. | 59874 | 19.1% | 6.1%(+13.0)#21 | 6.0%(+13.1)#1,637 |
| 22. | 59484 | 18.5% | 6.1%(+12.4)#22 | 6.0%(+12.5)#1,727 |
| 23. | 59027 | 17.7% | 6.1%(+11.6)#23 | 6.0%(+11.7)#1,918 |
| 24. | 59841 | 17.5% | 6.1%(+11.4)#24 | 6.0%(+11.5)#1,967 |
| 25. | 59936 | 16.7% | 6.1%(+10.6)#25 | 6.0%(+10.7)#2,162 |
| 26. | 59030 | 16.2% | 6.1%(+10.1)#26 | 6.0%(+10.2)#2,294 |
| 27. | 59918 | 16.1% | 6.1%(+10.0)#27 | 6.0%(+10.1)#2,311 |
| 28. | 59532 | 15.8% | 6.1%(+9.68)#28 | 6.0%(+9.79)#2,401 |
| 29. | 59929 | 15.6% | 6.1%(+9.52)#29 | 6.0%(+9.63)#2,450 |
| 30. | 59472 | 15.5% | 6.1%(+9.41)#30 | 6.0%(+9.52)#2,489 |
| 31. | 59226 | 15.2% | 6.1%(+9.04)#31 | 6.0%(+9.16)#2,621 |
| 32. | 59460 | 15.0% | 6.1%(+8.89)#32 | 6.0%(+9.00)#2,677 |
| 33. | 59353 | 14.9% | 6.1%(+8.81)#33 | 6.0%(+8.92)#2,711 |
| 34. | 59213 | 14.6% | 6.1%(+8.52)#34 | 6.0%(+8.64)#2,822 |
| 35. | 59433 | 14.4% | 6.1%(+8.32)#35 | 6.0%(+8.44)#2,913 |
| 36. | 59756 | 14.3% | 6.1%(+8.18)#36 | 6.0%(+8.29)#2,984 |
| 37. | 59215 | 13.9% | 6.1%(+7.76)#37 | 6.0%(+7.87)#3,193 |
| 38. | 59828 | 13.6% | 6.1%(+7.46)#38 | 6.0%(+7.57)#3,324 |
| 39. | 59873 | 13.2% | 6.1%(+7.14)#39 | 6.0%(+7.25)#3,498 |
| 40. | 59066 | 13.2% | 6.1%(+7.05)#40 | 6.0%(+7.16)#3,545 |
| 41. | 59311 | 13.0% | 6.1%(+6.93)#41 | 6.0%(+7.05)#3,620 |
| 42. | 59538 | 13.0% | 6.1%(+6.90)#42 | 6.0%(+7.01)#3,637 |
| 43. | 59762 | 12.5% | 6.1%(+6.39)#43 | 6.0%(+6.50)#3,990 |
| 44. | 59419 | 12.5% | 6.1%(+6.39)#44 | 6.0%(+6.50)#3,996 |
| 45. | 59018 | 12.4% | 6.1%(+6.32)#45 | 6.0%(+6.43)#4,028 |
| 46. | 59254 | 12.3% | 6.1%(+6.24)#46 | 6.0%(+6.35)#4,085 |
| 47. | 59241 | 12.2% | 6.1%(+6.14)#47 | 6.0%(+6.25)#4,151 |
| 48. | 59739 | 12.2% | 6.1%(+6.14)#48 | 6.0%(+6.25)#4,152 |
| 49. | 59854 | 12.2% | 6.1%(+6.09)#49 | 6.0%(+6.20)#4,184 |
| 50. | 59010 | 12.0% | 6.1%(+5.89)#50 | 6.0%(+6.00)#4,316 |
| 51. | 59212 | 11.9% | 6.1%(+5.75)#51 | 6.0%(+5.87)#4,411 |
| 52. | 59255 | 11.8% | 6.1%(+5.67)#52 | 6.0%(+5.78)#4,463 |
| 53. | 59524 | 11.8% | 6.1%(+5.66)#53 | 6.0%(+5.77)#4,487 |
| 54. | 59829 | 11.5% | 6.1%(+5.42)#54 | 6.0%(+5.53)#4,668 |
| 55. | 59462 | 11.4% | 6.1%(+5.32)#55 | 6.0%(+5.43)#4,748 |
| 56. | 59260 | 11.4% | 6.1%(+5.32)#56 | 6.0%(+5.43)#4,749 |
| 57. | 59270 | 11.3% | 6.1%(+5.20)#57 | 6.0%(+5.31)#4,861 |
| 58. | 59087 | 11.3% | 6.1%(+5.16)#58 | 6.0%(+5.27)#4,899 |
| 59. | 59258 | 11.1% | 6.1%(+5.00)#59 | 6.0%(+5.12)#5,060 |
| 60. | 59647 | 11.0% | 6.1%(+4.93)#60 | 6.0%(+5.05)#5,107 |
| 61. | 59068 | 10.9% | 6.1%(+4.83)#61 | 6.0%(+4.95)#5,181 |
| 62. | 59542 | 10.9% | 6.1%(+4.76)#62 | 6.0%(+4.87)#5,254 |
| 63. | 59859 | 10.8% | 6.1%(+4.71)#63 | 6.0%(+4.82)#5,297 |
| 64. | 59864 | 10.7% | 6.1%(+4.63)#64 | 6.0%(+4.74)#5,382 |
| 65. | 59483 | 10.7% | 6.1%(+4.56)#65 | 6.0%(+4.67)#5,469 |
| 66. | 59858 | 10.6% | 6.1%(+4.50)#66 | 6.0%(+4.61)#5,523 |
| 67. | 59545 | 10.5% | 6.1%(+4.42)#67 | 6.0%(+4.53)#5,621 |
| 68. | 59457 | 10.5% | 6.1%(+4.36)#68 | 6.0%(+4.47)#5,681 |
| 69. | 59834 | 10.4% | 6.1%(+4.30)#69 | 6.0%(+4.42)#5,734 |
| 70. | 59301 | 9.9% | 6.1%(+3.83)#70 | 6.0%(+3.95)#6,334 |
| 71. | 59602 | 9.8% | 6.1%(+3.69)#71 | 6.0%(+3.81)#6,525 |
| 72. | 59436 | 9.7% | 6.1%(+3.60)#72 | 6.0%(+3.71)#6,638 |
| 73. | 59086 | 9.4% | 6.1%(+3.26)#73 | 6.0%(+3.37)#7,145 |
| 74. | 59003 | 9.0% | 6.1%(+2.93)#74 | 6.0%(+3.04)#7,692 |
| 75. | 59922 | 9.0% | 6.1%(+2.92)#75 | 6.0%(+3.03)#7,705 |
| 76. | 59748 | 8.9% | 6.1%(+2.82)#76 | 6.0%(+2.93)#7,865 |
| 77. | 59758 | 8.8% | 6.1%(+2.69)#77 | 6.0%(+2.81)#8,081 |
| 78. | 59464 | 8.7% | 6.1%(+2.54)#78 | 6.0%(+2.66)#8,335 |
| 79. | 59338 | 8.6% | 6.1%(+2.46)#79 | 6.0%(+2.58)#8,496 |
| 80. | 59486 | 8.5% | 6.1%(+2.43)#80 | 6.0%(+2.55)#8,547 |
| 81. | 59923 | 8.5% | 6.1%(+2.36)#81 | 6.0%(+2.48)#8,687 |
| 82. | 59913 | 8.4% | 6.1%(+2.29)#82 | 6.0%(+2.40)#8,821 |
| 83. | 59077 | 8.3% | 6.1%(+2.22)#83 | 6.0%(+2.34)#8,986 |
| 84. | 59870 | 8.3% | 6.1%(+2.17)#84 | 6.0%(+2.29)#9,076 |
| 85. | 59937 | 8.3% | 6.1%(+2.17)#85 | 6.0%(+2.28)#9,084 |
| 86. | 59434 | 8.2% | 6.1%(+2.10)#86 | 6.0%(+2.22)#9,202 |
| 87. | 59401 | 8.2% | 6.1%(+2.08)#87 | 6.0%(+2.19)#9,252 |
| 88. | 59317 | 8.1% | 6.1%(+2.04)#88 | 6.0%(+2.15)#9,341 |
| 89. | 59404 | 7.9% | 6.1%(+1.82)#89 | 6.0%(+1.94)#9,804 |
| 90. | 59759 | 7.9% | 6.1%(+1.75)#90 | 6.0%(+1.87)#9,932 |
| 91. | 59729 | 7.8% | 6.1%(+1.73)#91 | 6.0%(+1.84)#9,991 |
| 92. | 59427 | 7.7% | 6.1%(+1.63)#92 | 6.0%(+1.74)#10,188 |
| 93. | 59011 | 7.7% | 6.1%(+1.61)#93 | 6.0%(+1.72)#10,225 |
| 94. | 59250 | 7.7% | 6.1%(+1.58)#94 | 6.0%(+1.70)#10,315 |
| 95. | 59469 | 7.7% | 6.1%(+1.58)#95 | 6.0%(+1.70)#10,319 |
| 96. | 59230 | 7.7% | 6.1%(+1.56)#96 | 6.0%(+1.67)#10,367 |
| 97. | 59722 | 7.6% | 6.1%(+1.53)#97 | 6.0%(+1.64)#10,417 |
| 98. | 59714 | 7.6% | 6.1%(+1.48)#98 | 6.0%(+1.59)#10,513 |
| 99. | 59634 | 7.6% | 6.1%(+1.44)#99 | 6.0%(+1.56)#10,589 |
| 100. | 59008 | 7.5% | 6.1%(+1.37)#100 | 6.0%(+1.48)#10,777 |
Common Questions
What are the Top 10 Zip Codes with the Highest Percentage of Population with a Degree in Arts and Humanities in Montana?
Top 10 Zip Codes with the Highest Percentage of Population with a Degree in Arts and Humanities in Montana are:
What zip code has the Highest Percentage of Population with a Degree in Arts and Humanities in Montana?
59223 has the Highest Percentage of Population with a Degree in Arts and Humanities in Montana with 100.0%.
What is the Percentage of Population with a Degree in Arts and Humanities in the State of Montana?
Percentage of Population with a Degree in Arts and Humanities in Montana is 6.1%.
What is the Percentage of Population with a Degree in Arts and Humanities in the United States?
Percentage of Population with a Degree in Arts and Humanities in the United States is 6.0%.