Zip Codes with the Highest Percentage of Population with a Degree in Literature and Languages in Montana
RELATED REPORTS & OPTIONS
Literature and Languages
Montana
Compare Zip Codes
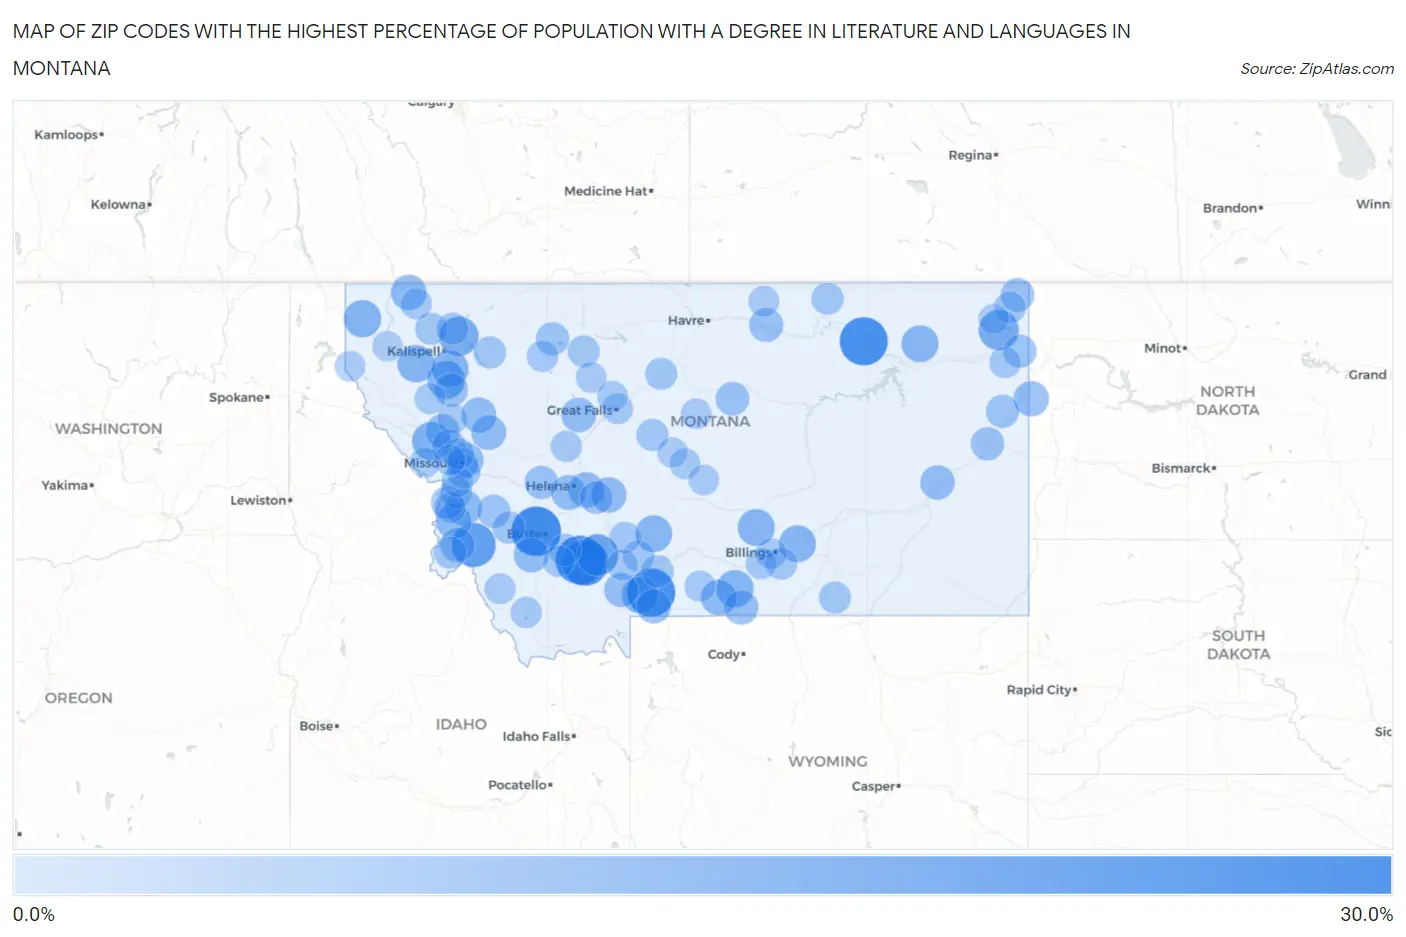
Map of Zip Codes with the Highest Percentage of Population with a Degree in Literature and Languages in Montana
0.0%
30.0%
Zip Codes with the Highest Percentage of Population with a Degree in Literature and Languages in Montana
| Zip Code | % Graduates | vs State | vs National | |
| 1. | 59748 | 26.8% | 4.6%(+22.2)#1 | 4.4%(+22.4)#261 |
| 2. | 59747 | 25.9% | 4.6%(+21.3)#2 | 4.4%(+21.5)#284 |
| 3. | 59065 | 25.0% | 4.6%(+20.4)#3 | 4.4%(+20.6)#314 |
| 4. | 59273 | 25.0% | 4.6%(+20.4)#4 | 4.4%(+20.6)#319 |
| 5. | 59735 | 23.2% | 4.6%(+18.6)#5 | 4.4%(+18.8)#353 |
| 6. | 59871 | 20.0% | 4.6%(+15.4)#6 | 4.4%(+15.6)#473 |
| 7. | 59760 | 17.2% | 4.6%(+12.7)#7 | 4.4%(+12.8)#620 |
| 8. | 59242 | 15.4% | 4.6%(+10.8)#8 | 4.4%(+11.0)#784 |
| 9. | 59919 | 14.6% | 4.6%(+9.98)#9 | 4.4%(+10.1)#868 |
| 10. | 59846 | 13.3% | 4.6%(+8.73)#10 | 4.4%(+8.90)#1,011 |
| 11. | 59914 | 12.5% | 4.6%(+7.92)#11 | 4.4%(+8.09)#1,145 |
| 12. | 59925 | 12.1% | 4.6%(+7.48)#12 | 4.4%(+7.64)#1,212 |
| 13. | 59935 | 12.0% | 4.6%(+7.42)#13 | 4.4%(+7.59)#1,224 |
| 14. | 59070 | 11.9% | 4.6%(+7.35)#14 | 4.4%(+7.52)#1,234 |
| 15. | 59922 | 11.7% | 4.6%(+7.10)#15 | 4.4%(+7.27)#1,290 |
| 16. | 59006 | 11.5% | 4.6%(+6.96)#16 | 4.4%(+7.13)#1,323 |
| 17. | 59015 | 11.5% | 4.6%(+6.90)#17 | 4.4%(+7.07)#1,338 |
| 18. | 59225 | 11.4% | 4.6%(+6.85)#18 | 4.4%(+7.02)#1,350 |
| 19. | 59086 | 11.4% | 4.6%(+6.79)#19 | 4.4%(+6.96)#1,370 |
| 20. | 59027 | 11.0% | 4.6%(+6.47)#20 | 4.4%(+6.64)#1,459 |
| 21. | 59828 | 10.5% | 4.6%(+5.92)#21 | 4.4%(+6.09)#1,640 |
| 22. | 59068 | 10.0% | 4.6%(+5.46)#22 | 4.4%(+5.63)#1,801 |
| 23. | 59840 | 9.9% | 4.6%(+5.28)#23 | 4.4%(+5.44)#1,894 |
| 24. | 59917 | 9.8% | 4.6%(+5.26)#24 | 4.4%(+5.43)#1,896 |
| 25. | 59635 | 9.7% | 4.6%(+5.15)#25 | 4.4%(+5.32)#1,942 |
| 26. | 59644 | 9.6% | 4.6%(+5.04)#26 | 4.4%(+5.21)#1,988 |
| 27. | 59270 | 9.4% | 4.6%(+4.83)#27 | 4.4%(+5.00)#2,082 |
| 28. | 59826 | 9.3% | 4.6%(+4.69)#28 | 4.4%(+4.86)#2,165 |
| 29. | 59601 | 9.2% | 4.6%(+4.63)#29 | 4.4%(+4.79)#2,203 |
| 30. | 59727 | 9.2% | 4.6%(+4.59)#30 | 4.4%(+4.76)#2,228 |
| 31. | 59868 | 9.1% | 4.6%(+4.53)#31 | 4.4%(+4.70)#2,256 |
| 32. | 59477 | 8.8% | 4.6%(+4.19)#32 | 4.4%(+4.36)#2,430 |
| 33. | 59802 | 8.6% | 4.6%(+4.00)#33 | 4.4%(+4.17)#2,561 |
| 34. | 59338 | 8.6% | 4.6%(+3.99)#34 | 4.4%(+4.16)#2,567 |
| 35. | 59827 | 8.4% | 4.6%(+3.84)#35 | 4.4%(+4.01)#2,670 |
| 36. | 59008 | 8.4% | 4.6%(+3.83)#36 | 4.4%(+4.00)#2,676 |
| 37. | 59030 | 8.3% | 4.6%(+3.76)#37 | 4.4%(+3.92)#2,722 |
| 38. | 59730 | 8.2% | 4.6%(+3.66)#38 | 4.4%(+3.83)#2,793 |
| 39. | 59831 | 8.1% | 4.6%(+3.56)#39 | 4.4%(+3.73)#2,870 |
| 40. | 59526 | 8.0% | 4.6%(+3.44)#40 | 4.4%(+3.60)#2,965 |
| 41. | 59834 | 7.6% | 4.6%(+3.01)#41 | 4.4%(+3.18)#3,356 |
| 42. | 59275 | 7.5% | 4.6%(+2.97)#42 | 4.4%(+3.14)#3,394 |
| 43. | 59489 | 7.5% | 4.6%(+2.97)#43 | 4.4%(+3.14)#3,396 |
| 44. | 59860 | 7.4% | 4.6%(+2.83)#44 | 4.4%(+3.00)#3,535 |
| 45. | 59330 | 7.2% | 4.6%(+2.63)#45 | 4.4%(+2.80)#3,747 |
| 46. | 59713 | 7.1% | 4.6%(+2.56)#46 | 4.4%(+2.73)#3,825 |
| 47. | 59803 | 7.1% | 4.6%(+2.52)#47 | 4.4%(+2.69)#3,867 |
| 48. | 59858 | 7.1% | 4.6%(+2.49)#48 | 4.4%(+2.66)#3,917 |
| 49. | 59486 | 7.0% | 4.6%(+2.46)#49 | 4.4%(+2.63)#3,962 |
| 50. | 59262 | 7.0% | 4.6%(+2.40)#50 | 4.4%(+2.57)#4,020 |
| 51. | 59212 | 6.8% | 4.6%(+2.20)#51 | 4.4%(+2.37)#4,269 |
| 52. | 59647 | 6.7% | 4.6%(+2.17)#52 | 4.4%(+2.34)#4,307 |
| 53. | 59875 | 6.7% | 4.6%(+2.15)#53 | 4.4%(+2.32)#4,334 |
| 54. | 59829 | 6.2% | 4.6%(+1.59)#54 | 4.4%(+1.76)#5,139 |
| 55. | 59711 | 6.1% | 4.6%(+1.57)#55 | 4.4%(+1.74)#5,177 |
| 56. | 59047 | 6.1% | 4.6%(+1.54)#56 | 4.4%(+1.71)#5,249 |
| 57. | 59759 | 5.9% | 4.6%(+1.35)#57 | 4.4%(+1.52)#5,545 |
| 58. | 59936 | 5.9% | 4.6%(+1.34)#58 | 4.4%(+1.50)#5,578 |
| 59. | 59544 | 5.9% | 4.6%(+1.30)#59 | 4.4%(+1.47)#5,638 |
| 60. | 59469 | 5.8% | 4.6%(+1.19)#60 | 4.4%(+1.36)#5,809 |
| 61. | 59937 | 5.6% | 4.6%(+1.06)#61 | 4.4%(+1.23)#6,050 |
| 62. | 59442 | 5.6% | 4.6%(+1.06)#62 | 4.4%(+1.23)#6,054 |
| 63. | 59912 | 5.6% | 4.6%(+1.05)#63 | 4.4%(+1.21)#6,080 |
| 64. | 59050 | 5.6% | 4.6%(+1.01)#64 | 4.4%(+1.18)#6,153 |
| 65. | 59425 | 5.4% | 4.6%(+0.820)#65 | 4.4%(+0.988)#6,521 |
| 66. | 59870 | 5.3% | 4.6%(+0.770)#66 | 4.4%(+0.939)#6,622 |
| 67. | 59101 | 5.3% | 4.6%(+0.741)#67 | 4.4%(+0.909)#6,686 |
| 68. | 59715 | 5.3% | 4.6%(+0.694)#68 | 4.4%(+0.863)#6,781 |
| 69. | 59211 | 5.3% | 4.6%(+0.685)#69 | 4.4%(+0.854)#6,815 |
| 70. | 59801 | 5.2% | 4.6%(+0.618)#70 | 4.4%(+0.787)#6,950 |
| 71. | 59751 | 5.1% | 4.6%(+0.485)#71 | 4.4%(+0.654)#7,203 |
| 72. | 59714 | 5.0% | 4.6%(+0.439)#72 | 4.4%(+0.608)#7,315 |
| 73. | 59841 | 5.0% | 4.6%(+0.422)#73 | 4.4%(+0.590)#7,352 |
| 74. | 59432 | 5.0% | 4.6%(+0.422)#74 | 4.4%(+0.590)#7,360 |
| 75. | 59218 | 4.9% | 4.6%(+0.276)#75 | 4.4%(+0.445)#7,754 |
| 76. | 59918 | 4.8% | 4.6%(+0.261)#76 | 4.4%(+0.429)#7,795 |
| 77. | 59833 | 4.8% | 4.6%(+0.237)#77 | 4.4%(+0.406)#7,853 |
| 78. | 59725 | 4.8% | 4.6%(+0.207)#78 | 4.4%(+0.376)#7,931 |
| 79. | 59648 | 4.8% | 4.6%(+0.184)#79 | 4.4%(+0.352)#8,022 |
| 80. | 59808 | 4.5% | 4.6%(-0.046)#80 | 4.4%(+0.122)#8,636 |
| 81. | 59718 | 4.5% | 4.6%(-0.058)#81 | 4.4%(+0.110)#8,666 |
| 82. | 59061 | 4.5% | 4.6%(-0.084)#82 | 4.4%(+0.085)#8,732 |
| 83. | 59845 | 4.4% | 4.6%(-0.166)#83 | 4.4%(+0.002)#8,964 |
| 84. | 59044 | 4.4% | 4.6%(-0.192)#84 | 4.4%(-0.023)#9,034 |
| 85. | 59452 | 4.4% | 4.6%(-0.192)#85 | 4.4%(-0.024)#9,041 |
| 86. | 59401 | 4.4% | 4.6%(-0.216)#86 | 4.4%(-0.048)#9,110 |
| 87. | 59736 | 4.3% | 4.6%(-0.230)#87 | 4.4%(-0.062)#9,165 |
| 88. | 59102 | 4.3% | 4.6%(-0.273)#88 | 4.4%(-0.105)#9,284 |
| 89. | 59804 | 4.3% | 4.6%(-0.303)#89 | 4.4%(-0.134)#9,382 |
| 90. | 59529 | 4.3% | 4.6%(-0.323)#90 | 4.4%(-0.154)#9,448 |
| 91. | 59433 | 4.1% | 4.6%(-0.454)#91 | 4.4%(-0.286)#9,842 |
| 92. | 59404 | 4.0% | 4.6%(-0.582)#92 | 4.4%(-0.413)#10,186 |
| 93. | 59430 | 4.0% | 4.6%(-0.618)#93 | 4.4%(-0.449)#10,299 |
| 94. | 59453 | 3.9% | 4.6%(-0.631)#94 | 4.4%(-0.462)#10,338 |
| 95. | 59824 | 3.9% | 4.6%(-0.705)#95 | 4.4%(-0.536)#10,583 |
| 96. | 59844 | 3.9% | 4.6%(-0.711)#96 | 4.4%(-0.542)#10,607 |
| 97. | 59258 | 3.7% | 4.6%(-0.874)#97 | 4.4%(-0.706)#11,155 |
| 98. | 59923 | 3.7% | 4.6%(-0.901)#98 | 4.4%(-0.733)#11,241 |
| 99. | 59820 | 3.7% | 4.6%(-0.920)#99 | 4.4%(-0.751)#11,301 |
| 100. | 59479 | 3.6% | 4.6%(-0.942)#100 | 4.4%(-0.773)#11,369 |
Common Questions
What are the Top 10 Zip Codes with the Highest Percentage of Population with a Degree in Literature and Languages in Montana?
Top 10 Zip Codes with the Highest Percentage of Population with a Degree in Literature and Languages in Montana are:
What zip code has the Highest Percentage of Population with a Degree in Literature and Languages in Montana?
59748 has the Highest Percentage of Population with a Degree in Literature and Languages in Montana with 26.8%.
What is the Percentage of Population with a Degree in Literature and Languages in the State of Montana?
Percentage of Population with a Degree in Literature and Languages in Montana is 4.6%.
What is the Percentage of Population with a Degree in Literature and Languages in the United States?
Percentage of Population with a Degree in Literature and Languages in the United States is 4.4%.