Zip Codes with the Highest Percentage of Population Employed in Education Instruction & Library in Montana
RELATED REPORTS & OPTIONS
Education Instruction & Library
Montana
Compare Zip Codes
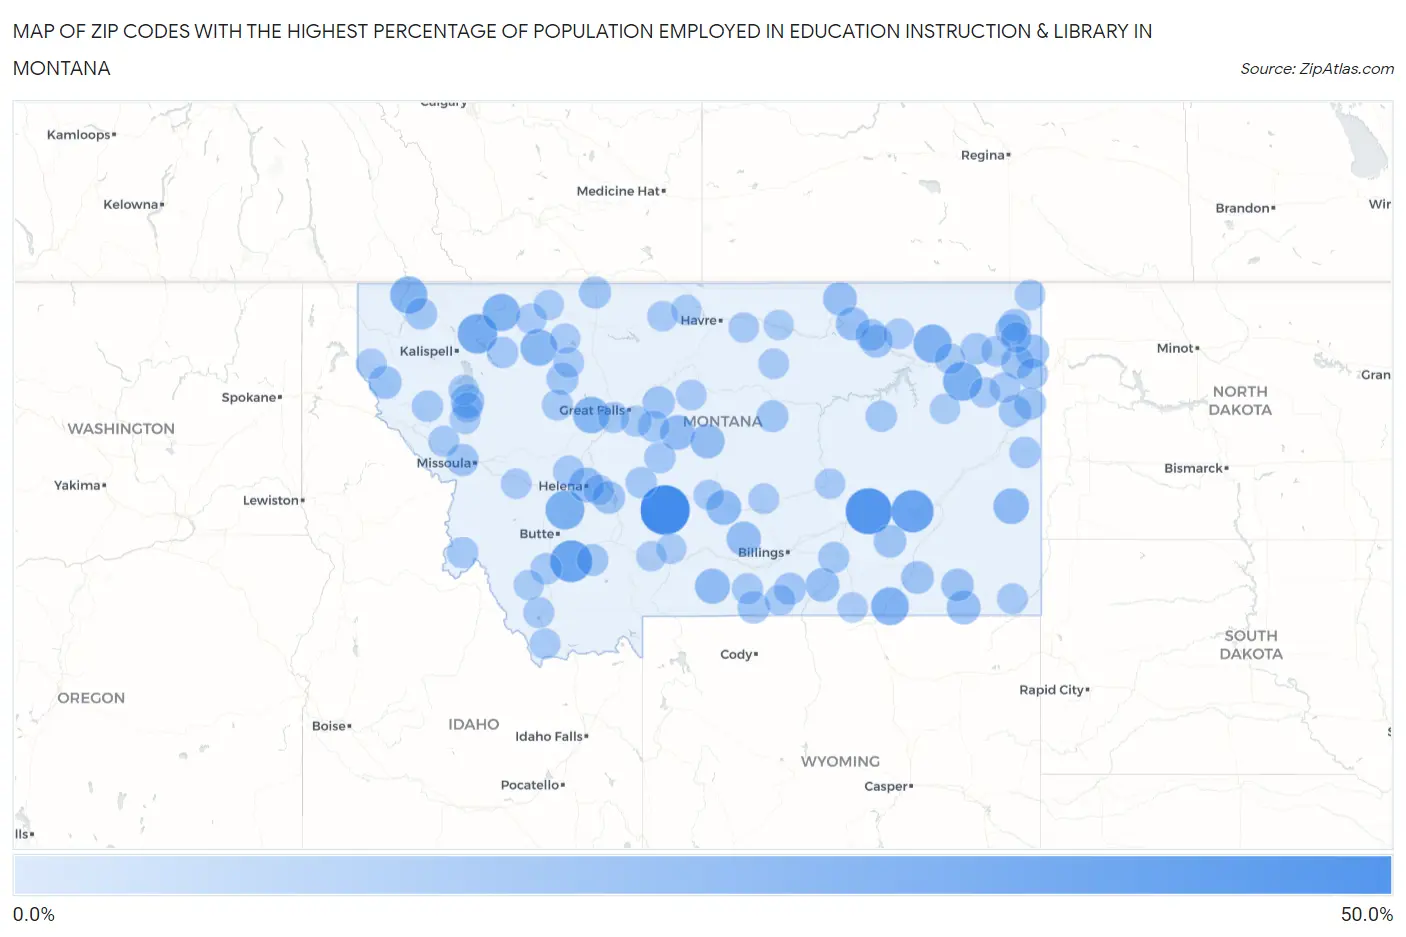
Map of Zip Codes with the Highest Percentage of Population Employed in Education Instruction & Library in Montana
0.0%
50.0%
Zip Codes with the Highest Percentage of Population Employed in Education Instruction & Library in Montana
| Zip Code | % Employed | vs State | vs National | |
| 1. | 59642 | 47.1% | 5.7%(+41.4)#1 | 6.2%(+40.9)#89 |
| 2. | 59076 | 40.0% | 5.7%(+34.3)#2 | 6.2%(+33.8)#133 |
| 3. | 59333 | 31.8% | 5.7%(+26.2)#3 | 6.2%(+25.6)#235 |
| 4. | 59751 | 31.0% | 5.7%(+25.3)#4 | 6.2%(+24.8)#253 |
| 5. | 59913 | 26.4% | 5.7%(+20.7)#5 | 6.2%(+20.2)#332 |
| 6. | 59274 | 25.0% | 5.7%(+19.3)#6 | 6.2%(+18.8)#364 |
| 7. | 59631 | 24.6% | 5.7%(+19.0)#7 | 6.2%(+18.4)#382 |
| 8. | 59225 | 23.5% | 5.7%(+17.8)#8 | 6.2%(+17.3)#440 |
| 9. | 59025 | 22.2% | 5.7%(+16.6)#9 | 6.2%(+16.0)#504 |
| 10. | 59434 | 21.6% | 5.7%(+16.0)#10 | 6.2%(+15.5)#530 |
| 11. | 59930 | 21.6% | 5.7%(+15.9)#11 | 6.2%(+15.4)#532 |
| 12. | 59448 | 20.4% | 5.7%(+14.7)#12 | 6.2%(+14.2)#616 |
| 13. | 59477 | 20.2% | 5.7%(+14.5)#13 | 6.2%(+14.0)#634 |
| 14. | 59344 | 18.4% | 5.7%(+12.7)#14 | 6.2%(+12.2)#795 |
| 15. | 59061 | 17.2% | 5.7%(+11.5)#15 | 6.2%(+11.0)#930 |
| 16. | 59078 | 16.7% | 5.7%(+11.0)#16 | 6.2%(+10.5)#1,004 |
| 17. | 59625 | 16.4% | 5.7%(+10.7)#17 | 6.2%(+10.2)#1,047 |
| 18. | 59447 | 16.4% | 5.7%(+10.7)#18 | 6.2%(+10.2)#1,048 |
| 19. | 59067 | 15.8% | 5.7%(+10.2)#19 | 6.2%(+9.66)#1,123 |
| 20. | 59462 | 15.6% | 5.7%(+9.89)#20 | 6.2%(+9.37)#1,176 |
| 21. | 59314 | 14.6% | 5.7%(+8.97)#21 | 6.2%(+8.45)#1,353 |
| 22. | 59544 | 14.6% | 5.7%(+8.92)#22 | 6.2%(+8.40)#1,370 |
| 23. | 59075 | 14.5% | 5.7%(+8.81)#23 | 6.2%(+8.29)#1,395 |
| 24. | 59855 | 14.3% | 5.7%(+8.62)#24 | 6.2%(+8.10)#1,451 |
| 25. | 59212 | 14.0% | 5.7%(+8.30)#25 | 6.2%(+7.78)#1,552 |
| 26. | 59261 | 13.7% | 5.7%(+8.08)#26 | 6.2%(+7.55)#1,636 |
| 27. | 59874 | 13.4% | 5.7%(+7.72)#27 | 6.2%(+7.20)#1,756 |
| 28. | 59003 | 12.6% | 5.7%(+6.93)#28 | 6.2%(+6.41)#2,077 |
| 29. | 59647 | 12.5% | 5.7%(+6.84)#29 | 6.2%(+6.32)#2,119 |
| 30. | 59273 | 12.5% | 5.7%(+6.84)#30 | 6.2%(+6.32)#2,135 |
| 31. | 59317 | 12.4% | 5.7%(+6.71)#31 | 6.2%(+6.18)#2,189 |
| 32. | 59218 | 12.3% | 5.7%(+6.67)#32 | 6.2%(+6.15)#2,219 |
| 33. | 59323 | 12.2% | 5.7%(+6.58)#33 | 6.2%(+6.06)#2,268 |
| 34. | 59450 | 11.6% | 5.7%(+5.94)#34 | 6.2%(+5.42)#2,633 |
| 35. | 59008 | 11.6% | 5.7%(+5.93)#35 | 6.2%(+5.41)#2,638 |
| 36. | 59262 | 11.5% | 5.7%(+5.86)#36 | 6.2%(+5.34)#2,685 |
| 37. | 59247 | 11.5% | 5.7%(+5.85)#37 | 6.2%(+5.33)#2,689 |
| 38. | 59482 | 11.4% | 5.7%(+5.74)#38 | 6.2%(+5.22)#2,773 |
| 39. | 59804 | 11.4% | 5.7%(+5.73)#39 | 6.2%(+5.20)#2,797 |
| 40. | 59066 | 11.3% | 5.7%(+5.64)#40 | 6.2%(+5.12)#2,843 |
| 41. | 59217 | 11.1% | 5.7%(+5.45)#41 | 6.2%(+4.93)#2,985 |
| 42. | 59242 | 11.1% | 5.7%(+5.45)#42 | 6.2%(+4.93)#2,990 |
| 43. | 59422 | 11.0% | 5.7%(+5.33)#43 | 6.2%(+4.81)#3,060 |
| 44. | 59747 | 10.8% | 5.7%(+5.09)#44 | 6.2%(+4.57)#3,239 |
| 45. | 59471 | 10.7% | 5.7%(+5.01)#45 | 6.2%(+4.48)#3,304 |
| 46. | 59241 | 10.6% | 5.7%(+4.99)#46 | 6.2%(+4.46)#3,317 |
| 47. | 59934 | 10.5% | 5.7%(+4.87)#47 | 6.2%(+4.34)#3,434 |
| 48. | 59353 | 10.1% | 5.7%(+4.44)#48 | 6.2%(+3.92)#3,827 |
| 49. | 59829 | 10.1% | 5.7%(+4.40)#49 | 6.2%(+3.88)#3,869 |
| 50. | 59255 | 10.0% | 5.7%(+4.34)#50 | 6.2%(+3.82)#3,914 |
| 51. | 59465 | 10.0% | 5.7%(+4.34)#51 | 6.2%(+3.82)#3,934 |
| 52. | 59337 | 9.9% | 5.7%(+4.29)#52 | 6.2%(+3.76)#3,995 |
| 53. | 59412 | 9.9% | 5.7%(+4.23)#53 | 6.2%(+3.71)#4,061 |
| 54. | 59743 | 9.9% | 5.7%(+4.20)#54 | 6.2%(+3.68)#4,111 |
| 55. | 59859 | 9.9% | 5.7%(+4.20)#55 | 6.2%(+3.67)#4,114 |
| 56. | 59645 | 9.8% | 5.7%(+4.13)#56 | 6.2%(+3.60)#4,188 |
| 57. | 59640 | 9.8% | 5.7%(+4.10)#57 | 6.2%(+3.57)#4,218 |
| 58. | 59936 | 9.7% | 5.7%(+4.08)#58 | 6.2%(+3.56)#4,235 |
| 59. | 59034 | 9.6% | 5.7%(+3.96)#59 | 6.2%(+3.44)#4,370 |
| 60. | 59070 | 9.3% | 5.7%(+3.67)#60 | 6.2%(+3.15)#4,748 |
| 61. | 59410 | 9.2% | 5.7%(+3.58)#61 | 6.2%(+3.05)#4,885 |
| 62. | 59725 | 9.1% | 5.7%(+3.47)#62 | 6.2%(+2.95)#5,016 |
| 63. | 59221 | 9.1% | 5.7%(+3.47)#63 | 6.2%(+2.95)#5,017 |
| 64. | 59472 | 9.1% | 5.7%(+3.39)#64 | 6.2%(+2.87)#5,146 |
| 65. | 59846 | 9.0% | 5.7%(+3.38)#65 | 6.2%(+2.86)#5,171 |
| 66. | 59485 | 8.8% | 5.7%(+3.12)#66 | 6.2%(+2.59)#5,572 |
| 67. | 59311 | 8.7% | 5.7%(+3.03)#67 | 6.2%(+2.51)#5,740 |
| 68. | 59014 | 8.7% | 5.7%(+3.00)#68 | 6.2%(+2.48)#5,809 |
| 69. | 59417 | 8.6% | 5.7%(+2.95)#69 | 6.2%(+2.43)#5,901 |
| 70. | 59243 | 8.6% | 5.7%(+2.94)#70 | 6.2%(+2.41)#5,931 |
| 71. | 59824 | 8.5% | 5.7%(+2.87)#71 | 6.2%(+2.35)#6,035 |
| 72. | 59467 | 8.5% | 5.7%(+2.79)#72 | 6.2%(+2.27)#6,182 |
| 73. | 59046 | 8.4% | 5.7%(+2.75)#73 | 6.2%(+2.22)#6,276 |
| 74. | 59213 | 8.4% | 5.7%(+2.74)#74 | 6.2%(+2.22)#6,286 |
| 75. | 59832 | 8.3% | 5.7%(+2.67)#75 | 6.2%(+2.15)#6,441 |
| 76. | 59724 | 8.3% | 5.7%(+2.67)#76 | 6.2%(+2.15)#6,461 |
| 77. | 59527 | 8.3% | 5.7%(+2.65)#77 | 6.2%(+2.13)#6,505 |
| 78. | 59259 | 8.3% | 5.7%(+2.63)#78 | 6.2%(+2.11)#6,541 |
| 79. | 59446 | 8.3% | 5.7%(+2.61)#79 | 6.2%(+2.09)#6,566 |
| 80. | 59275 | 8.3% | 5.7%(+2.61)#80 | 6.2%(+2.09)#6,573 |
| 81. | 59523 | 8.3% | 5.7%(+2.60)#81 | 6.2%(+2.08)#6,585 |
| 82. | 59231 | 8.2% | 5.7%(+2.57)#82 | 6.2%(+2.05)#6,647 |
| 83. | 59530 | 8.2% | 5.7%(+2.54)#83 | 6.2%(+2.01)#6,721 |
| 84. | 59635 | 8.2% | 5.7%(+2.53)#84 | 6.2%(+2.01)#6,741 |
| 85. | 59226 | 8.2% | 5.7%(+2.51)#85 | 6.2%(+1.99)#6,780 |
| 86. | 59201 | 8.1% | 5.7%(+2.45)#86 | 6.2%(+1.93)#6,908 |
| 87. | 59054 | 8.1% | 5.7%(+2.45)#87 | 6.2%(+1.92)#6,916 |
| 88. | 59036 | 8.1% | 5.7%(+2.42)#88 | 6.2%(+1.90)#6,968 |
| 89. | 59486 | 8.1% | 5.7%(+2.41)#89 | 6.2%(+1.89)#6,986 |
| 90. | 59715 | 7.9% | 5.7%(+2.28)#90 | 6.2%(+1.76)#7,294 |
| 91. | 59860 | 7.9% | 5.7%(+2.24)#91 | 6.2%(+1.72)#7,381 |
| 92. | 59525 | 7.9% | 5.7%(+2.20)#92 | 6.2%(+1.68)#7,469 |
| 93. | 59864 | 7.8% | 5.7%(+2.16)#93 | 6.2%(+1.64)#7,571 |
| 94. | 59853 | 7.8% | 5.7%(+2.15)#94 | 6.2%(+1.63)#7,600 |
| 95. | 59089 | 7.8% | 5.7%(+2.12)#95 | 6.2%(+1.59)#7,698 |
| 96. | 59215 | 7.7% | 5.7%(+2.07)#96 | 6.2%(+1.55)#7,794 |
| 97. | 59018 | 7.7% | 5.7%(+2.05)#97 | 6.2%(+1.53)#7,852 |
| 98. | 59746 | 7.7% | 5.7%(+2.03)#98 | 6.2%(+1.51)#7,932 |
| 99. | 59427 | 7.6% | 5.7%(+1.96)#99 | 6.2%(+1.44)#8,125 |
| 100. | 59526 | 7.6% | 5.7%(+1.93)#100 | 6.2%(+1.41)#8,202 |
Common Questions
What are the Top 10 Zip Codes with the Highest Percentage of Population Employed in Education Instruction & Library in Montana?
Top 10 Zip Codes with the Highest Percentage of Population Employed in Education Instruction & Library in Montana are:
What zip code has the Highest Percentage of Population Employed in Education Instruction & Library in Montana?
59642 has the Highest Percentage of Population Employed in Education Instruction & Library in Montana with 47.1%.
What is the Percentage of Population Employed in Education Instruction & Library in the State of Montana?
Percentage of Population Employed in Education Instruction & Library in Montana is 5.7%.
What is the Percentage of Population Employed in Education Instruction & Library in the United States?
Percentage of Population Employed in Education Instruction & Library in the United States is 6.2%.