Zip Codes with the Highest Percentage of Population with a Degree in Bio, Nature & Agricultural in Montana
RELATED REPORTS & OPTIONS
Bio, Nature & Agricultural
Montana
Compare Zip Codes
Map of Zip Codes with the Highest Percentage of Population with a Degree in Bio, Nature & Agricultural in Montana
0.0%
100.0%
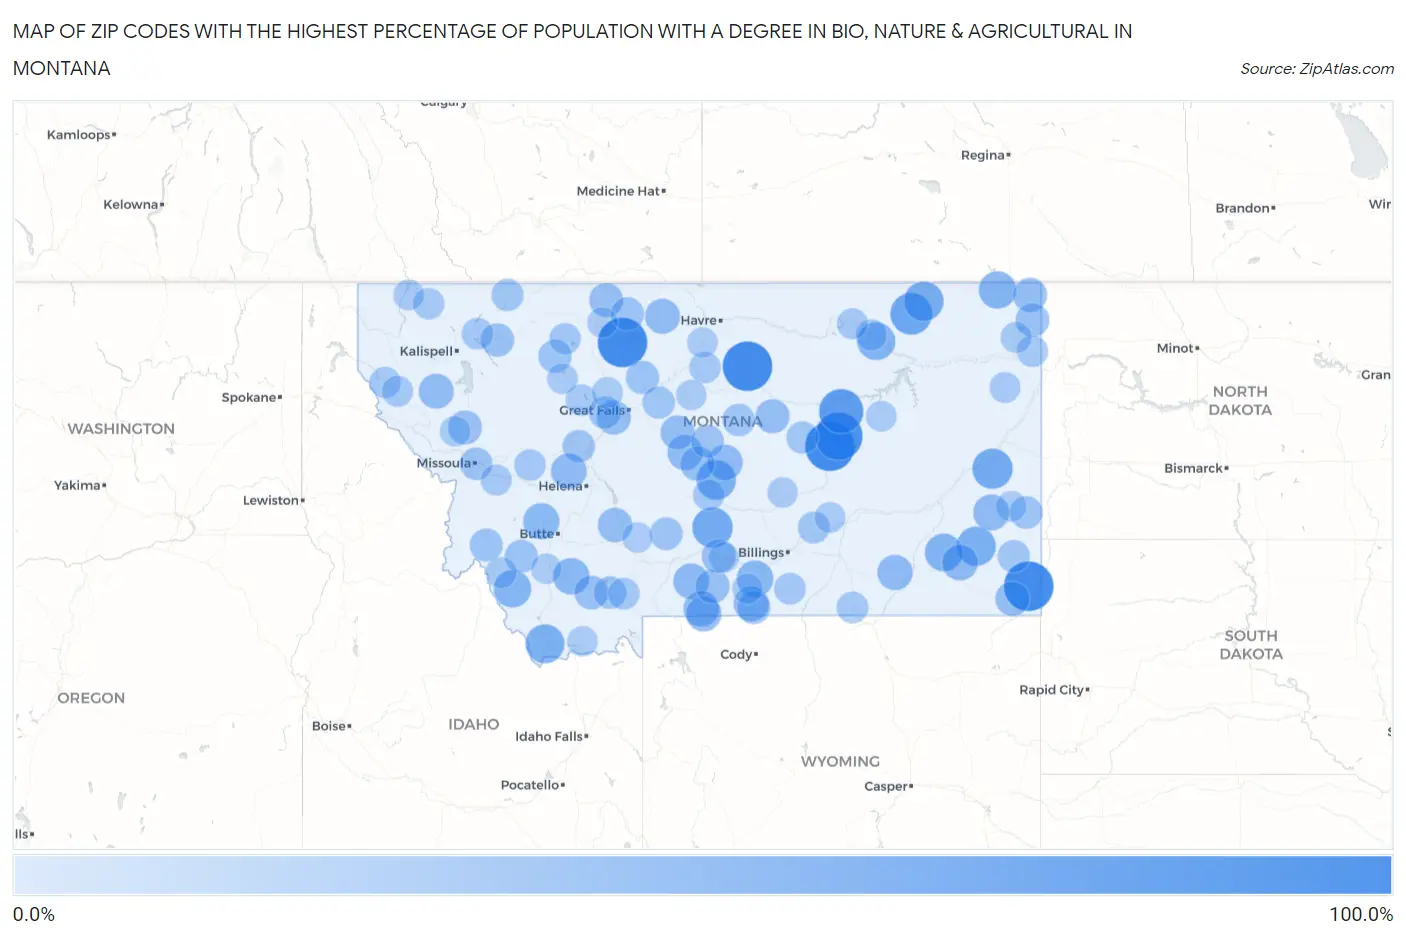
Zip Codes with the Highest Percentage of Population with a Degree in Bio, Nature & Agricultural in Montana
| Zip Code | % Graduates | vs State | vs National | |
| 1. | 59456 | 100.0% | 11.2% (+88.8)#1 | 6.4% (+93.6)#39 |
| 2. | 59535 | 100.0% | 11.2% (+88.8)#2 | 6.4% (+93.6)#77 |
| 3. | 59058 | 100.0% | 11.2% (+88.8)#3 | 6.4% (+93.6)#82 |
| 4. | 59319 | 100.0% | 11.2% (+88.8)#4 | 6.4% (+93.6)#83 |
| 5. | 59077 | 91.7% | 11.2% (+80.5)#5 | 6.4% (+85.3)#97 |
| 6. | 59318 | 77.3% | 11.2% (+66.1)#6 | 6.4% (+70.9)#121 |
| 7. | 59244 | 66.7% | 11.2% (+55.5)#7 | 6.4% (+60.3)#179 |
| 8. | 59055 | 60.9% | 11.2% (+49.7)#8 | 6.4% (+54.5)#219 |
| 9. | 59326 | 60.0% | 11.2% (+48.8)#9 | 6.4% (+53.6)#221 |
| 10. | 59260 | 57.1% | 11.2% (+45.9)#10 | 6.4% (+50.8)#249 |
| 11. | 59453 | 56.6% | 11.2% (+45.4)#11 | 6.4% (+50.2)#253 |
| 12. | 59345 | 55.6% | 11.2% (+44.4)#12 | 6.4% (+49.2)#266 |
| 13. | 59724 | 54.3% | 11.2% (+43.1)#13 | 6.4% (+47.9)#283 |
| 14. | 59273 | 50.0% | 11.2% (+38.8)#14 | 6.4% (+43.6)#373 |
| 15. | 59351 | 49.2% | 11.2% (+38.0)#15 | 6.4% (+42.9)#378 |
| 16. | 59252 | 48.1% | 11.2% (+37.0)#16 | 6.4% (+41.8)#395 |
| 17. | 59736 | 47.8% | 11.2% (+36.6)#17 | 6.4% (+41.5)#402 |
| 18. | 59013 | 44.7% | 11.2% (+33.5)#18 | 6.4% (+38.3)#461 |
| 19. | 59754 | 43.9% | 11.2% (+32.7)#19 | 6.4% (+37.5)#484 |
| 20. | 59756 | 42.9% | 11.2% (+31.7)#20 | 6.4% (+36.5)#499 |
| 21. | 59336 | 41.8% | 11.2% (+30.6)#21 | 6.4% (+35.5)#525 |
| 22. | 59343 | 41.2% | 11.2% (+30.0)#22 | 6.4% (+34.8)#536 |
| 23. | 59052 | 41.1% | 11.2% (+29.9)#23 | 6.4% (+34.7)#538 |
| 24. | 59020 | 40.0% | 11.2% (+28.8)#24 | 6.4% (+33.6)#579 |
| 25. | 59640 | 40.0% | 11.2% (+28.8)#25 | 6.4% (+33.6)#581 |
| 26. | 59464 | 39.4% | 11.2% (+28.2)#26 | 6.4% (+33.1)#592 |
| 27. | 59081 | 39.1% | 11.2% (+27.9)#27 | 6.4% (+32.8)#601 |
| 28. | 59043 | 38.9% | 11.2% (+27.7)#28 | 6.4% (+32.6)#609 |
| 29. | 59007 | 38.2% | 11.2% (+27.0)#29 | 6.4% (+31.9)#635 |
| 30. | 59479 | 38.2% | 11.2% (+27.0)#30 | 6.4% (+31.8)#636 |
| 31. | 59530 | 37.8% | 11.2% (+26.6)#31 | 6.4% (+31.5)#650 |
| 32. | 59848 | 37.5% | 11.2% (+26.3)#32 | 6.4% (+31.1)#668 |
| 33. | 59643 | 35.3% | 11.2% (+24.1)#33 | 6.4% (+28.9)#755 |
| 34. | 59452 | 35.1% | 11.2% (+23.9)#34 | 6.4% (+28.7)#768 |
| 35. | 59311 | 34.8% | 11.2% (+23.6)#35 | 6.4% (+28.4)#783 |
| 36. | 59485 | 34.5% | 11.2% (+23.3)#36 | 6.4% (+28.2)#796 |
| 37. | 59447 | 34.4% | 11.2% (+23.2)#37 | 6.4% (+28.1)#801 |
| 38. | 59275 | 34.0% | 11.2% (+22.8)#38 | 6.4% (+27.6)#817 |
| 39. | 59471 | 33.9% | 11.2% (+22.7)#39 | 6.4% (+27.6)#821 |
| 40. | 59061 | 33.7% | 11.2% (+22.5)#40 | 6.4% (+27.4)#827 |
| 41. | 59863 | 33.3% | 11.2% (+22.1)#41 | 6.4% (+27.0)#871 |
| 42. | 59033 | 33.3% | 11.2% (+22.1)#42 | 6.4% (+27.0)#880 |
| 43. | 59466 | 33.3% | 11.2% (+22.1)#43 | 6.4% (+27.0)#884 |
| 44. | 59755 | 32.4% | 11.2% (+21.2)#44 | 6.4% (+26.0)#930 |
| 45. | 59219 | 32.0% | 11.2% (+20.8)#45 | 6.4% (+25.6)#954 |
| 46. | 59916 | 30.8% | 11.2% (+19.6)#46 | 6.4% (+24.4)#1,028 |
| 47. | 59420 | 30.2% | 11.2% (+19.0)#47 | 6.4% (+23.9)#1,065 |
| 48. | 59432 | 30.0% | 11.2% (+18.8)#48 | 6.4% (+23.6)#1,093 |
| 49. | 59008 | 29.9% | 11.2% (+18.7)#49 | 6.4% (+23.6)#1,098 |
| 50. | 59444 | 29.5% | 11.2% (+18.3)#50 | 6.4% (+23.2)#1,121 |
| 51. | 59762 | 29.2% | 11.2% (+18.0)#51 | 6.4% (+22.8)#1,151 |
| 52. | 59871 | 29.1% | 11.2% (+17.9)#52 | 6.4% (+22.7)#1,157 |
| 53. | 59462 | 28.6% | 11.2% (+17.4)#53 | 6.4% (+22.2)#1,199 |
| 54. | 59086 | 28.4% | 11.2% (+17.2)#54 | 6.4% (+22.1)#1,208 |
| 55. | 59313 | 28.3% | 11.2% (+17.1)#55 | 6.4% (+21.9)#1,218 |
| 56. | 59648 | 27.4% | 11.2% (+16.2)#56 | 6.4% (+21.0)#1,310 |
| 57. | 59729 | 27.4% | 11.2% (+16.2)#57 | 6.4% (+21.0)#1,312 |
| 58. | 59812 | 27.3% | 11.2% (+16.1)#58 | 6.4% (+20.9)#1,318 |
| 59. | 59451 | 27.0% | 11.2% (+15.8)#59 | 6.4% (+20.7)#1,343 |
| 60. | 59450 | 26.9% | 11.2% (+15.7)#60 | 6.4% (+20.5)#1,354 |
| 61. | 59324 | 26.7% | 11.2% (+15.5)#61 | 6.4% (+20.3)#1,376 |
| 62. | 59483 | 26.7% | 11.2% (+15.5)#62 | 6.4% (+20.3)#1,379 |
| 63. | 59411 | 25.6% | 11.2% (+14.4)#63 | 6.4% (+19.2)#1,503 |
| 64. | 59087 | 25.4% | 11.2% (+14.2)#64 | 6.4% (+19.0)#1,539 |
| 65. | 59088 | 24.7% | 11.2% (+13.5)#65 | 6.4% (+18.3)#1,642 |
| 66. | 59716 | 23.9% | 11.2% (+12.7)#66 | 6.4% (+17.5)#1,737 |
| 67. | 59089 | 23.8% | 11.2% (+12.6)#67 | 6.4% (+17.5)#1,748 |
| 68. | 59066 | 23.7% | 11.2% (+12.5)#68 | 6.4% (+17.3)#1,765 |
| 69. | 59913 | 23.7% | 11.2% (+12.5)#69 | 6.4% (+17.3)#1,769 |
| 70. | 59486 | 22.6% | 11.2% (+11.4)#70 | 6.4% (+16.3)#1,955 |
| 71. | 59520 | 22.3% | 11.2% (+11.1)#71 | 6.4% (+16.0)#2,005 |
| 72. | 59843 | 22.3% | 11.2% (+11.1)#72 | 6.4% (+16.0)#2,006 |
| 73. | 59036 | 22.2% | 11.2% (+11.0)#73 | 6.4% (+15.8)#2,060 |
| 74. | 59874 | 22.1% | 11.2% (+10.9)#74 | 6.4% (+15.8)#2,067 |
| 75. | 59212 | 22.0% | 11.2% (+10.8)#75 | 6.4% (+15.7)#2,084 |
| 76. | 59918 | 21.8% | 11.2% (+10.6)#76 | 6.4% (+15.4)#2,141 |
| 77. | 59436 | 21.6% | 11.2% (+10.4)#77 | 6.4% (+15.2)#2,175 |
| 78. | 59873 | 21.5% | 11.2% (+10.3)#78 | 6.4% (+15.1)#2,208 |
| 79. | 59241 | 21.4% | 11.2% (+10.2)#79 | 6.4% (+15.1)#2,214 |
| 80. | 59825 | 21.3% | 11.2% (+10.1)#80 | 6.4% (+14.9)#2,250 |
| 81. | 59226 | 21.2% | 11.2% (+10.0)#81 | 6.4% (+14.9)#2,264 |
| 82. | 59761 | 20.8% | 11.2% (+9.64)#82 | 6.4% (+14.5)#2,335 |
| 83. | 59261 | 20.7% | 11.2% (+9.49)#83 | 6.4% (+14.3)#2,368 |
| 84. | 59243 | 20.4% | 11.2% (+9.23)#84 | 6.4% (+14.1)#2,420 |
| 85. | 59468 | 20.4% | 11.2% (+9.22)#85 | 6.4% (+14.1)#2,423 |
| 86. | 59930 | 19.8% | 11.2% (+8.65)#86 | 6.4% (+13.5)#2,586 |
| 87. | 59024 | 19.6% | 11.2% (+8.37)#87 | 6.4% (+13.2)#2,650 |
| 88. | 59422 | 19.4% | 11.2% (+8.20)#88 | 6.4% (+13.0)#2,685 |
| 89. | 59337 | 19.1% | 11.2% (+7.95)#89 | 6.4% (+12.8)#2,748 |
| 90. | 59521 | 19.0% | 11.2% (+7.79)#90 | 6.4% (+12.6)#2,788 |
| 91. | 59344 | 18.9% | 11.2% (+7.72)#91 | 6.4% (+12.6)#2,801 |
| 92. | 59069 | 18.8% | 11.2% (+7.64)#92 | 6.4% (+12.5)#2,827 |
| 93. | 59474 | 18.8% | 11.2% (+7.61)#93 | 6.4% (+12.5)#2,833 |
| 94. | 59072 | 18.8% | 11.2% (+7.60)#94 | 6.4% (+12.4)#2,837 |
| 95. | 59831 | 18.6% | 11.2% (+7.41)#95 | 6.4% (+12.3)#2,897 |
| 96. | 59070 | 18.6% | 11.2% (+7.40)#96 | 6.4% (+12.2)#2,903 |
| 97. | 59446 | 18.4% | 11.2% (+7.18)#97 | 6.4% (+12.0)#2,964 |
| 98. | 59739 | 18.4% | 11.2% (+7.17)#98 | 6.4% (+12.0)#2,972 |
| 99. | 59743 | 18.3% | 11.2% (+7.14)#99 | 6.4% (+12.0)#2,979 |
| 100. | 59714 | 18.2% | 11.2% (+7.04)#100 | 6.4% (+11.9)#3,005 |
Common Questions
What are the Top 10 Zip Codes with the Highest Percentage of Population with a Degree in Bio, Nature & Agricultural in Montana?
Top 10 Zip Codes with the Highest Percentage of Population with a Degree in Bio, Nature & Agricultural in Montana are:
What zip code has the Highest Percentage of Population with a Degree in Bio, Nature & Agricultural in Montana?
59456 has the Highest Percentage of Population with a Degree in Bio, Nature & Agricultural in Montana with 100.0%.
What is the Percentage of Population with a Degree in Bio, Nature & Agricultural in the State of Montana?
Percentage of Population with a Degree in Bio, Nature & Agricultural in Montana is 11.2%.
What is the Percentage of Population with a Degree in Bio, Nature & Agricultural in the United States?
Percentage of Population with a Degree in Bio, Nature & Agricultural in the United States is 6.4%.