Zip Codes with the Highest Percentage of Population Employed in Farming, Fishing & Forestry in Montana
RELATED REPORTS & OPTIONS
Farming, Fishing & Forestry
Montana
Compare Zip Codes
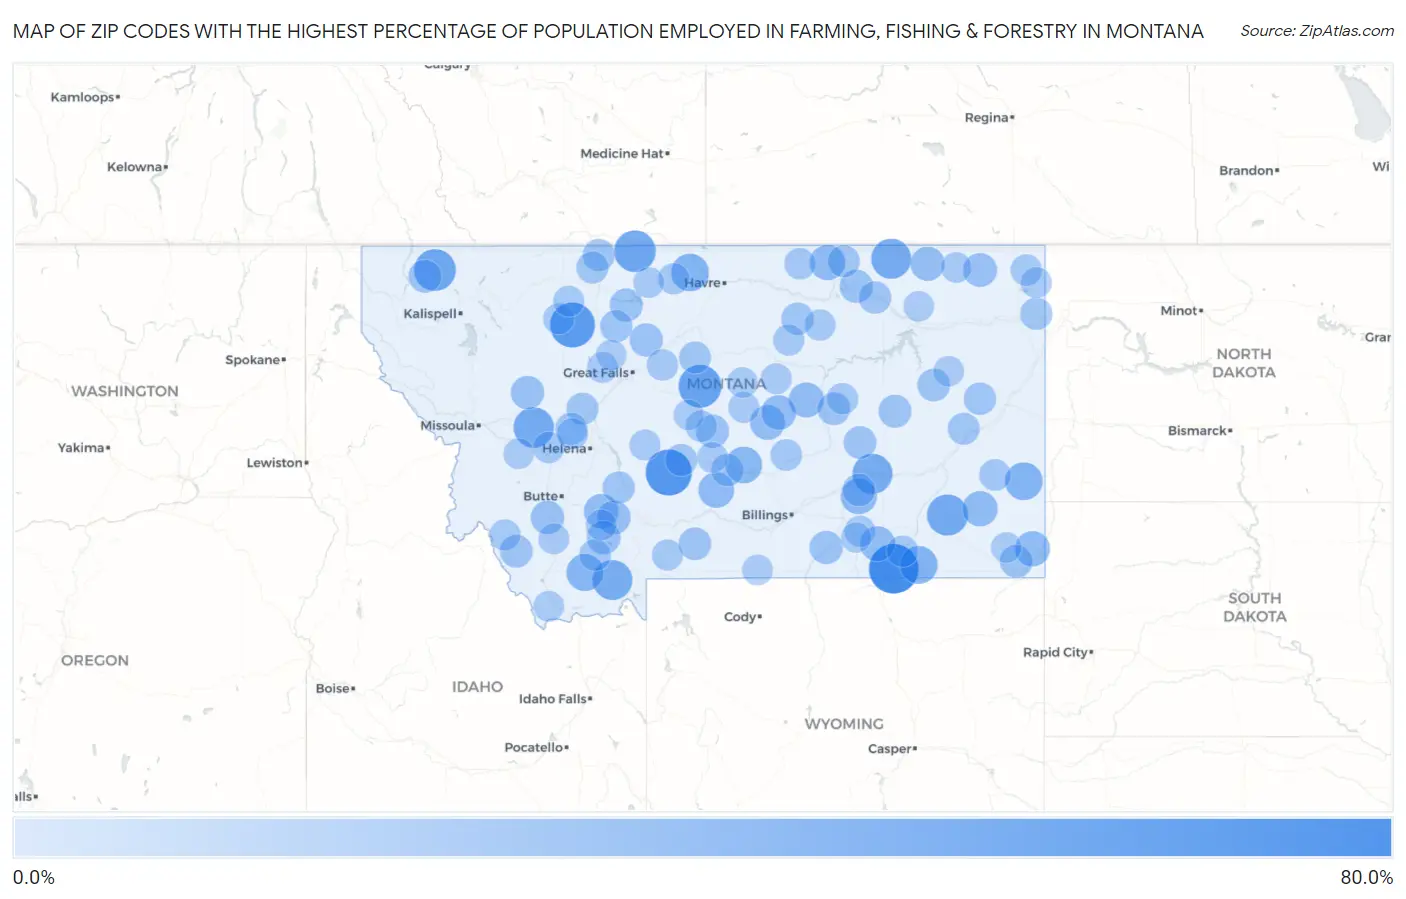
Map of Zip Codes with the Highest Percentage of Population Employed in Farming, Fishing & Forestry in Montana
0.0%
80.0%
Zip Codes with the Highest Percentage of Population Employed in Farming, Fishing & Forestry in Montana
| Zip Code | % Employed | vs State | vs National | |
| 1. | 59025 | 63.0% | 1.7%(+61.3)#1 | 0.61%(+62.4)#33 |
| 2. | 59642 | 52.9% | 1.7%(+51.3)#2 | 0.61%(+52.3)#45 |
| 3. | 59467 | 49.3% | 1.7%(+47.6)#3 | 0.61%(+48.7)#58 |
| 4. | 59424 | 43.5% | 1.7%(+41.8)#4 | 0.61%(+42.9)#84 |
| 5. | 59933 | 40.0% | 1.7%(+38.3)#5 | 0.61%(+39.4)#101 |
| 6. | 59545 | 39.5% | 1.7%(+37.9)#6 | 0.61%(+38.9)#104 |
| 7. | 59351 | 38.0% | 1.7%(+36.3)#7 | 0.61%(+37.4)#117 |
| 8. | 59843 | 36.2% | 1.7%(+34.5)#8 | 0.61%(+35.6)#129 |
| 9. | 59250 | 35.2% | 1.7%(+33.6)#9 | 0.61%(+34.6)#139 |
| 10. | 59076 | 35.0% | 1.7%(+33.3)#10 | 0.61%(+34.4)#145 |
| 11. | 59720 | 34.6% | 1.7%(+32.9)#11 | 0.61%(+34.0)#150 |
| 12. | 59062 | 28.6% | 1.7%(+26.9)#12 | 0.61%(+28.0)#216 |
| 13. | 59354 | 28.3% | 1.7%(+26.6)#13 | 0.61%(+27.7)#220 |
| 14. | 59525 | 28.1% | 1.7%(+26.4)#14 | 0.61%(+27.5)#225 |
| 15. | 59710 | 26.5% | 1.7%(+24.9)#15 | 0.61%(+25.9)#250 |
| 16. | 59074 | 25.4% | 1.7%(+23.8)#16 | 0.61%(+24.8)#279 |
| 17. | 59010 | 23.6% | 1.7%(+21.9)#17 | 0.61%(+23.0)#310 |
| 18. | 59055 | 22.4% | 1.7%(+20.8)#18 | 0.61%(+21.8)#332 |
| 19. | 59537 | 22.0% | 1.7%(+20.4)#19 | 0.61%(+21.4)#343 |
| 20. | 59345 | 21.4% | 1.7%(+19.8)#20 | 0.61%(+20.8)#361 |
| 21. | 59319 | 21.1% | 1.7%(+19.4)#21 | 0.61%(+20.4)#369 |
| 22. | 59016 | 20.9% | 1.7%(+19.2)#22 | 0.61%(+20.3)#371 |
| 23. | 59087 | 20.6% | 1.7%(+18.9)#23 | 0.61%(+20.0)#380 |
| 24. | 59441 | 20.0% | 1.7%(+18.3)#24 | 0.61%(+19.4)#402 |
| 25. | 59032 | 19.8% | 1.7%(+18.1)#25 | 0.61%(+19.2)#416 |
| 26. | 59721 | 19.6% | 1.7%(+17.9)#26 | 0.61%(+19.0)#422 |
| 27. | 59260 | 18.3% | 1.7%(+16.6)#27 | 0.61%(+17.7)#462 |
| 28. | 59222 | 17.4% | 1.7%(+15.8)#28 | 0.61%(+16.8)#509 |
| 29. | 59760 | 17.3% | 1.7%(+15.6)#29 | 0.61%(+16.7)#517 |
| 30. | 59740 | 17.0% | 1.7%(+15.3)#30 | 0.61%(+16.4)#533 |
| 31. | 59727 | 16.2% | 1.7%(+14.6)#31 | 0.61%(+15.6)#576 |
| 32. | 59854 | 16.1% | 1.7%(+14.5)#32 | 0.61%(+15.5)#580 |
| 33. | 59261 | 15.9% | 1.7%(+14.3)#33 | 0.61%(+15.3)#593 |
| 34. | 59420 | 15.8% | 1.7%(+14.2)#34 | 0.61%(+15.2)#600 |
| 35. | 59075 | 15.8% | 1.7%(+14.1)#35 | 0.61%(+15.2)#602 |
| 36. | 59456 | 15.2% | 1.7%(+13.6)#36 | 0.61%(+14.6)#633 |
| 37. | 59418 | 15.2% | 1.7%(+13.5)#37 | 0.61%(+14.5)#639 |
| 38. | 59322 | 14.8% | 1.7%(+13.2)#38 | 0.61%(+14.2)#658 |
| 39. | 59934 | 14.6% | 1.7%(+13.0)#39 | 0.61%(+14.0)#669 |
| 40. | 59736 | 14.3% | 1.7%(+12.6)#40 | 0.61%(+13.7)#696 |
| 41. | 59214 | 14.3% | 1.7%(+12.6)#41 | 0.61%(+13.7)#698 |
| 42. | 59039 | 14.3% | 1.7%(+12.6)#42 | 0.61%(+13.7)#701 |
| 43. | 59058 | 14.3% | 1.7%(+12.6)#43 | 0.61%(+13.7)#702 |
| 44. | 59311 | 14.1% | 1.7%(+12.5)#44 | 0.61%(+13.5)#707 |
| 45. | 59052 | 14.1% | 1.7%(+12.4)#45 | 0.61%(+13.5)#711 |
| 46. | 59038 | 13.6% | 1.7%(+11.9)#46 | 0.61%(+13.0)#757 |
| 47. | 59241 | 13.4% | 1.7%(+11.8)#47 | 0.61%(+12.8)#779 |
| 48. | 59078 | 13.3% | 1.7%(+11.7)#48 | 0.61%(+12.7)#784 |
| 49. | 59339 | 13.1% | 1.7%(+11.5)#49 | 0.61%(+12.5)#802 |
| 50. | 59524 | 13.1% | 1.7%(+11.4)#50 | 0.61%(+12.5)#805 |
| 51. | 59416 | 12.8% | 1.7%(+11.2)#51 | 0.61%(+12.2)#828 |
| 52. | 59643 | 12.8% | 1.7%(+11.2)#52 | 0.61%(+12.2)#830 |
| 53. | 59482 | 12.7% | 1.7%(+11.1)#53 | 0.61%(+12.1)#840 |
| 54. | 59212 | 12.6% | 1.7%(+11.0)#54 | 0.61%(+12.0)#851 |
| 55. | 59544 | 12.5% | 1.7%(+10.8)#55 | 0.61%(+11.9)#870 |
| 56. | 59454 | 12.5% | 1.7%(+10.8)#56 | 0.61%(+11.9)#872 |
| 57. | 59053 | 12.4% | 1.7%(+10.7)#57 | 0.61%(+11.8)#883 |
| 58. | 59648 | 12.3% | 1.7%(+10.6)#58 | 0.61%(+11.7)#902 |
| 59. | 59633 | 12.1% | 1.7%(+10.5)#59 | 0.61%(+11.5)#915 |
| 60. | 59349 | 11.9% | 1.7%(+10.3)#60 | 0.61%(+11.3)#936 |
| 61. | 59446 | 11.7% | 1.7%(+10.1)#61 | 0.61%(+11.1)#963 |
| 62. | 59755 | 11.5% | 1.7%(+9.81)#62 | 0.61%(+10.9)#996 |
| 63. | 59336 | 11.1% | 1.7%(+9.45)#63 | 0.61%(+10.5)#1,034 |
| 64. | 59731 | 10.7% | 1.7%(+9.05)#64 | 0.61%(+10.1)#1,093 |
| 65. | 59012 | 10.7% | 1.7%(+9.05)#65 | 0.61%(+10.1)#1,094 |
| 66. | 59072 | 10.7% | 1.7%(+9.03)#66 | 0.61%(+10.1)#1,098 |
| 67. | 59542 | 10.6% | 1.7%(+8.93)#67 | 0.61%(+9.98)#1,113 |
| 68. | 59211 | 10.4% | 1.7%(+8.73)#68 | 0.61%(+9.78)#1,144 |
| 69. | 59077 | 10.3% | 1.7%(+8.68)#69 | 0.61%(+9.74)#1,158 |
| 70. | 59452 | 10.2% | 1.7%(+8.54)#70 | 0.61%(+9.60)#1,180 |
| 71. | 59546 | 10.1% | 1.7%(+8.48)#71 | 0.61%(+9.54)#1,191 |
| 72. | 59450 | 10.0% | 1.7%(+8.34)#72 | 0.61%(+9.39)#1,204 |
| 73. | 59540 | 9.9% | 1.7%(+8.26)#73 | 0.61%(+9.32)#1,220 |
| 74. | 59538 | 9.9% | 1.7%(+8.21)#74 | 0.61%(+9.26)#1,229 |
| 75. | 59432 | 9.9% | 1.7%(+8.20)#75 | 0.61%(+9.25)#1,234 |
| 76. | 59640 | 9.8% | 1.7%(+8.09)#76 | 0.61%(+9.15)#1,250 |
| 77. | 59761 | 9.6% | 1.7%(+7.96)#77 | 0.61%(+9.02)#1,268 |
| 78. | 59065 | 9.5% | 1.7%(+7.86)#78 | 0.61%(+8.92)#1,290 |
| 79. | 59022 | 9.5% | 1.7%(+7.79)#79 | 0.61%(+8.85)#1,311 |
| 80. | 59486 | 9.4% | 1.7%(+7.70)#80 | 0.61%(+8.75)#1,326 |
| 81. | 59471 | 9.3% | 1.7%(+7.67)#81 | 0.61%(+8.73)#1,331 |
| 82. | 59735 | 9.2% | 1.7%(+7.49)#82 | 0.61%(+8.55)#1,370 |
| 83. | 59443 | 9.1% | 1.7%(+7.43)#83 | 0.61%(+8.49)#1,380 |
| 84. | 59219 | 9.1% | 1.7%(+7.43)#84 | 0.61%(+8.49)#1,381 |
| 85. | 59457 | 9.1% | 1.7%(+7.42)#85 | 0.61%(+8.48)#1,389 |
| 86. | 59645 | 9.0% | 1.7%(+7.34)#86 | 0.61%(+8.39)#1,405 |
| 87. | 59732 | 8.8% | 1.7%(+7.16)#87 | 0.61%(+8.22)#1,448 |
| 88. | 59522 | 8.5% | 1.7%(+6.83)#88 | 0.61%(+7.89)#1,529 |
| 89. | 59036 | 8.4% | 1.7%(+6.76)#89 | 0.61%(+7.81)#1,541 |
| 90. | 59837 | 8.3% | 1.7%(+6.67)#90 | 0.61%(+7.73)#1,559 |
| 91. | 59724 | 8.3% | 1.7%(+6.67)#91 | 0.61%(+7.73)#1,567 |
| 92. | 59263 | 8.2% | 1.7%(+6.59)#92 | 0.61%(+7.64)#1,590 |
| 93. | 59008 | 8.2% | 1.7%(+6.55)#93 | 0.61%(+7.61)#1,601 |
| 94. | 59215 | 8.1% | 1.7%(+6.44)#94 | 0.61%(+7.50)#1,635 |
| 95. | 59332 | 8.0% | 1.7%(+6.30)#95 | 0.61%(+7.36)#1,678 |
| 96. | 59451 | 7.9% | 1.7%(+6.23)#96 | 0.61%(+7.29)#1,694 |
| 97. | 59479 | 7.8% | 1.7%(+6.12)#97 | 0.61%(+7.18)#1,726 |
| 98. | 59031 | 7.8% | 1.7%(+6.10)#98 | 0.61%(+7.15)#1,739 |
| 99. | 59468 | 7.7% | 1.7%(+6.06)#99 | 0.61%(+7.11)#1,749 |
| 100. | 59248 | 7.7% | 1.7%(+6.03)#100 | 0.61%(+7.09)#1,751 |
Common Questions
What are the Top 10 Zip Codes with the Highest Percentage of Population Employed in Farming, Fishing & Forestry in Montana?
Top 10 Zip Codes with the Highest Percentage of Population Employed in Farming, Fishing & Forestry in Montana are:
What zip code has the Highest Percentage of Population Employed in Farming, Fishing & Forestry in Montana?
59025 has the Highest Percentage of Population Employed in Farming, Fishing & Forestry in Montana with 63.0%.
What is the Percentage of Population Employed in Farming, Fishing & Forestry in the State of Montana?
Percentage of Population Employed in Farming, Fishing & Forestry in Montana is 1.7%.
What is the Percentage of Population Employed in Farming, Fishing & Forestry in the United States?
Percentage of Population Employed in Farming, Fishing & Forestry in the United States is 0.61%.