Zip Codes with the Highest Percentage of Households Heated by Fuel Oil / Kerosene in Montana
RELATED REPORTS & OPTIONS
Fuel Oil Heating
Montana
Compare Zip Codes
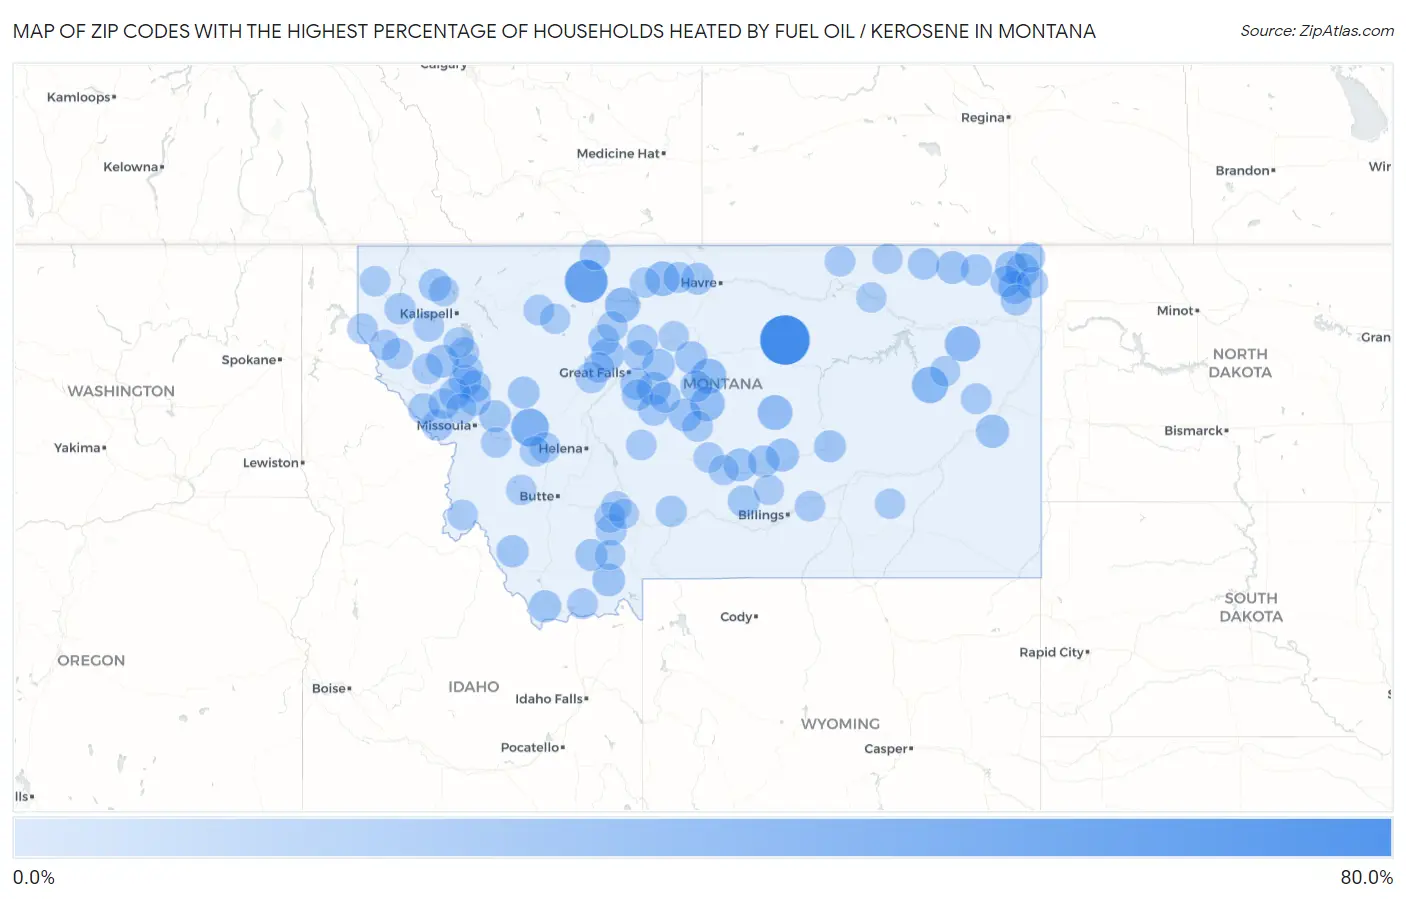
Map of Zip Codes with the Highest Percentage of Households Heated by Fuel Oil / Kerosene in Montana
0.0%
80.0%
Zip Codes with the Highest Percentage of Households Heated by Fuel Oil / Kerosene in Montana
| Zip Code | Fuel Oil Heating | vs State | vs National | |
| 1. | 59546 | 70.1% | 0.70%(+69.4)#1 | 4.2%(+65.9)#520 |
| 2. | 59435 | 45.8% | 0.70%(+45.1)#2 | 4.2%(+41.6)#2,118 |
| 3. | 59843 | 27.3% | 0.70%(+26.6)#3 | 4.2%(+23.1)#3,572 |
| 4. | 59214 | 22.2% | 0.70%(+21.5)#4 | 4.2%(+18.0)#4,051 |
| 5. | 59274 | 19.3% | 0.70%(+18.6)#5 | 4.2%(+15.1)#4,370 |
| 6. | 59430 | 18.4% | 0.70%(+17.7)#6 | 4.2%(+14.2)#4,474 |
| 7. | 59456 | 18.1% | 0.70%(+17.4)#7 | 4.2%(+13.9)#4,508 |
| 8. | 59032 | 17.1% | 0.70%(+16.4)#8 | 4.2%(+12.9)#4,663 |
| 9. | 59530 | 16.3% | 0.70%(+15.6)#9 | 4.2%(+12.1)#4,790 |
| 10. | 59462 | 15.6% | 0.70%(+14.9)#10 | 4.2%(+11.4)#4,910 |
| 11. | 59211 | 12.8% | 0.70%(+12.1)#11 | 4.2%(+8.60)#5,401 |
| 12. | 59412 | 11.6% | 0.70%(+10.9)#12 | 4.2%(+7.40)#5,676 |
| 13. | 59326 | 11.4% | 0.70%(+10.7)#13 | 4.2%(+7.20)#5,727 |
| 14. | 59072 | 11.1% | 0.70%(+10.4)#14 | 4.2%(+6.90)#5,789 |
| 15. | 59468 | 11.0% | 0.70%(+10.3)#15 | 4.2%(+6.80)#5,831 |
| 16. | 59479 | 10.7% | 0.70%(+10.00)#16 | 4.2%(+6.50)#5,899 |
| 17. | 59074 | 10.6% | 0.70%(+9.90)#17 | 4.2%(+6.40)#5,935 |
| 18. | 59720 | 9.9% | 0.70%(+9.20)#18 | 4.2%(+5.70)#6,105 |
| 19. | 59263 | 9.8% | 0.70%(+9.10)#19 | 4.2%(+5.60)#6,129 |
| 20. | 59247 | 9.6% | 0.70%(+8.90)#20 | 4.2%(+5.40)#6,194 |
| 21. | 59845 | 9.2% | 0.70%(+8.50)#21 | 4.2%(+5.00)#6,305 |
| 22. | 59824 | 9.0% | 0.70%(+8.30)#22 | 4.2%(+4.80)#6,359 |
| 23. | 59254 | 8.8% | 0.70%(+8.10)#23 | 4.2%(+4.60)#6,425 |
| 24. | 59446 | 8.8% | 0.70%(+8.10)#24 | 4.2%(+4.60)#6,435 |
| 25. | 59450 | 8.5% | 0.70%(+7.80)#25 | 4.2%(+4.30)#6,532 |
| 26. | 59927 | 8.2% | 0.70%(+7.50)#26 | 4.2%(+4.00)#6,653 |
| 27. | 59724 | 7.7% | 0.70%(+7.00)#27 | 4.2%(+3.50)#6,857 |
| 28. | 59736 | 7.6% | 0.70%(+6.90)#28 | 4.2%(+3.40)#6,902 |
| 29. | 59424 | 7.4% | 0.70%(+6.70)#29 | 4.2%(+3.20)#6,981 |
| 30. | 59755 | 7.1% | 0.70%(+6.40)#30 | 4.2%(+2.90)#7,103 |
| 31. | 59532 | 6.8% | 0.70%(+6.10)#31 | 4.2%(+2.60)#7,223 |
| 32. | 59865 | 6.7% | 0.70%(+6.00)#32 | 4.2%(+2.50)#7,249 |
| 33. | 59823 | 6.7% | 0.70%(+6.00)#33 | 4.2%(+2.50)#7,256 |
| 34. | 59054 | 6.7% | 0.70%(+6.00)#34 | 4.2%(+2.50)#7,274 |
| 35. | 59046 | 6.6% | 0.70%(+5.90)#35 | 4.2%(+2.40)#7,320 |
| 36. | 59854 | 6.6% | 0.70%(+5.90)#36 | 4.2%(+2.40)#7,322 |
| 37. | 59067 | 6.5% | 0.70%(+5.80)#37 | 4.2%(+2.30)#7,361 |
| 38. | 59472 | 6.4% | 0.70%(+5.70)#38 | 4.2%(+2.20)#7,414 |
| 39. | 59821 | 6.2% | 0.70%(+5.50)#39 | 4.2%(+2.00)#7,493 |
| 40. | 59260 | 5.8% | 0.70%(+5.10)#40 | 4.2%(+1.60)#7,705 |
| 41. | 59463 | 5.4% | 0.70%(+4.70)#41 | 4.2%(+1.20)#7,939 |
| 42. | 59480 | 5.3% | 0.70%(+4.60)#42 | 4.2%(+1.10)#7,990 |
| 43. | 59831 | 5.2% | 0.70%(+4.50)#43 | 4.2%(+1.00)#8,042 |
| 44. | 59258 | 5.1% | 0.70%(+4.40)#44 | 4.2%(+0.900)#8,110 |
| 45. | 59222 | 5.0% | 0.70%(+4.30)#45 | 4.2%(+0.800)#8,152 |
| 46. | 59923 | 4.9% | 0.70%(+4.20)#46 | 4.2%(+0.700)#8,168 |
| 47. | 59433 | 4.8% | 0.70%(+4.10)#47 | 4.2%(+0.600)#8,281 |
| 48. | 59477 | 4.8% | 0.70%(+4.10)#48 | 4.2%(+0.600)#8,285 |
| 49. | 59219 | 4.8% | 0.70%(+4.10)#49 | 4.2%(+0.600)#8,287 |
| 50. | 59820 | 4.7% | 0.70%(+4.00)#50 | 4.2%(+0.500)#8,325 |
| 51. | 59018 | 4.2% | 0.70%(+3.50)#51 | 4.2%(=0.000)#8,690 |
| 52. | 59226 | 4.1% | 0.70%(+3.40)#52 | 4.2%(-0.100)#8,770 |
| 53. | 59872 | 4.0% | 0.70%(+3.30)#53 | 4.2%(-0.200)#8,827 |
| 54. | 59745 | 4.0% | 0.70%(+3.30)#54 | 4.2%(-0.200)#8,854 |
| 55. | 59420 | 3.8% | 0.70%(+3.10)#55 | 4.2%(-0.400)#9,015 |
| 56. | 59528 | 3.7% | 0.70%(+3.00)#56 | 4.2%(-0.500)#9,101 |
| 57. | 59469 | 3.6% | 0.70%(+2.90)#57 | 4.2%(-0.600)#9,179 |
| 58. | 59846 | 3.5% | 0.70%(+2.80)#58 | 4.2%(-0.700)#9,264 |
| 59. | 59452 | 3.5% | 0.70%(+2.80)#59 | 4.2%(-0.700)#9,279 |
| 60. | 59760 | 3.5% | 0.70%(+2.80)#60 | 4.2%(-0.700)#9,284 |
| 61. | 59864 | 3.3% | 0.70%(+2.60)#61 | 4.2%(-0.900)#9,411 |
| 62. | 59873 | 3.2% | 0.70%(+2.50)#62 | 4.2%(-1.00)#9,526 |
| 63. | 59443 | 3.2% | 0.70%(+2.50)#63 | 4.2%(-1.00)#9,556 |
| 64. | 59339 | 3.1% | 0.70%(+2.40)#64 | 4.2%(-1.10)#9,661 |
| 65. | 59925 | 3.0% | 0.70%(+2.30)#65 | 4.2%(-1.20)#9,721 |
| 66. | 59859 | 2.9% | 0.70%(+2.20)#66 | 4.2%(-1.30)#9,802 |
| 67. | 59739 | 2.8% | 0.70%(+2.10)#67 | 4.2%(-1.40)#9,967 |
| 68. | 59731 | 2.8% | 0.70%(+2.10)#68 | 4.2%(-1.40)#9,970 |
| 69. | 59844 | 2.7% | 0.70%(+2.00)#69 | 4.2%(-1.50)#10,067 |
| 70. | 59860 | 2.6% | 0.70%(+1.90)#70 | 4.2%(-1.60)#10,115 |
| 71. | 59645 | 2.5% | 0.70%(+1.80)#71 | 4.2%(-1.70)#10,275 |
| 72. | 59448 | 2.5% | 0.70%(+1.80)#72 | 4.2%(-1.70)#10,293 |
| 73. | 59874 | 2.4% | 0.70%(+1.70)#73 | 4.2%(-1.80)#10,391 |
| 74. | 59544 | 2.4% | 0.70%(+1.70)#74 | 4.2%(-1.80)#10,426 |
| 75. | 59829 | 2.3% | 0.70%(+1.60)#75 | 4.2%(-1.90)#10,524 |
| 76. | 59036 | 2.2% | 0.70%(+1.50)#76 | 4.2%(-2.00)#10,680 |
| 77. | 59006 | 2.2% | 0.70%(+1.50)#77 | 4.2%(-2.00)#10,691 |
| 78. | 59825 | 2.1% | 0.70%(+1.40)#78 | 4.2%(-2.10)#10,809 |
| 79. | 59935 | 2.0% | 0.70%(+1.30)#79 | 4.2%(-2.20)#10,941 |
| 80. | 59834 | 2.0% | 0.70%(+1.30)#80 | 4.2%(-2.20)#10,965 |
| 81. | 59914 | 2.0% | 0.70%(+1.30)#81 | 4.2%(-2.20)#11,001 |
| 82. | 59752 | 1.9% | 0.70%(+1.20)#82 | 4.2%(-2.30)#11,090 |
| 83. | 59416 | 1.9% | 0.70%(+1.20)#83 | 4.2%(-2.30)#11,182 |
| 84. | 59250 | 1.9% | 0.70%(+1.20)#84 | 4.2%(-2.30)#11,185 |
| 85. | 59733 | 1.9% | 0.70%(+1.20)#85 | 4.2%(-2.30)#11,196 |
| 86. | 59729 | 1.8% | 0.70%(+1.10)#86 | 4.2%(-2.40)#11,291 |
| 87. | 59482 | 1.8% | 0.70%(+1.10)#87 | 4.2%(-2.40)#11,322 |
| 88. | 59215 | 1.8% | 0.70%(+1.10)#88 | 4.2%(-2.40)#11,323 |
| 89. | 59442 | 1.6% | 0.70%(+0.900)#89 | 4.2%(-2.60)#11,618 |
| 90. | 59275 | 1.6% | 0.70%(+0.900)#90 | 4.2%(-2.60)#11,664 |
| 91. | 59440 | 1.6% | 0.70%(+0.900)#91 | 4.2%(-2.60)#11,674 |
| 92. | 59432 | 1.6% | 0.70%(+0.900)#92 | 4.2%(-2.60)#11,680 |
| 93. | 59323 | 1.5% | 0.70%(+0.800)#93 | 4.2%(-2.70)#11,794 |
| 94. | 59241 | 1.5% | 0.70%(+0.800)#94 | 4.2%(-2.70)#11,834 |
| 95. | 59078 | 1.5% | 0.70%(+0.800)#95 | 4.2%(-2.70)#11,843 |
| 96. | 59937 | 1.4% | 0.70%(+0.700)#96 | 4.2%(-2.80)#11,901 |
| 97. | 59711 | 1.4% | 0.70%(+0.700)#97 | 4.2%(-2.80)#11,922 |
| 98. | 59741 | 1.4% | 0.70%(+0.700)#98 | 4.2%(-2.80)#11,945 |
| 99. | 59522 | 1.4% | 0.70%(+0.700)#99 | 4.2%(-2.80)#11,998 |
| 100. | 59015 | 1.4% | 0.70%(+0.700)#100 | 4.2%(-2.80)#12,038 |
Common Questions
What are the Top 10 Zip Codes with the Highest Percentage of Households Heated by Fuel Oil / Kerosene in Montana?
Top 10 Zip Codes with the Highest Percentage of Households Heated by Fuel Oil / Kerosene in Montana are:
What zip code has the Highest Percentage of Households Heated by Fuel Oil / Kerosene in Montana?
59546 has the Highest Percentage of Households Heated by Fuel Oil / Kerosene in Montana with 70.1%.
What is the Percentage of Households Heated by Fuel Oil / Kerosene in the State of Montana?
Percentage of Households Heated by Fuel Oil / Kerosene in Montana is 0.70%.
What is the Percentage of Households Heated by Fuel Oil / Kerosene in the United States?
Percentage of Households Heated by Fuel Oil / Kerosene in the United States is 4.2%.