Point Baker, FL Map & Demographics
Point Baker Map
Point Baker Overview
$24,310
PER CAPITA INCOME
$70,882
AVG FAMILY INCOME
$51,130
AVG HOUSEHOLD INCOME
34.3%
WAGE / INCOME GAP [ % ]
65.7¢/ $1
WAGE / INCOME GAP [ $ ]
$6,962
FAMILY INCOME DEFICIT
0.35
INEQUALITY / GINI INDEX
3,591
TOTAL POPULATION
1,779
MALE POPULATION
1,812
FEMALE POPULATION
98.18
MALES / 100 FEMALES
101.85
FEMALES / 100 MALES
32.6
MEDIAN AGE
3.2
AVG FAMILY SIZE
2.8
AVG HOUSEHOLD SIZE
1,854
LABOR FORCE [ PEOPLE ]
65.1%
PERCENT IN LABOR FORCE
12.1%
UNEMPLOYMENT RATE
Income in Point Baker
Income Overview in Point Baker
Per Capita Income in Point Baker is $24,310, while median incomes of families and households are $70,882 and $51,130 respectively.
| Characteristic | Number | Measure |
| Per Capita Income | 3,591 | $24,310 |
| Median Family Income | 920 | $70,882 |
| Mean Family Income | 920 | $69,677 |
| Median Household Income | 1,263 | $51,130 |
| Mean Household Income | 1,263 | $63,371 |
| Income Deficit | 920 | $6,962 |
| Wage / Income Gap (%) | 3,591 | 34.34% |
| Wage / Income Gap ($) | 3,591 | 65.66¢ per $1 |
| Gini / Inequality Index | 3,591 | 0.35 |
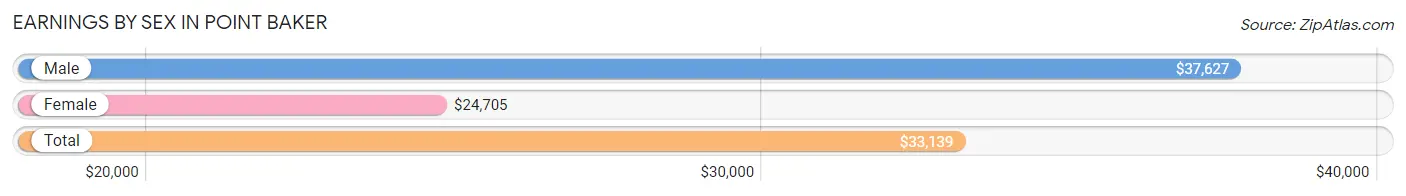
Earnings by Sex in Point Baker
Average Earnings in Point Baker are $33,139, $37,627 for men and $24,705 for women, a difference of 34.3%.
| Sex | Number | Average Earnings |
| Male | 977 (55.2%) | $37,627 |
| Female | 793 (44.8%) | $24,705 |
| Total | 1,770 (100.0%) | $33,139 |
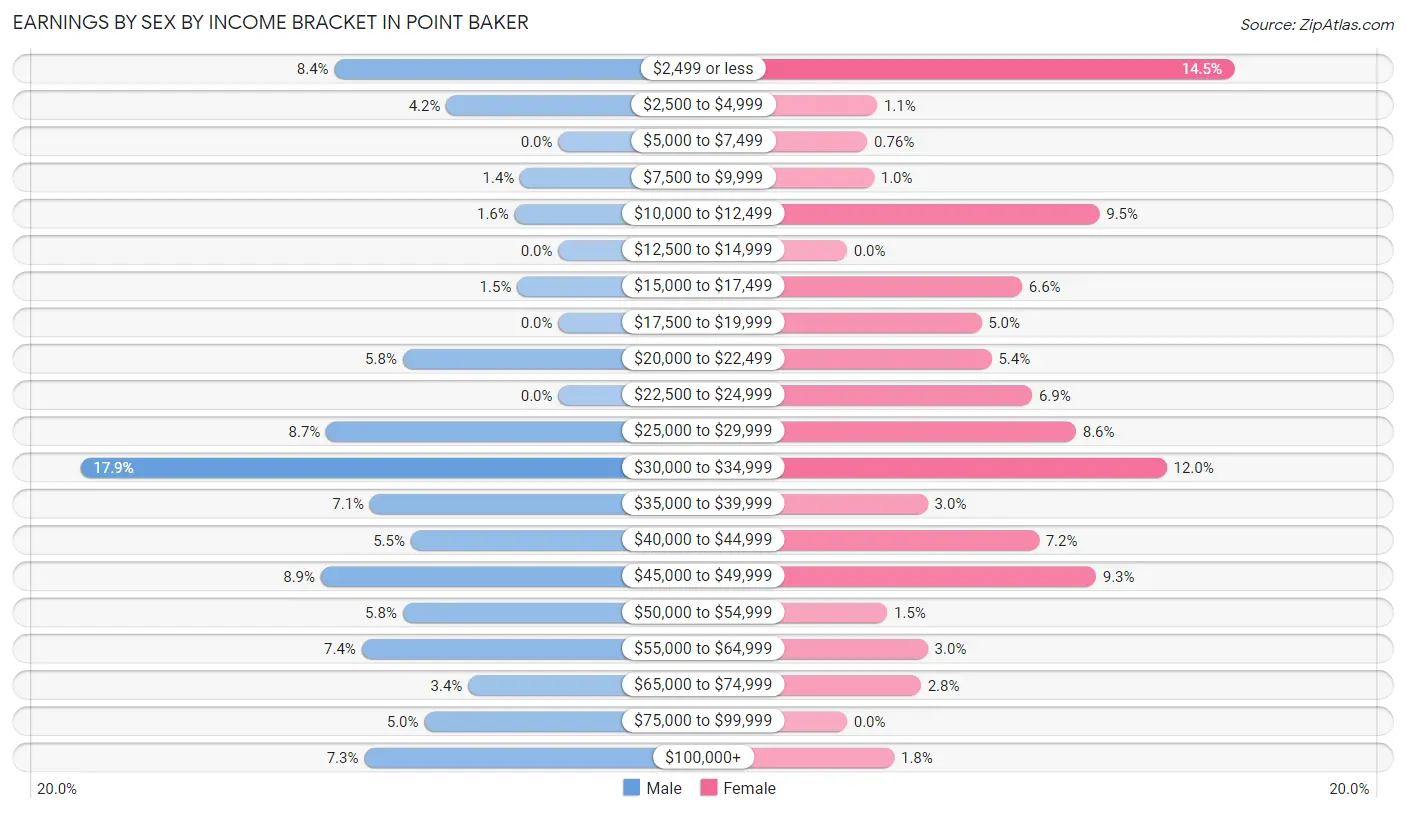
Earnings by Sex by Income Bracket in Point Baker
The most common earnings brackets in Point Baker are $30,000 to $34,999 for men (175 | 17.9%) and $2,499 or less for women (115 | 14.5%).
| Income | Male | Female |
| $2,499 or less | 82 (8.4%) | 115 (14.5%) |
| $2,500 to $4,999 | 41 (4.2%) | 9 (1.1%) |
| $5,000 to $7,499 | 0 (0.0%) | 6 (0.8%) |
| $7,500 to $9,999 | 14 (1.4%) | 8 (1.0%) |
| $10,000 to $12,499 | 16 (1.6%) | 75 (9.5%) |
| $12,500 to $14,999 | 0 (0.0%) | 0 (0.0%) |
| $15,000 to $17,499 | 15 (1.5%) | 52 (6.6%) |
| $17,500 to $19,999 | 0 (0.0%) | 40 (5.0%) |
| $20,000 to $22,499 | 57 (5.8%) | 43 (5.4%) |
| $22,500 to $24,999 | 0 (0.0%) | 55 (6.9%) |
| $25,000 to $29,999 | 85 (8.7%) | 68 (8.6%) |
| $30,000 to $34,999 | 175 (17.9%) | 95 (12.0%) |
| $35,000 to $39,999 | 69 (7.1%) | 24 (3.0%) |
| $40,000 to $44,999 | 54 (5.5%) | 57 (7.2%) |
| $45,000 to $49,999 | 87 (8.9%) | 74 (9.3%) |
| $50,000 to $54,999 | 57 (5.8%) | 12 (1.5%) |
| $55,000 to $64,999 | 72 (7.4%) | 24 (3.0%) |
| $65,000 to $74,999 | 33 (3.4%) | 22 (2.8%) |
| $75,000 to $99,999 | 49 (5.0%) | 0 (0.0%) |
| $100,000+ | 71 (7.3%) | 14 (1.8%) |
| Total | 977 (100.0%) | 793 (100.0%) |
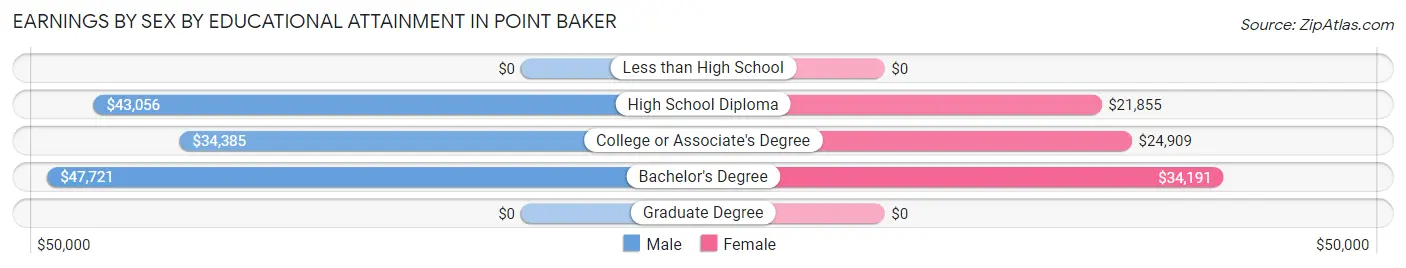
Earnings by Sex by Educational Attainment in Point Baker
Average earnings in Point Baker are $38,804 for men and $28,750 for women, a difference of 25.9%. Men with an educational attainment of bachelor's degree enjoy the highest average annual earnings of $47,721, while those with college or associate's degree education earn the least with $34,385. Women with an educational attainment of bachelor's degree earn the most with the average annual earnings of $34,191, while those with high school diploma education have the smallest earnings of $21,855.
| Educational Attainment | Male Income | Female Income |
| Less than High School | - | - |
| High School Diploma | $43,056 | $21,855 |
| College or Associate's Degree | $34,385 | $24,909 |
| Bachelor's Degree | $47,721 | $34,191 |
| Graduate Degree | - | - |
| Total | $38,804 | $28,750 |
Family Income in Point Baker
Family Income Brackets in Point Baker
According to the Point Baker family income data, there are 235 families falling into the $75,000 to $99,999 income range, which is the most common income bracket and makes up 25.5% of all families.
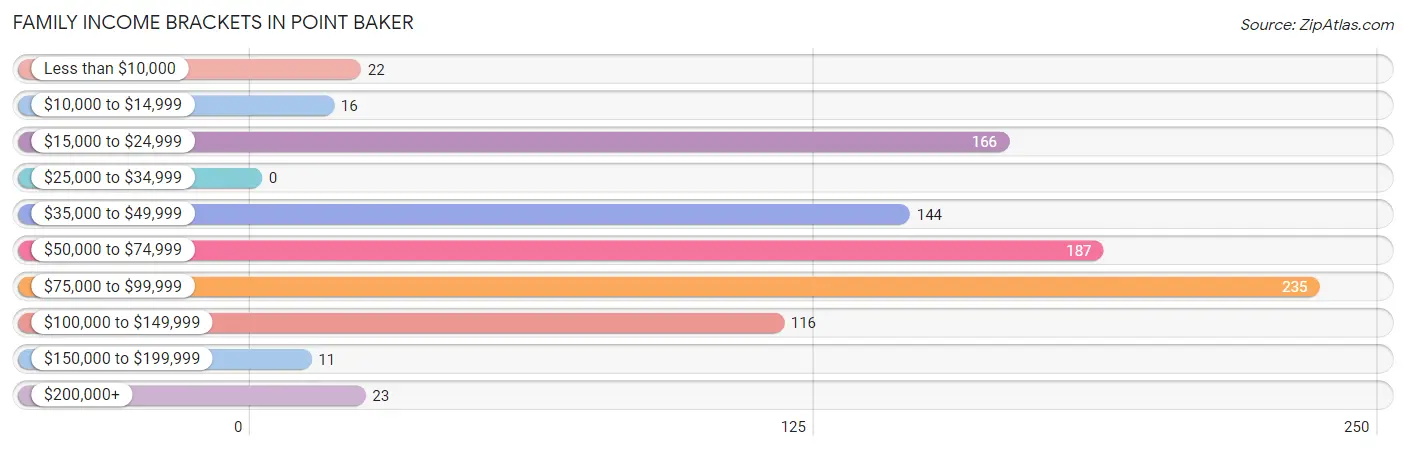
| Income Bracket | # Families | % Families |
| Less than $10,000 | 22 | 2.4% |
| $10,000 to $14,999 | 16 | 1.7% |
| $15,000 to $24,999 | 166 | 18.0% |
| $25,000 to $34,999 | 0 | 0.0% |
| $35,000 to $49,999 | 144 | 15.7% |
| $50,000 to $74,999 | 187 | 20.3% |
| $75,000 to $99,999 | 235 | 25.5% |
| $100,000 to $149,999 | 116 | 12.6% |
| $150,000 to $199,999 | 11 | 1.2% |
| $200,000+ | 23 | 2.5% |
Family Income by Famaliy Size in Point Baker
3-person families (136 | 14.8%) account for the highest median family income in Point Baker with $105,441 per family, while 3-person families (136 | 14.8%) have the highest median income of $35,147 per family member.
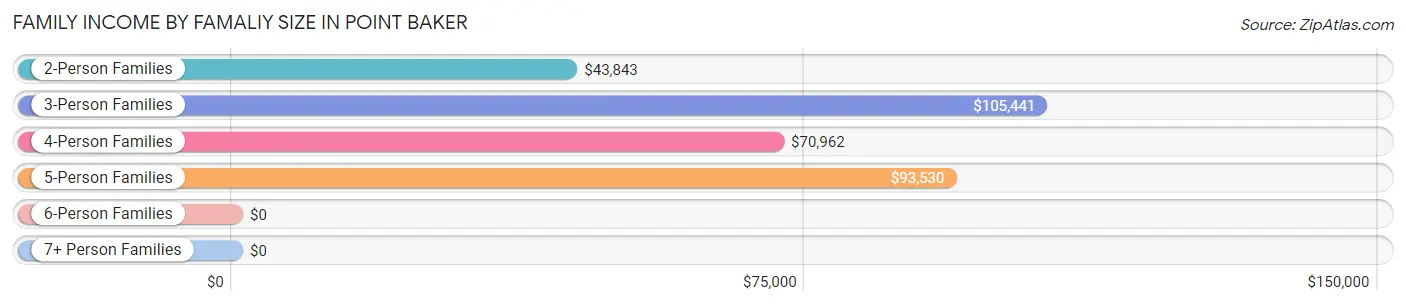
| Income Bracket | # Families | Median Income |
| 2-Person Families | 377 (41.0%) | $43,843 |
| 3-Person Families | 136 (14.8%) | $105,441 |
| 4-Person Families | 304 (33.0%) | $70,962 |
| 5-Person Families | 103 (11.2%) | $93,530 |
| 6-Person Families | 0 (0.0%) | $0 |
| 7+ Person Families | 0 (0.0%) | $0 |
| Total | 920 (100.0%) | $70,882 |
Family Income by Number of Earners in Point Baker
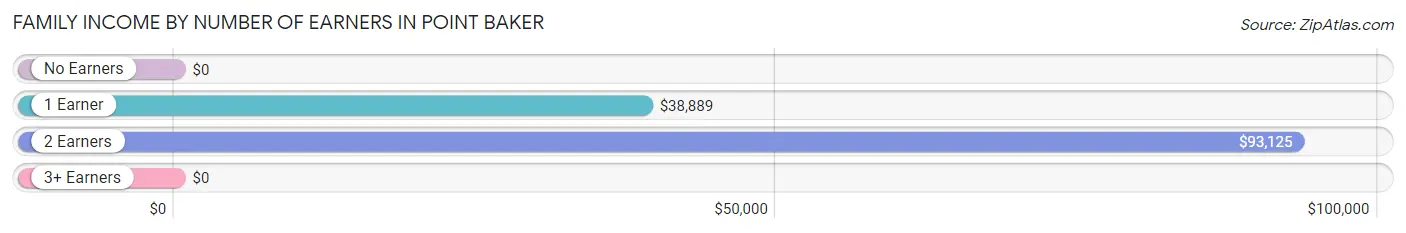
| Number of Earners | # Families | Median Income |
| No Earners | 202 (22.0%) | $0 |
| 1 Earner | 266 (28.9%) | $38,889 |
| 2 Earners | 353 (38.4%) | $93,125 |
| 3+ Earners | 99 (10.8%) | $0 |
| Total | 920 (100.0%) | $70,882 |
Household Income in Point Baker
Household Income Brackets in Point Baker
With 301 households falling in the category, the $35,000 to $49,999 income range is the most frequent in Point Baker, accounting for 23.8% of all households. In contrast, only 21 households (1.7%) fall into the less than $10,000 income bracket, making it the least populous group.
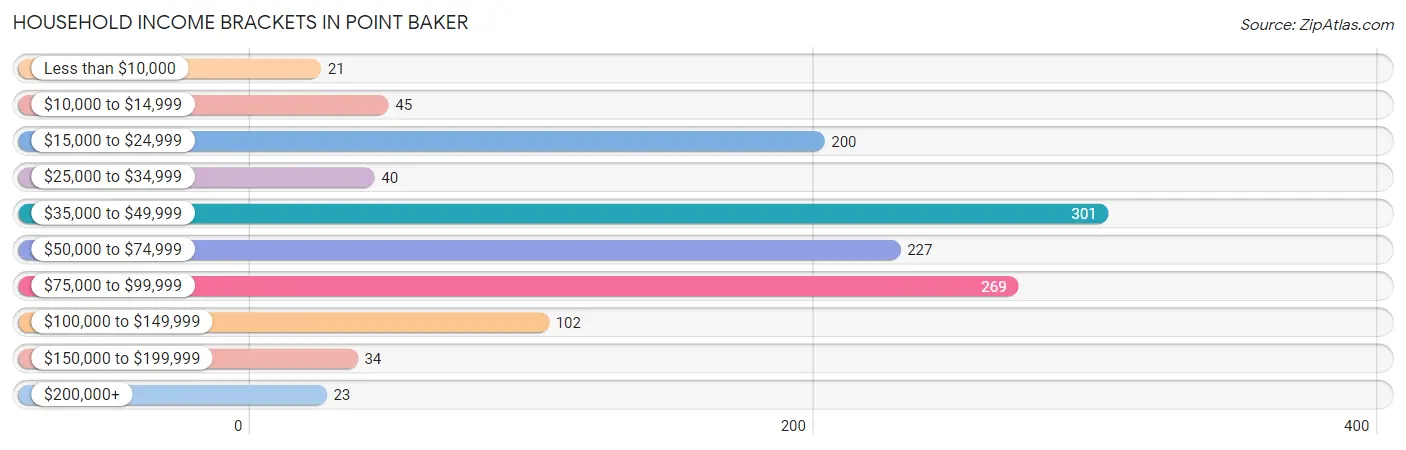
| Income Bracket | # Households | % Households |
| Less than $10,000 | 21 | 1.7% |
| $10,000 to $14,999 | 45 | 3.6% |
| $15,000 to $24,999 | 200 | 15.8% |
| $25,000 to $34,999 | 40 | 3.2% |
| $35,000 to $49,999 | 301 | 23.8% |
| $50,000 to $74,999 | 227 | 18.0% |
| $75,000 to $99,999 | 269 | 21.3% |
| $100,000 to $149,999 | 102 | 8.1% |
| $150,000 to $199,999 | 34 | 2.7% |
| $200,000+ | 23 | 1.8% |
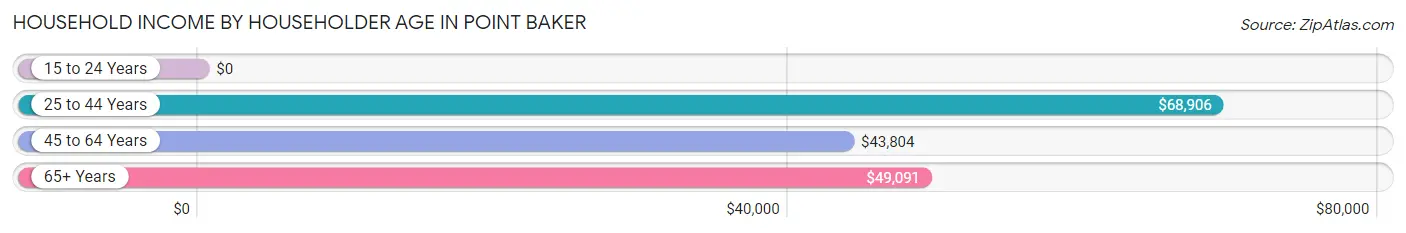
Household Income by Householder Age in Point Baker
The median household income in Point Baker is $51,130, with the highest median household income of $68,906 found in the 25 to 44 years age bracket for the primary householder. A total of 535 households (42.4%) fall into this category.
| Income Bracket | # Households | Median Income |
| 15 to 24 Years | 0 (0.0%) | $0 |
| 25 to 44 Years | 535 (42.4%) | $68,906 |
| 45 to 64 Years | 464 (36.7%) | $43,804 |
| 65+ Years | 264 (20.9%) | $49,091 |
| Total | 1,263 (100.0%) | $51,130 |
Poverty in Point Baker
Income Below Poverty by Sex and Age in Point Baker
With 16.2% poverty level for males and 29.2% for females among the residents of Point Baker, 18 to 24 year old males and 6 to 11 year old females are the most vulnerable to poverty, with 132 males (75.4%) and 89 females (63.6%) in their respective age groups living below the poverty level.
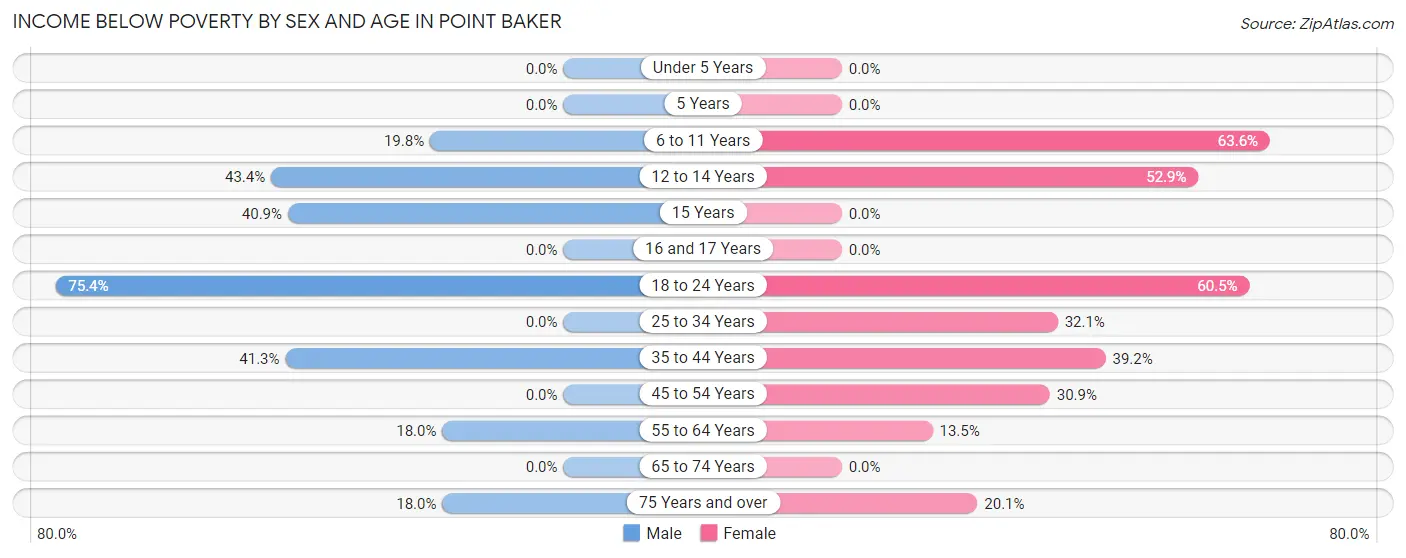
| Age Bracket | Male | Female |
| Under 5 Years | 0 (0.0%) | 0 (0.0%) |
| 5 Years | 0 (0.0%) | 0 (0.0%) |
| 6 to 11 Years | 40 (19.8%) | 89 (63.6%) |
| 12 to 14 Years | 23 (43.4%) | 27 (52.9%) |
| 15 Years | 9 (40.9%) | 0 (0.0%) |
| 16 and 17 Years | 0 (0.0%) | 0 (0.0%) |
| 18 to 24 Years | 132 (75.4%) | 69 (60.5%) |
| 25 to 34 Years | 0 (0.0%) | 126 (32.1%) |
| 35 to 44 Years | 45 (41.3%) | 94 (39.2%) |
| 45 to 54 Years | 0 (0.0%) | 59 (30.9%) |
| 55 to 64 Years | 23 (18.0%) | 36 (13.5%) |
| 65 to 74 Years | 0 (0.0%) | 0 (0.0%) |
| 75 Years and over | 16 (18.0%) | 30 (20.1%) |
| Total | 288 (16.2%) | 530 (29.2%) |
Income Above Poverty by Sex and Age in Point Baker
According to the poverty statistics in Point Baker, males aged under 5 years and females aged under 5 years are the age groups that are most secure financially, with 100.0% of males and 100.0% of females in these age groups living above the poverty line.
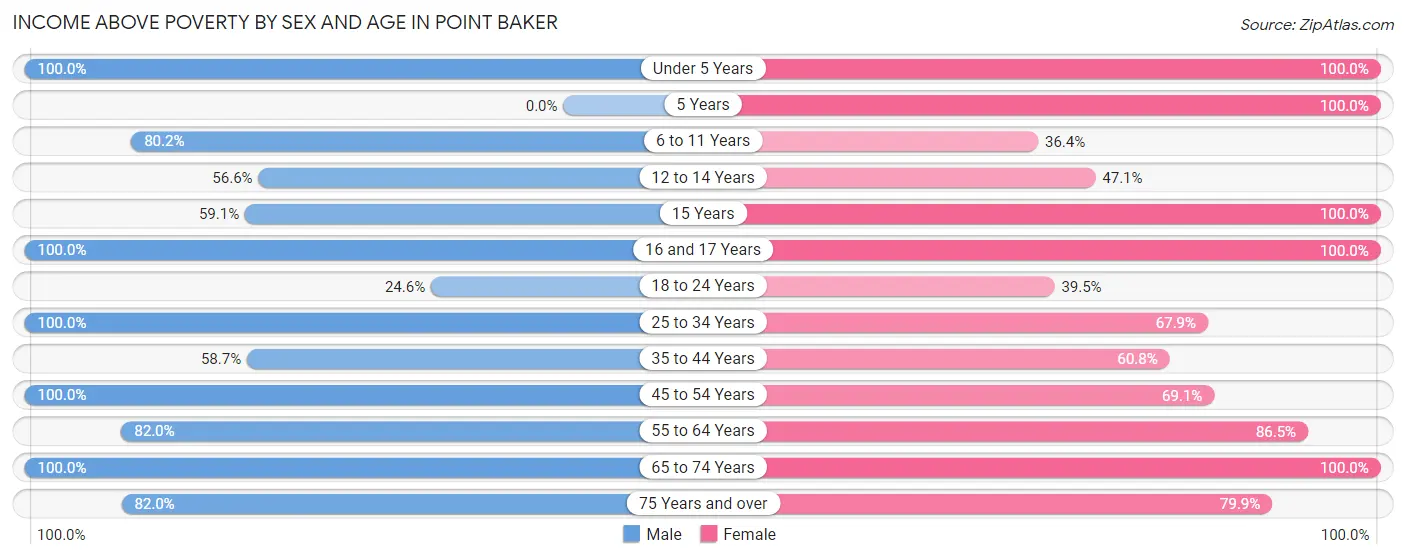
| Age Bracket | Male | Female |
| Under 5 Years | 134 (100.0%) | 56 (100.0%) |
| 5 Years | 0 (0.0%) | 67 (100.0%) |
| 6 to 11 Years | 162 (80.2%) | 51 (36.4%) |
| 12 to 14 Years | 30 (56.6%) | 24 (47.1%) |
| 15 Years | 13 (59.1%) | 18 (100.0%) |
| 16 and 17 Years | 12 (100.0%) | 18 (100.0%) |
| 18 to 24 Years | 43 (24.6%) | 45 (39.5%) |
| 25 to 34 Years | 535 (100.0%) | 267 (67.9%) |
| 35 to 44 Years | 64 (58.7%) | 146 (60.8%) |
| 45 to 54 Years | 228 (100.0%) | 132 (69.1%) |
| 55 to 64 Years | 105 (82.0%) | 231 (86.5%) |
| 65 to 74 Years | 92 (100.0%) | 108 (100.0%) |
| 75 Years and over | 73 (82.0%) | 119 (79.9%) |
| Total | 1,491 (83.8%) | 1,282 (70.8%) |
Income Below Poverty Among Married-Couple Families in Point Baker
The poverty statistics for married-couple families in Point Baker show that 12.9% or 73 of the total 568 families live below the poverty line. Families with 1 or 2 children have the highest poverty rate of 19.6%, comprising of 45 families. On the other hand, families with 3 or 4 children have the lowest poverty rate of 0.0%, which includes 0 families.
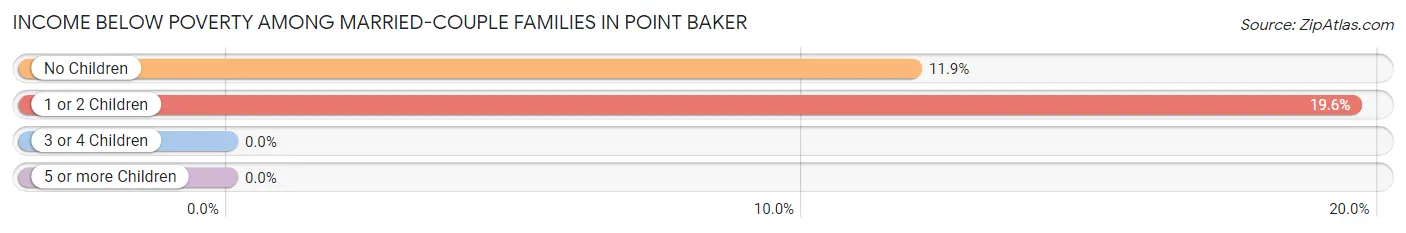
| Children | Above Poverty | Below Poverty |
| No Children | 207 (88.1%) | 28 (11.9%) |
| 1 or 2 Children | 185 (80.4%) | 45 (19.6%) |
| 3 or 4 Children | 103 (100.0%) | 0 (0.0%) |
| 5 or more Children | 0 (0.0%) | 0 (0.0%) |
| Total | 495 (87.2%) | 73 (12.9%) |
Income Below Poverty Among Single-Parent Households in Point Baker
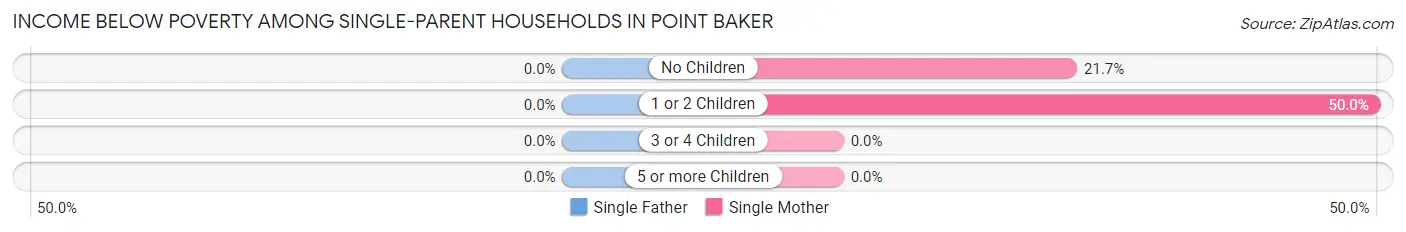
| Children | Single Father | Single Mother |
| No Children | 0 (0.0%) | 40 (21.7%) |
| 1 or 2 Children | 0 (0.0%) | 54 (50.0%) |
| 3 or 4 Children | 0 (0.0%) | 0 (0.0%) |
| 5 or more Children | 0 (0.0%) | 0 (0.0%) |
| Total | 0 (0.0%) | 94 (32.2%) |
Income Below Poverty Among Married-Couple vs Single-Parent Households in Point Baker
The poverty data for Point Baker shows that 73 of the married-couple family households (12.9%) and 94 of the single-parent households (26.7%) are living below the poverty level. Within the married-couple family households, those with 1 or 2 children have the highest poverty rate, with 45 households (19.6%) falling below the poverty line. Among the single-parent households, those with 1 or 2 children have the highest poverty rate, with 54 household (47.4%) living below poverty.
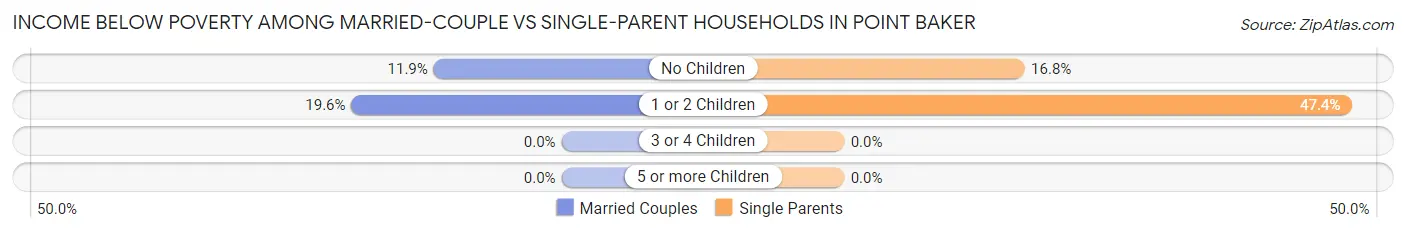
| Children | Married-Couple Families | Single-Parent Households |
| No Children | 28 (11.9%) | 40 (16.8%) |
| 1 or 2 Children | 45 (19.6%) | 54 (47.4%) |
| 3 or 4 Children | 0 (0.0%) | 0 (0.0%) |
| 5 or more Children | 0 (0.0%) | 0 (0.0%) |
| Total | 73 (12.9%) | 94 (26.7%) |
Race in Point Baker
The most populous races in Point Baker are White / Caucasian (2,906 | 80.9%), Two or more Races (390 | 10.9%), and Hispanic or Latino (207 | 5.8%).
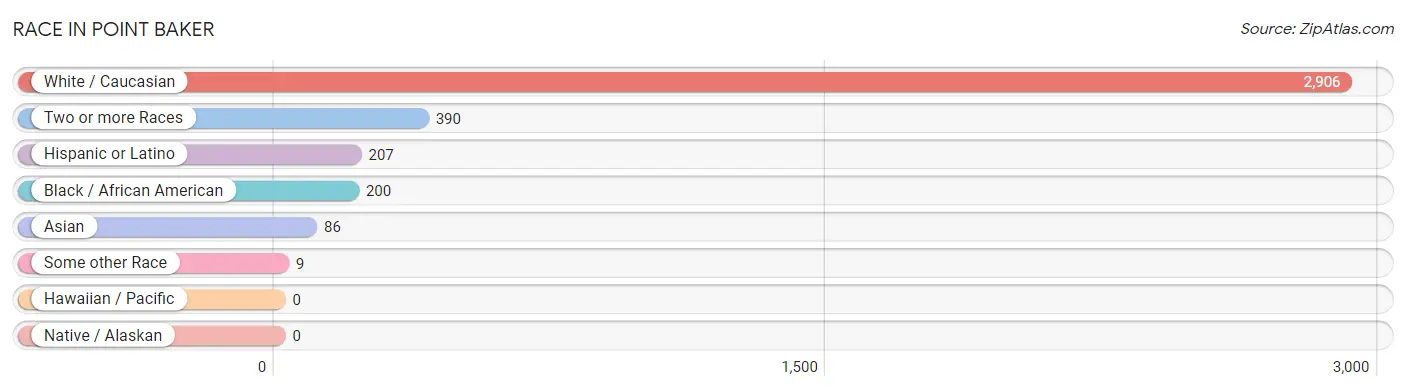
| Race | # Population | % Population |
| Asian | 86 | 2.4% |
| Black / African American | 200 | 5.6% |
| Hawaiian / Pacific | 0 | 0.0% |
| Hispanic or Latino | 207 | 5.8% |
| Native / Alaskan | 0 | 0.0% |
| White / Caucasian | 2,906 | 80.9% |
| Two or more Races | 390 | 10.9% |
| Some other Race | 9 | 0.3% |
| Total | 3,591 | 100.0% |
Ancestry in Point Baker
The most populous ancestries reported in Point Baker are Irish (733 | 20.4%), European (557 | 15.5%), German (468 | 13.0%), English (342 | 9.5%), and American (260 | 7.2%), together accounting for 65.7% of all Point Baker residents.
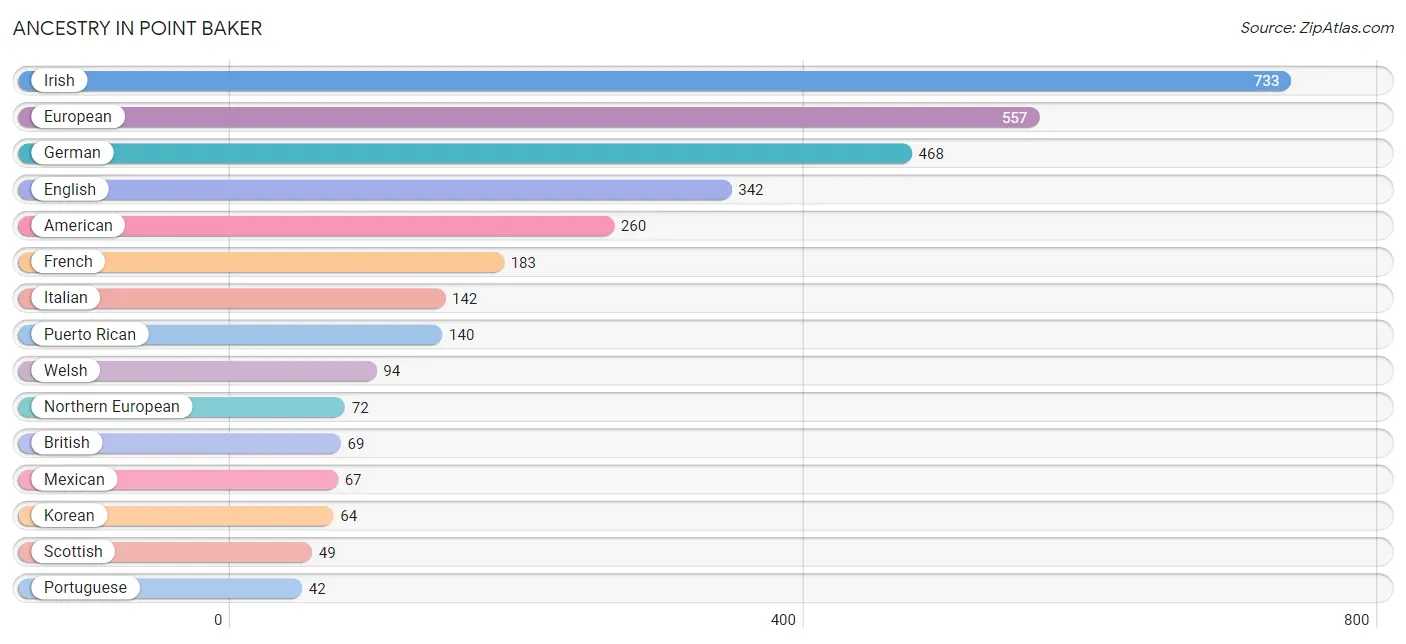
| Ancestry | # Population | % Population |
| African | 25 | 0.7% |
| American | 260 | 7.2% |
| Austrian | 10 | 0.3% |
| Bhutanese | 25 | 0.7% |
| British | 69 | 1.9% |
| Cherokee | 6 | 0.2% |
| Czech | 23 | 0.6% |
| Dutch | 18 | 0.5% |
| English | 342 | 9.5% |
| European | 557 | 15.5% |
| Finnish | 6 | 0.2% |
| French | 183 | 5.1% |
| German | 468 | 13.0% |
| Irish | 733 | 20.4% |
| Italian | 142 | 4.0% |
| Japanese | 12 | 0.3% |
| Korean | 64 | 1.8% |
| Mexican | 67 | 1.9% |
| Northern European | 72 | 2.0% |
| Polish | 14 | 0.4% |
| Portuguese | 42 | 1.2% |
| Puerto Rican | 140 | 3.9% |
| Russian | 12 | 0.3% |
| Scotch-Irish | 20 | 0.6% |
| Scottish | 49 | 1.4% |
| Slovak | 18 | 0.5% |
| Subsaharan African | 25 | 0.7% |
| Swedish | 14 | 0.4% |
| Welsh | 94 | 2.6% | View All 29 Rows |
Immigrants in Point Baker
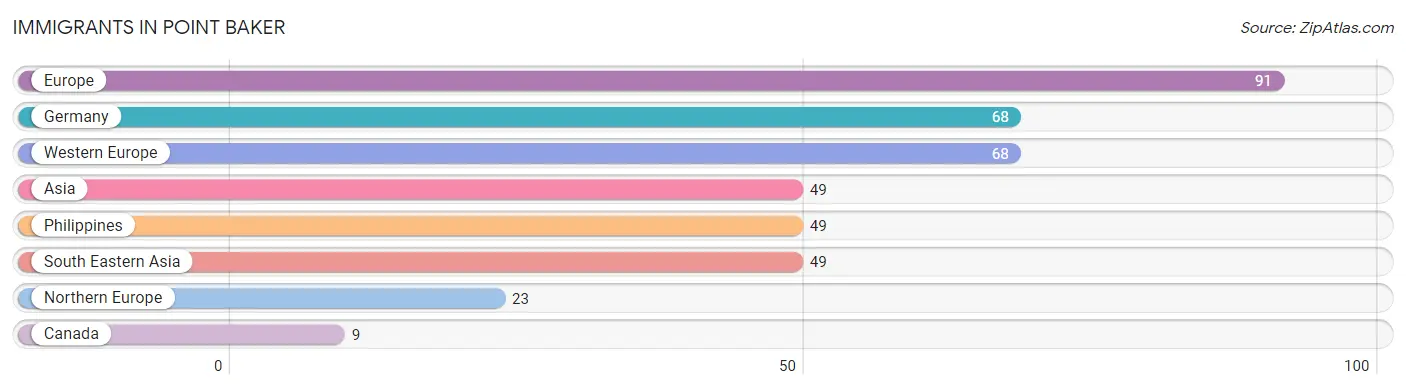
The most numerous immigrant groups reported in Point Baker came from Europe (91 | 2.5%), Germany (68 | 1.9%), Western Europe (68 | 1.9%), Asia (49 | 1.4%), and Philippines (49 | 1.4%), together accounting for 9.0% of all Point Baker residents.
| Immigration Origin | # Population | % Population |
| Asia | 49 | 1.4% |
| Canada | 9 | 0.3% |
| Europe | 91 | 2.5% |
| Germany | 68 | 1.9% |
| Northern Europe | 23 | 0.6% |
| Philippines | 49 | 1.4% |
| South Eastern Asia | 49 | 1.4% |
| Western Europe | 68 | 1.9% | View All 8 Rows |
Sex and Age in Point Baker
Sex and Age in Point Baker
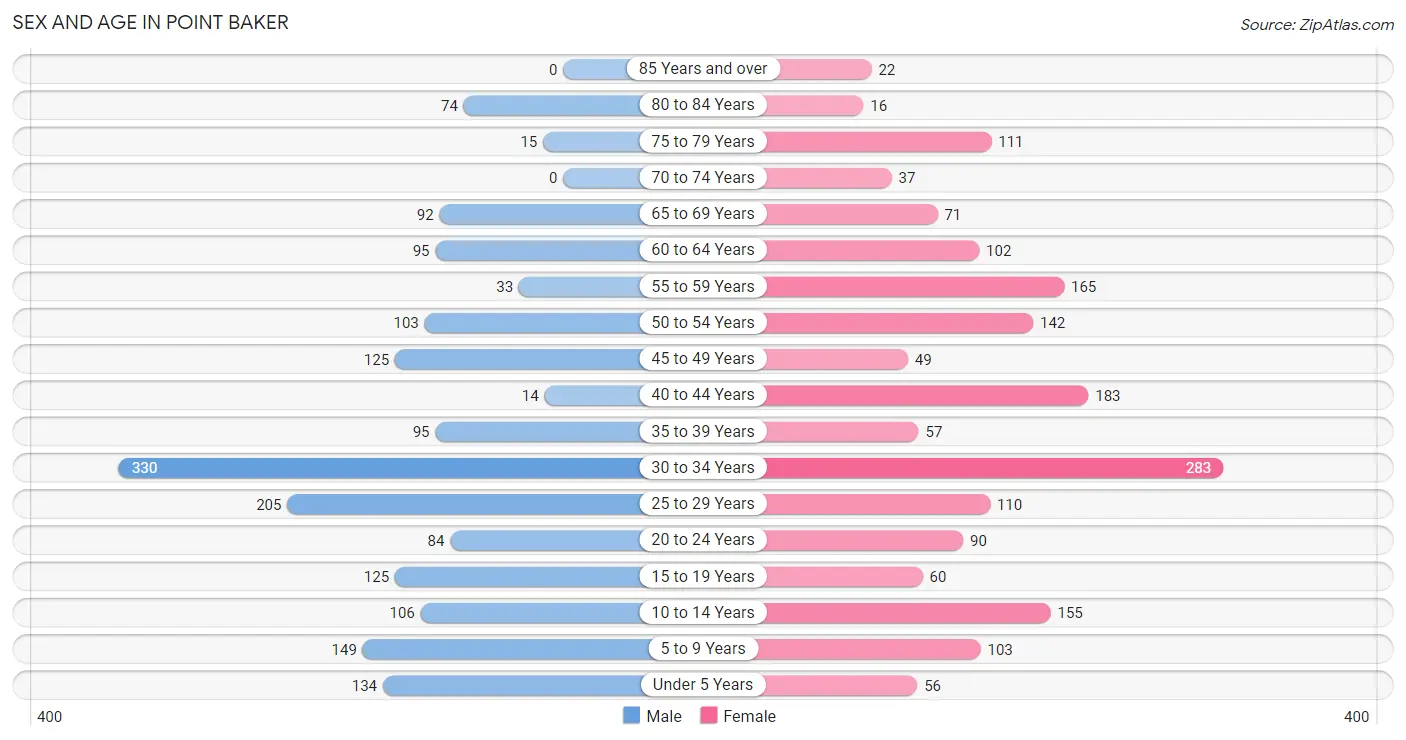
The most populous age groups in Point Baker are 30 to 34 Years (330 | 18.5%) for men and 30 to 34 Years (283 | 15.6%) for women.
| Age Bracket | Male | Female |
| Under 5 Years | 134 (7.5%) | 56 (3.1%) |
| 5 to 9 Years | 149 (8.4%) | 103 (5.7%) |
| 10 to 14 Years | 106 (6.0%) | 155 (8.6%) |
| 15 to 19 Years | 125 (7.0%) | 60 (3.3%) |
| 20 to 24 Years | 84 (4.7%) | 90 (5.0%) |
| 25 to 29 Years | 205 (11.5%) | 110 (6.1%) |
| 30 to 34 Years | 330 (18.5%) | 283 (15.6%) |
| 35 to 39 Years | 95 (5.3%) | 57 (3.2%) |
| 40 to 44 Years | 14 (0.8%) | 183 (10.1%) |
| 45 to 49 Years | 125 (7.0%) | 49 (2.7%) |
| 50 to 54 Years | 103 (5.8%) | 142 (7.8%) |
| 55 to 59 Years | 33 (1.8%) | 165 (9.1%) |
| 60 to 64 Years | 95 (5.3%) | 102 (5.6%) |
| 65 to 69 Years | 92 (5.2%) | 71 (3.9%) |
| 70 to 74 Years | 0 (0.0%) | 37 (2.0%) |
| 75 to 79 Years | 15 (0.8%) | 111 (6.1%) |
| 80 to 84 Years | 74 (4.2%) | 16 (0.9%) |
| 85 Years and over | 0 (0.0%) | 22 (1.2%) |
| Total | 1,779 (100.0%) | 1,812 (100.0%) |
Families and Households in Point Baker
Median Family Size in Point Baker
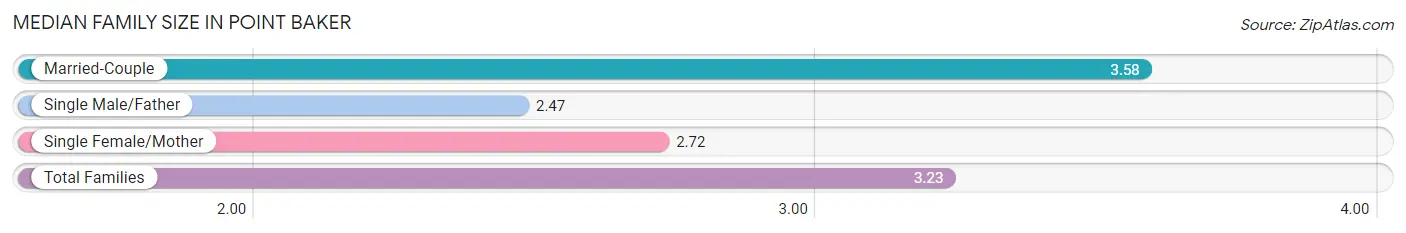
The median family size in Point Baker is 3.23 persons per family, with married-couple families (568 | 61.7%) accounting for the largest median family size of 3.58 persons per family. On the other hand, single male/father families (60 | 6.5%) represent the smallest median family size with 2.47 persons per family.
| Family Type | # Families | Family Size |
| Married-Couple | 568 (61.7%) | 3.58 |
| Single Male/Father | 60 (6.5%) | 2.47 |
| Single Female/Mother | 292 (31.7%) | 2.72 |
| Total Families | 920 (100.0%) | 3.23 |
Median Household Size in Point Baker
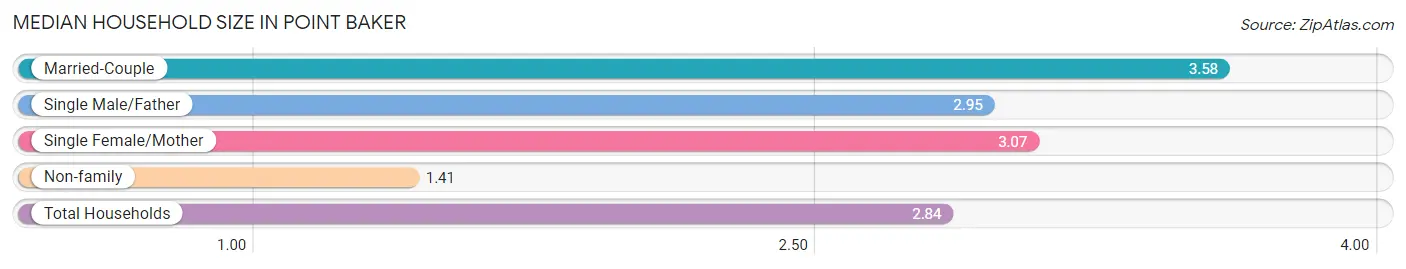
The median household size in Point Baker is 2.84 persons per household, with married-couple households (568 | 45.0%) accounting for the largest median household size of 3.58 persons per household. non-family households (343 | 27.2%) represent the smallest median household size with 1.41 persons per household.
| Household Type | # Households | Household Size |
| Married-Couple | 568 (45.0%) | 3.58 |
| Single Male/Father | 60 (4.8%) | 2.95 |
| Single Female/Mother | 292 (23.1%) | 3.07 |
| Non-family | 343 (27.2%) | 1.41 |
| Total Households | 1,263 (100.0%) | 2.84 |
Household Size by Marriage Status in Point Baker
Out of a total of 1,263 households in Point Baker, 920 (72.8%) are family households, while 343 (27.2%) are nonfamily households. The most numerous type of family households are 2-person households, comprising 354, and the most common type of nonfamily households are 1-person households, comprising 240.
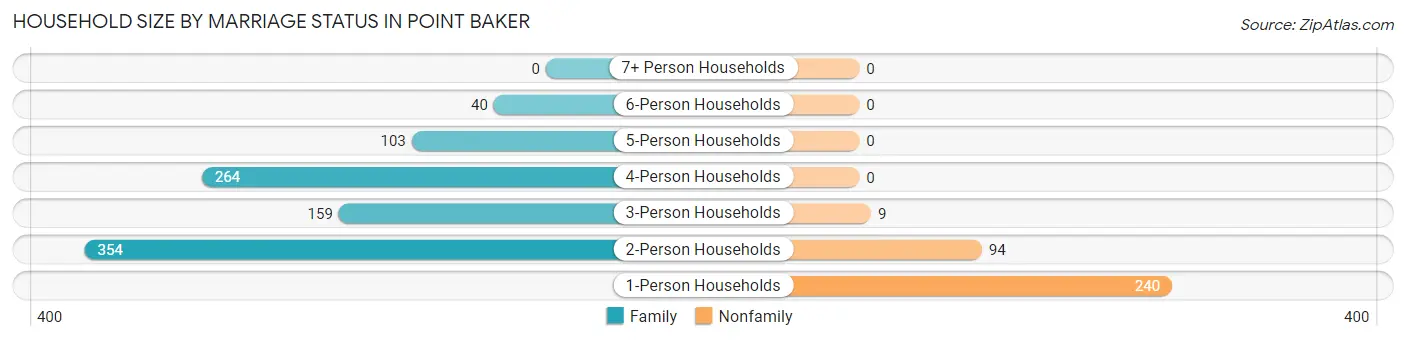
| Household Size | Family Households | Nonfamily Households |
| 1-Person Households | - | 240 (19.0%) |
| 2-Person Households | 354 (28.0%) | 94 (7.4%) |
| 3-Person Households | 159 (12.6%) | 9 (0.7%) |
| 4-Person Households | 264 (20.9%) | 0 (0.0%) |
| 5-Person Households | 103 (8.2%) | 0 (0.0%) |
| 6-Person Households | 40 (3.2%) | 0 (0.0%) |
| 7+ Person Households | 0 (0.0%) | 0 (0.0%) |
| Total | 920 (72.8%) | 343 (27.2%) |
Female Fertility in Point Baker
Fertility by Age in Point Baker
Average fertility rate in Point Baker is 98.0 births per 1,000 women. Women in the age bracket of 20 to 34 years have the highest fertility rate with 182.0 births per 1,000 women. Women in the age bracket of 20 to 34 years acount for 100.0% of all women with births.
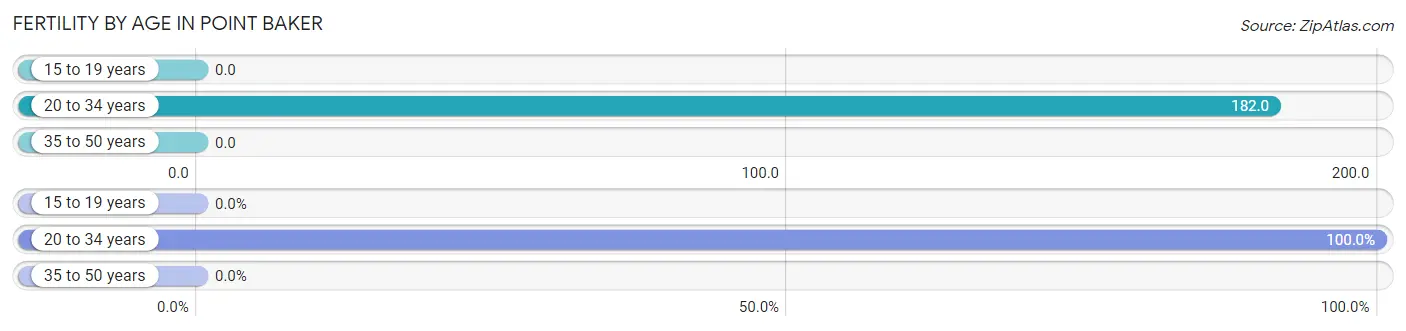
| Age Bracket | Women with Births | Births / 1,000 Women |
| 15 to 19 years | 0 (0.0%) | 0.0 |
| 20 to 34 years | 88 (100.0%) | 182.0 |
| 35 to 50 years | 0 (0.0%) | 0.0 |
| Total | 88 (100.0%) | 98.0 |
Fertility by Age by Marriage Status in Point Baker
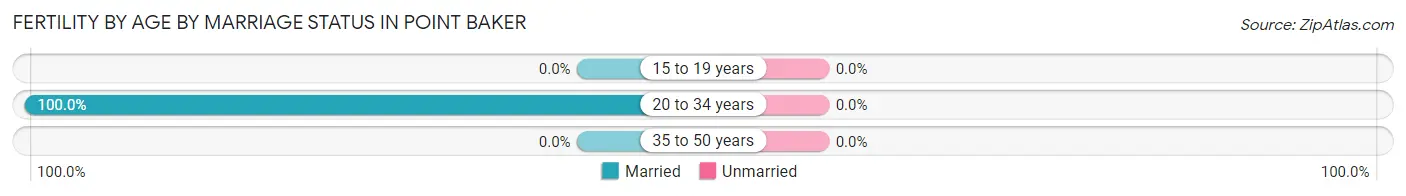
| Age Bracket | Married | Unmarried |
| 15 to 19 years | 0 (0.0%) | 0 (0.0%) |
| 20 to 34 years | 88 (100.0%) | 0 (0.0%) |
| 35 to 50 years | 0 (0.0%) | 0 (0.0%) |
| Total | 88 (100.0%) | 0 (0.0%) |
Fertility by Education in Point Baker
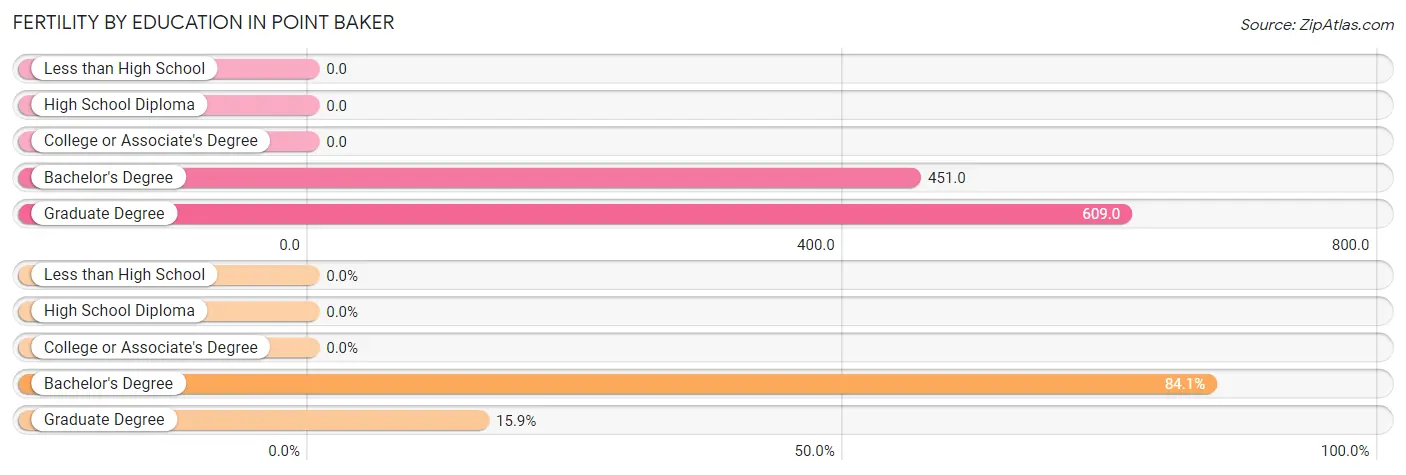
| Educational Attainment | Women with Births | Births / 1,000 Women |
| Less than High School | 0 (0.0%) | 0.0 |
| High School Diploma | 0 (0.0%) | 0.0 |
| College or Associate's Degree | 0 (0.0%) | 0.0 |
| Bachelor's Degree | 74 (84.1%) | 451.0 |
| Graduate Degree | 14 (15.9%) | 609.0 |
| Total | 88 (100.0%) | 98.0 |
Fertility by Education by Marriage Status in Point Baker
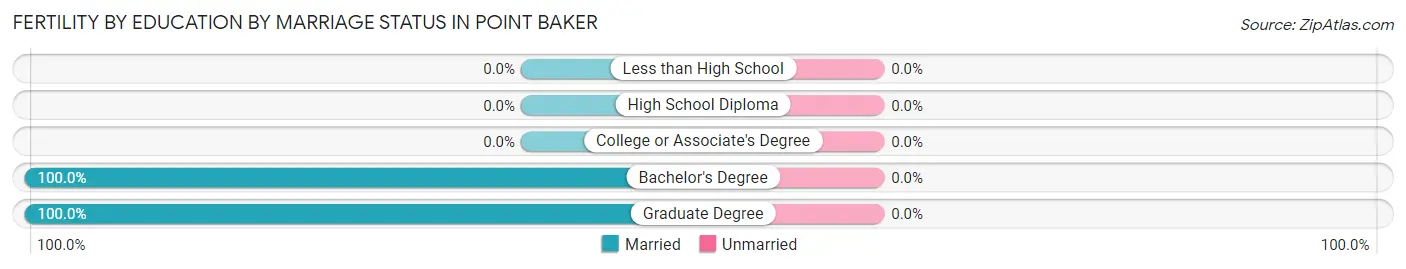
| Educational Attainment | Married | Unmarried |
| Less than High School | 0 (0.0%) | 0 (0.0%) |
| High School Diploma | 0 (0.0%) | 0 (0.0%) |
| College or Associate's Degree | 0 (0.0%) | 0 (0.0%) |
| Bachelor's Degree | 74 (100.0%) | 0 (0.0%) |
| Graduate Degree | 14 (100.0%) | 0 (0.0%) |
| Total | 88 (100.0%) | 0 (0.0%) |
Employment Characteristics in Point Baker
Employment by Class of Employer in Point Baker
Among the 1,479 employed individuals in Point Baker, private company employees (962 | 65.0%), not-for-profit organizations (148 | 10.0%), and self-employed (not incorporated) (111 | 7.5%) make up the most common classes of employment.
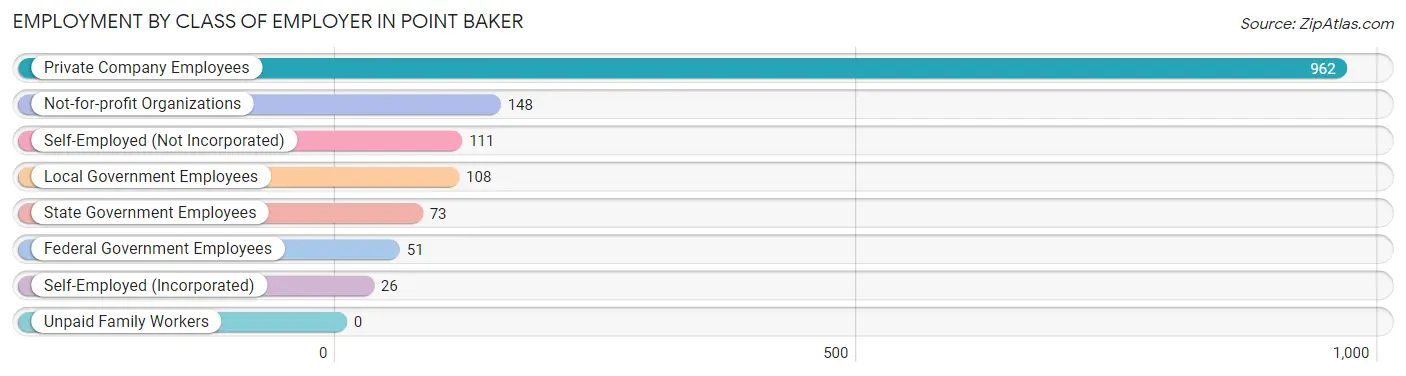
| Employer Class | # Employees | % Employees |
| Private Company Employees | 962 | 65.0% |
| Self-Employed (Incorporated) | 26 | 1.8% |
| Self-Employed (Not Incorporated) | 111 | 7.5% |
| Not-for-profit Organizations | 148 | 10.0% |
| Local Government Employees | 108 | 7.3% |
| State Government Employees | 73 | 4.9% |
| Federal Government Employees | 51 | 3.5% |
| Unpaid Family Workers | 0 | 0.0% |
| Total | 1,479 | 100.0% |
Employment Status by Age in Point Baker
According to the labor force statistics for Point Baker, out of the total population over 16 years of age (2,848), 65.1% or 1,854 individuals are in the labor force, with 12.1% or 224 of them unemployed. The age group with the highest labor force participation rate is 30 to 34 years, with 100.0% or 613 individuals in the labor force. Within the labor force, the 30 to 34 years age range has the highest percentage of unemployed individuals, with 24.0% or 147 of them being unemployed.
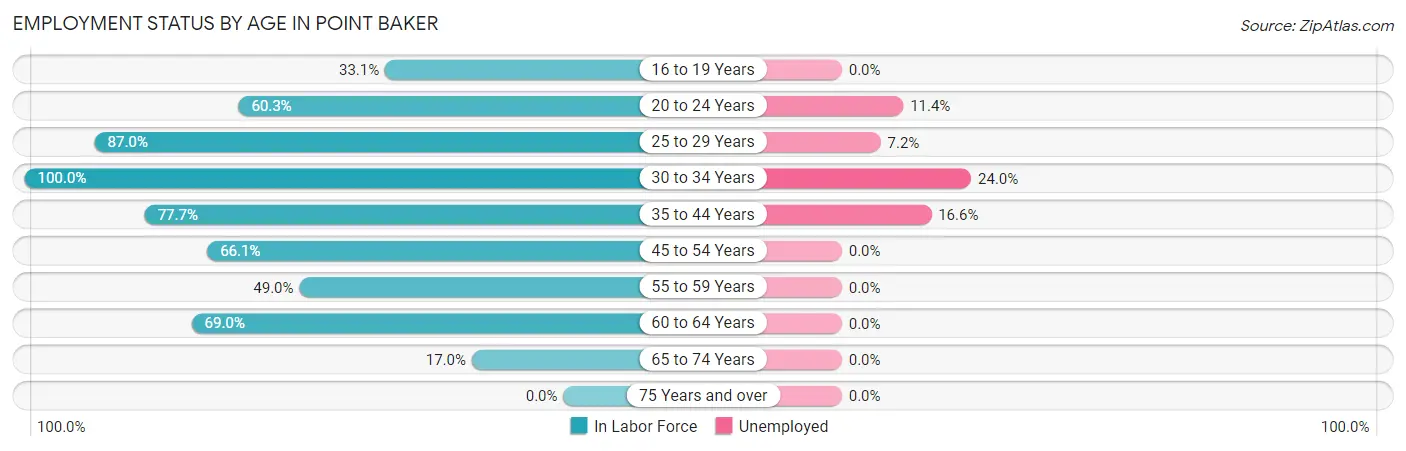
| Age Bracket | In Labor Force | Unemployed |
| 16 to 19 Years | 48 (33.1%) | 0 (0.0%) |
| 20 to 24 Years | 105 (60.3%) | 12 (11.4%) |
| 25 to 29 Years | 274 (87.0%) | 20 (7.2%) |
| 30 to 34 Years | 613 (100.0%) | 147 (24.0%) |
| 35 to 44 Years | 271 (77.7%) | 45 (16.6%) |
| 45 to 54 Years | 277 (66.1%) | 0 (0.0%) |
| 55 to 59 Years | 97 (49.0%) | 0 (0.0%) |
| 60 to 64 Years | 136 (69.0%) | 0 (0.0%) |
| 65 to 74 Years | 34 (17.0%) | 0 (0.0%) |
| 75 Years and over | 0 (0.0%) | 0 (0.0%) |
| Total | 1,854 (65.1%) | 224 (12.1%) |
Employment Status by Educational Attainment in Point Baker
According to labor force statistics for Point Baker, 79.8% of individuals (1,669) out of the total population between 25 and 64 years of age (2,091) are in the labor force, with 12.7% or 212 of them being unemployed. The group with the highest labor force participation rate are those with the educational attainment of college / associate degree, with 86.8% or 944 individuals in the labor force. Within the labor force, individuals with college / associate degree education have the highest percentage of unemployment, with 15.6% or 147 of them being unemployed.
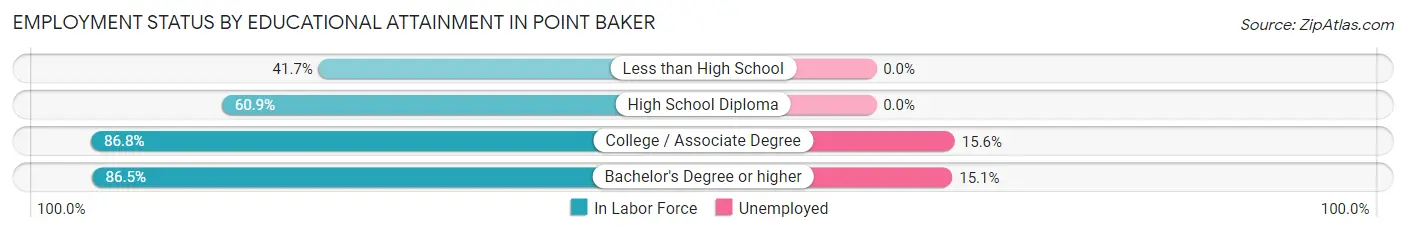
| Educational Attainment | In Labor Force | Unemployed |
| Less than High School | 25 (41.7%) | 0 (0.0%) |
| High School Diploma | 277 (60.9%) | 0 (0.0%) |
| College / Associate Degree | 944 (86.8%) | 170 (15.6%) |
| Bachelor's Degree or higher | 423 (86.5%) | 74 (15.1%) |
| Total | 1,669 (79.8%) | 266 (12.7%) |
Employment Occupations by Sex in Point Baker
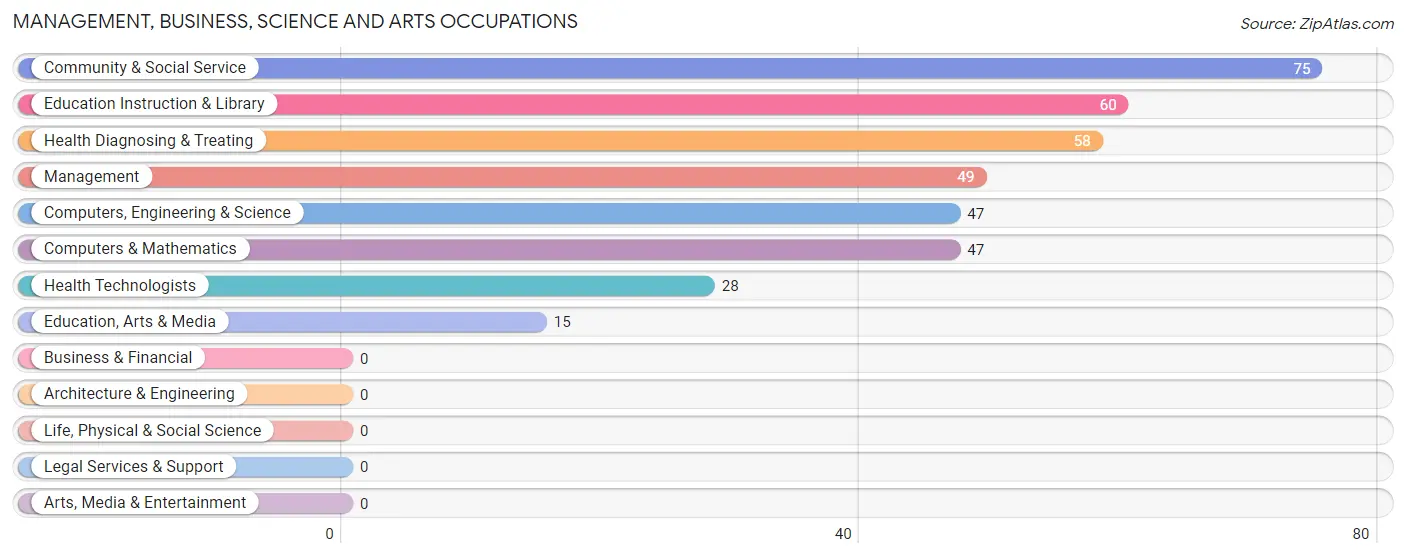
Management, Business, Science and Arts Occupations
The most common Management, Business, Science and Arts occupations in Point Baker are Community & Social Service (75 | 4.6%), Education Instruction & Library (60 | 3.7%), Health Diagnosing & Treating (58 | 3.6%), Management (49 | 3.0%), and Computers, Engineering & Science (47 | 2.9%).
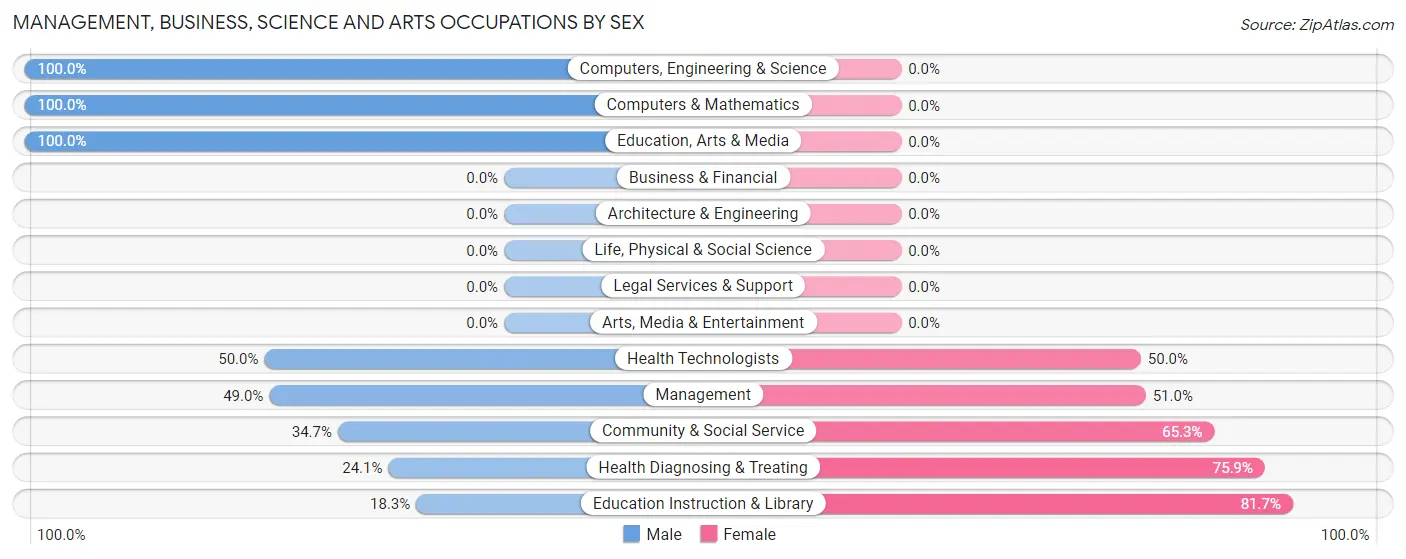
Management, Business, Science and Arts Occupations by Sex
Within the Management, Business, Science and Arts occupations in Point Baker, the most male-oriented occupations are Computers, Engineering & Science (100.0%), Computers & Mathematics (100.0%), and Education, Arts & Media (100.0%), while the most female-oriented occupations are Education Instruction & Library (81.7%), Health Diagnosing & Treating (75.9%), and Community & Social Service (65.3%).
| Occupation | Male | Female |
| Management | 24 (49.0%) | 25 (51.0%) |
| Business & Financial | 0 (0.0%) | 0 (0.0%) |
| Computers, Engineering & Science | 47 (100.0%) | 0 (0.0%) |
| Computers & Mathematics | 47 (100.0%) | 0 (0.0%) |
| Architecture & Engineering | 0 (0.0%) | 0 (0.0%) |
| Life, Physical & Social Science | 0 (0.0%) | 0 (0.0%) |
| Community & Social Service | 26 (34.7%) | 49 (65.3%) |
| Education, Arts & Media | 15 (100.0%) | 0 (0.0%) |
| Legal Services & Support | 0 (0.0%) | 0 (0.0%) |
| Education Instruction & Library | 11 (18.3%) | 49 (81.7%) |
| Arts, Media & Entertainment | 0 (0.0%) | 0 (0.0%) |
| Health Diagnosing & Treating | 14 (24.1%) | 44 (75.9%) |
| Health Technologists | 14 (50.0%) | 14 (50.0%) |
| Total (Category) | 111 (48.5%) | 118 (51.5%) |
| Total (Overall) | 902 (55.6%) | 721 (44.4%) |
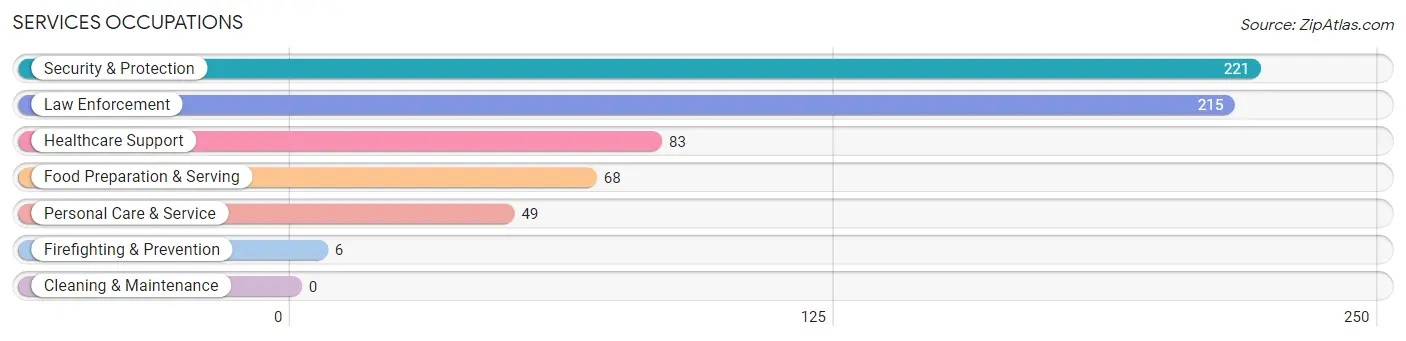
Services Occupations
The most common Services occupations in Point Baker are Security & Protection (221 | 13.6%), Law Enforcement (215 | 13.3%), Healthcare Support (83 | 5.1%), Food Preparation & Serving (68 | 4.2%), and Personal Care & Service (49 | 3.0%).
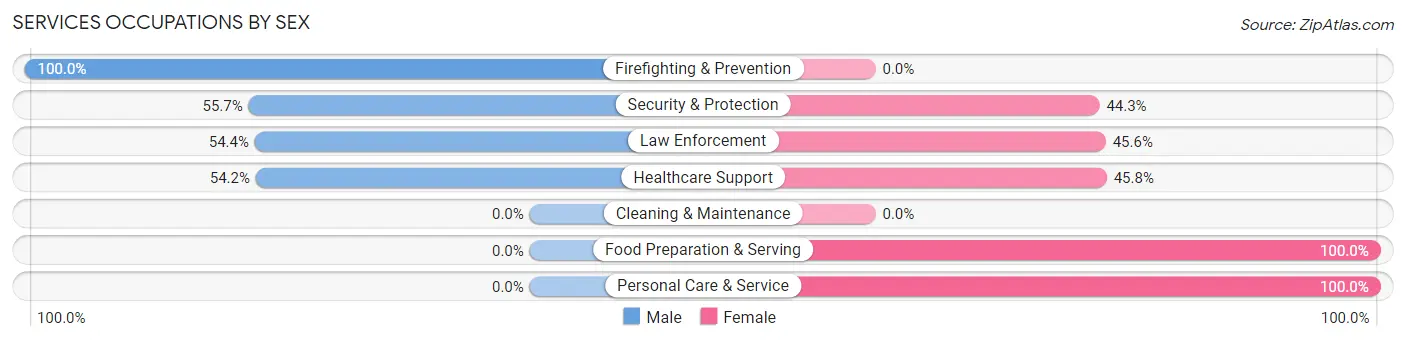
Services Occupations by Sex
Within the Services occupations in Point Baker, the most male-oriented occupations are Firefighting & Prevention (100.0%), Security & Protection (55.7%), and Law Enforcement (54.4%), while the most female-oriented occupations are Food Preparation & Serving (100.0%), Personal Care & Service (100.0%), and Healthcare Support (45.8%).
| Occupation | Male | Female |
| Healthcare Support | 45 (54.2%) | 38 (45.8%) |
| Security & Protection | 123 (55.7%) | 98 (44.3%) |
| Firefighting & Prevention | 6 (100.0%) | 0 (0.0%) |
| Law Enforcement | 117 (54.4%) | 98 (45.6%) |
| Food Preparation & Serving | 0 (0.0%) | 68 (100.0%) |
| Cleaning & Maintenance | 0 (0.0%) | 0 (0.0%) |
| Personal Care & Service | 0 (0.0%) | 49 (100.0%) |
| Total (Category) | 168 (39.9%) | 253 (60.1%) |
| Total (Overall) | 902 (55.6%) | 721 (44.4%) |
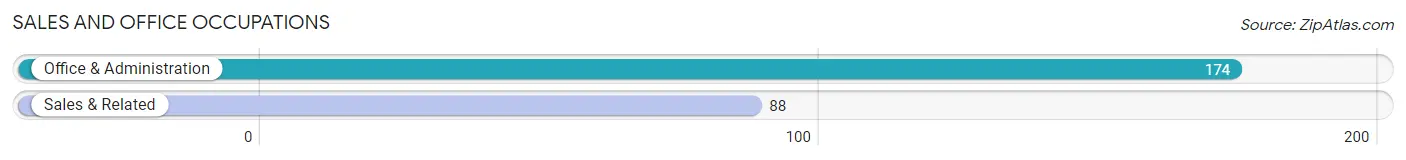
Sales and Office Occupations
The most common Sales and Office occupations in Point Baker are Office & Administration (174 | 10.7%), and Sales & Related (88 | 5.4%).
Sales and Office Occupations by Sex
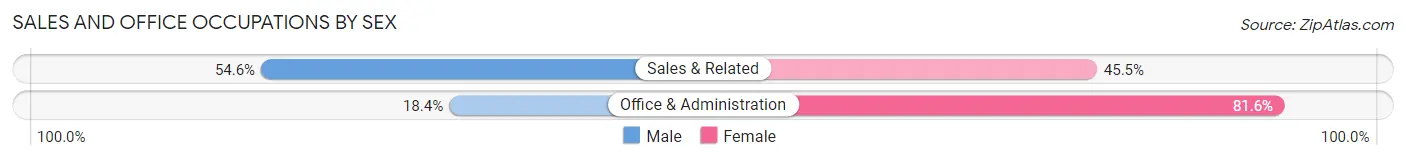
| Occupation | Male | Female |
| Sales & Related | 48 (54.5%) | 40 (45.5%) |
| Office & Administration | 32 (18.4%) | 142 (81.6%) |
| Total (Category) | 80 (30.5%) | 182 (69.5%) |
| Total (Overall) | 902 (55.6%) | 721 (44.4%) |
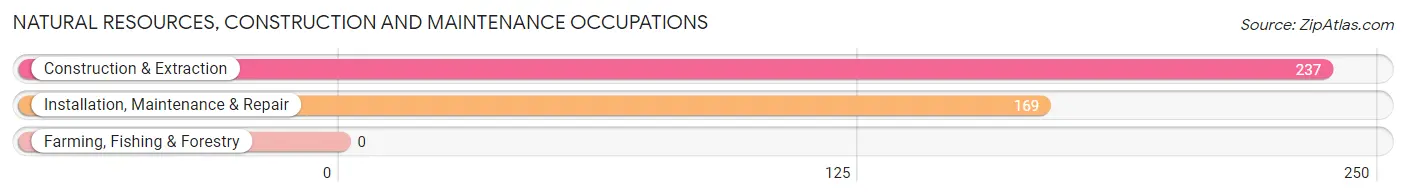
Natural Resources, Construction and Maintenance Occupations
The most common Natural Resources, Construction and Maintenance occupations in Point Baker are Construction & Extraction (237 | 14.6%), and Installation, Maintenance & Repair (169 | 10.4%).
Natural Resources, Construction and Maintenance Occupations by Sex
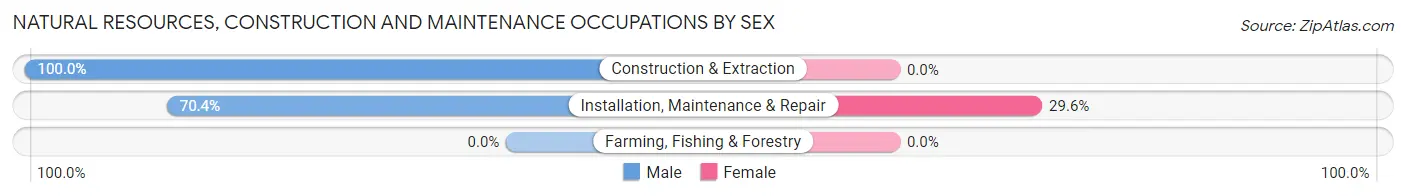
| Occupation | Male | Female |
| Farming, Fishing & Forestry | 0 (0.0%) | 0 (0.0%) |
| Construction & Extraction | 237 (100.0%) | 0 (0.0%) |
| Installation, Maintenance & Repair | 119 (70.4%) | 50 (29.6%) |
| Total (Category) | 356 (87.7%) | 50 (12.3%) |
| Total (Overall) | 902 (55.6%) | 721 (44.4%) |
Production, Transportation and Moving Occupations
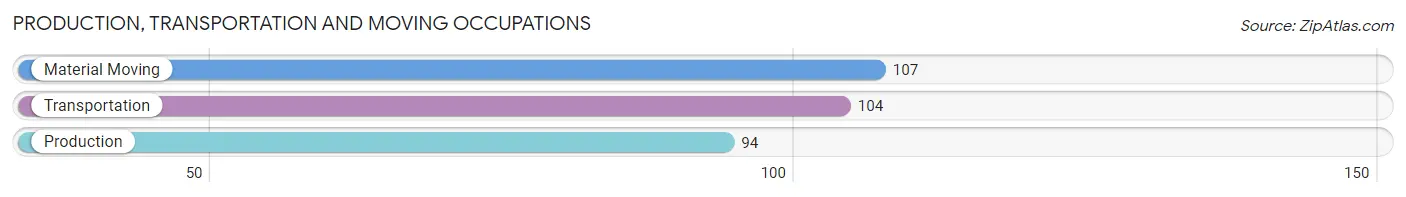
The most common Production, Transportation and Moving occupations in Point Baker are Material Moving (107 | 6.6%), Transportation (104 | 6.4%), and Production (94 | 5.8%).
Production, Transportation and Moving Occupations by Sex
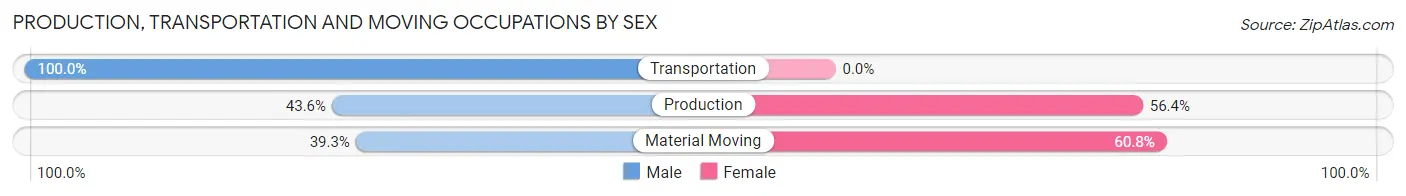
| Occupation | Male | Female |
| Production | 41 (43.6%) | 53 (56.4%) |
| Transportation | 104 (100.0%) | 0 (0.0%) |
| Material Moving | 42 (39.3%) | 65 (60.8%) |
| Total (Category) | 187 (61.3%) | 118 (38.7%) |
| Total (Overall) | 902 (55.6%) | 721 (44.4%) |
Employment Industries by Sex in Point Baker
Employment Industries in Point Baker
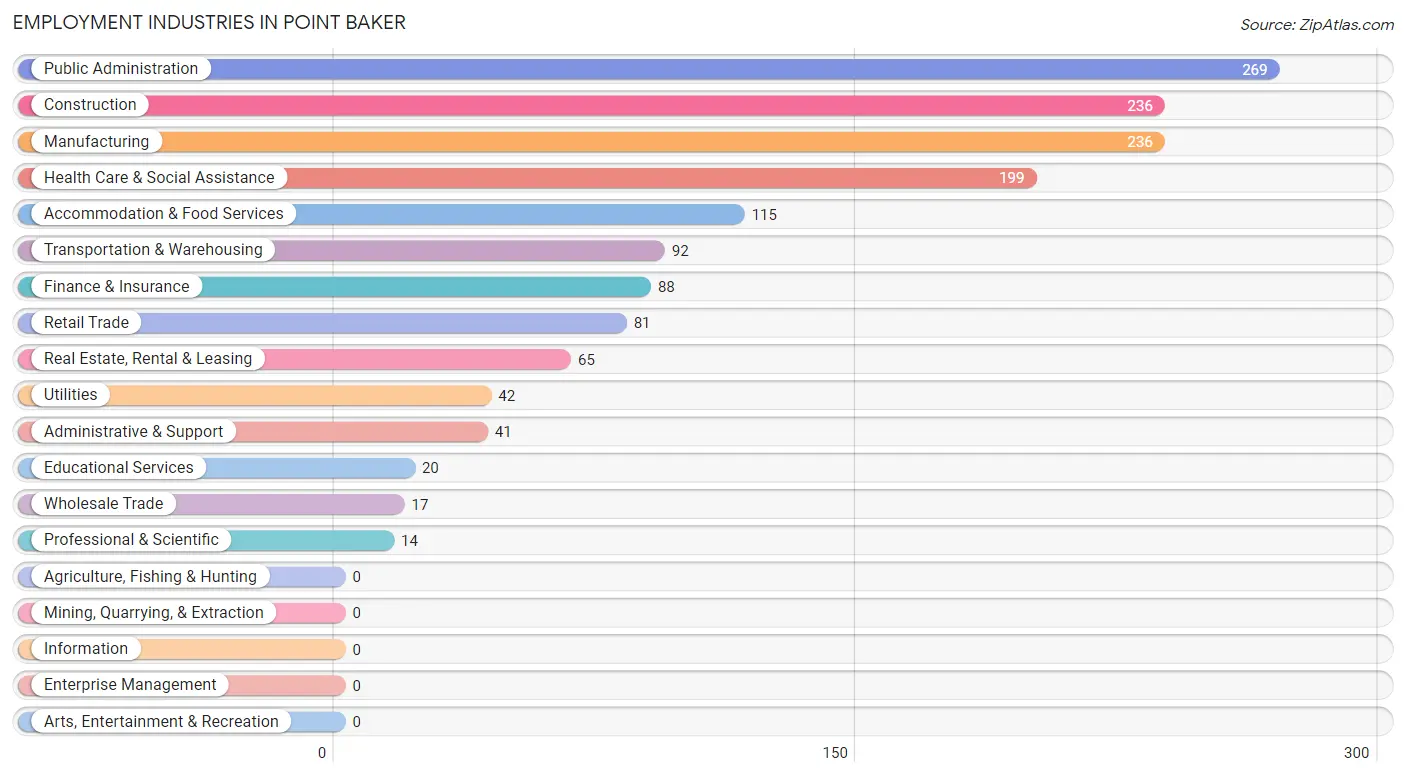
The major employment industries in Point Baker include Public Administration (269 | 16.6%), Construction (236 | 14.5%), Manufacturing (236 | 14.5%), Health Care & Social Assistance (199 | 12.3%), and Accommodation & Food Services (115 | 7.1%).
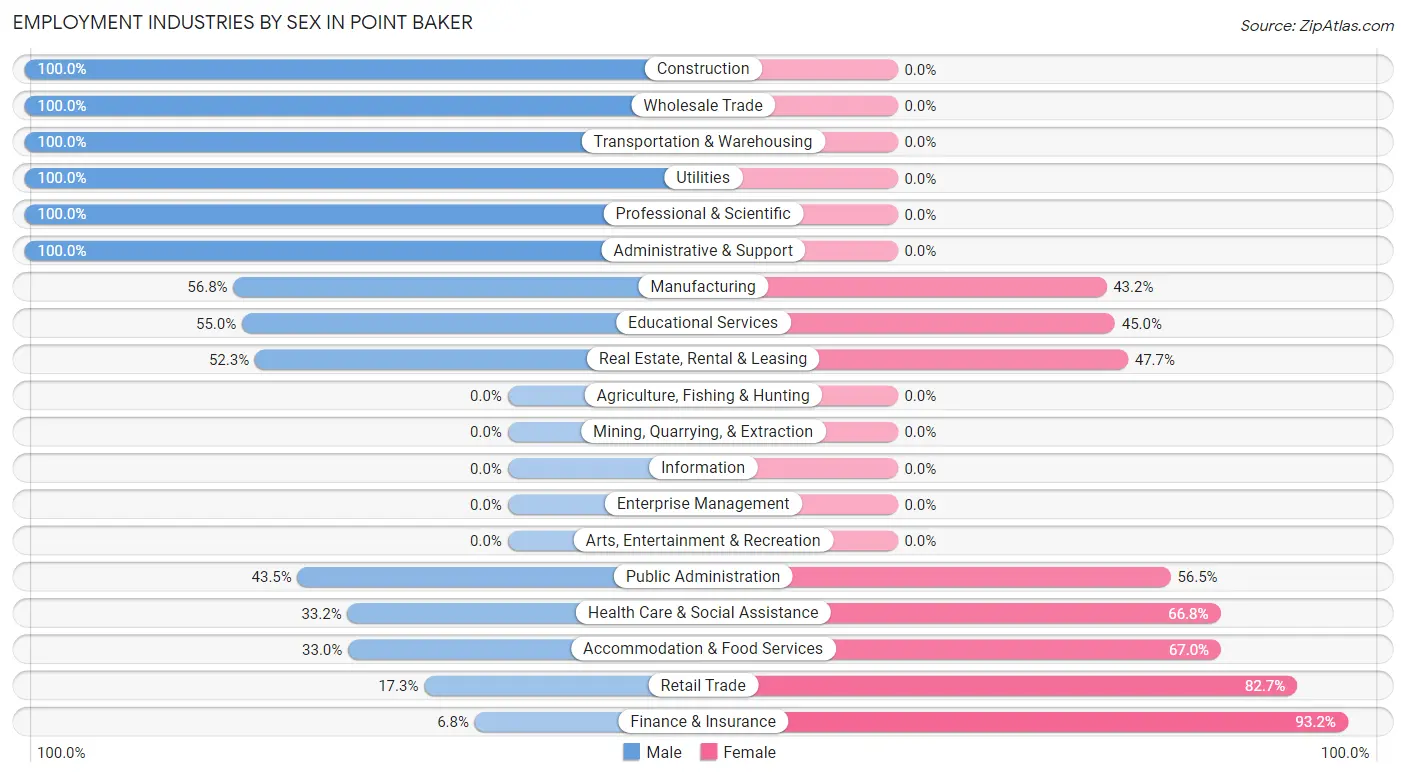
Employment Industries by Sex in Point Baker
The Point Baker industries that see more men than women are Construction (100.0%), Wholesale Trade (100.0%), and Transportation & Warehousing (100.0%), whereas the industries that tend to have a higher number of women are Finance & Insurance (93.2%), Retail Trade (82.7%), and Accommodation & Food Services (67.0%).
| Industry | Male | Female |
| Agriculture, Fishing & Hunting | 0 (0.0%) | 0 (0.0%) |
| Mining, Quarrying, & Extraction | 0 (0.0%) | 0 (0.0%) |
| Construction | 236 (100.0%) | 0 (0.0%) |
| Manufacturing | 134 (56.8%) | 102 (43.2%) |
| Wholesale Trade | 17 (100.0%) | 0 (0.0%) |
| Retail Trade | 14 (17.3%) | 67 (82.7%) |
| Transportation & Warehousing | 92 (100.0%) | 0 (0.0%) |
| Utilities | 42 (100.0%) | 0 (0.0%) |
| Information | 0 (0.0%) | 0 (0.0%) |
| Finance & Insurance | 6 (6.8%) | 82 (93.2%) |
| Real Estate, Rental & Leasing | 34 (52.3%) | 31 (47.7%) |
| Professional & Scientific | 14 (100.0%) | 0 (0.0%) |
| Enterprise Management | 0 (0.0%) | 0 (0.0%) |
| Administrative & Support | 41 (100.0%) | 0 (0.0%) |
| Educational Services | 11 (55.0%) | 9 (45.0%) |
| Health Care & Social Assistance | 66 (33.2%) | 133 (66.8%) |
| Arts, Entertainment & Recreation | 0 (0.0%) | 0 (0.0%) |
| Accommodation & Food Services | 38 (33.0%) | 77 (67.0%) |
| Public Administration | 117 (43.5%) | 152 (56.5%) |
| Total | 902 (55.6%) | 721 (44.4%) |
Education in Point Baker
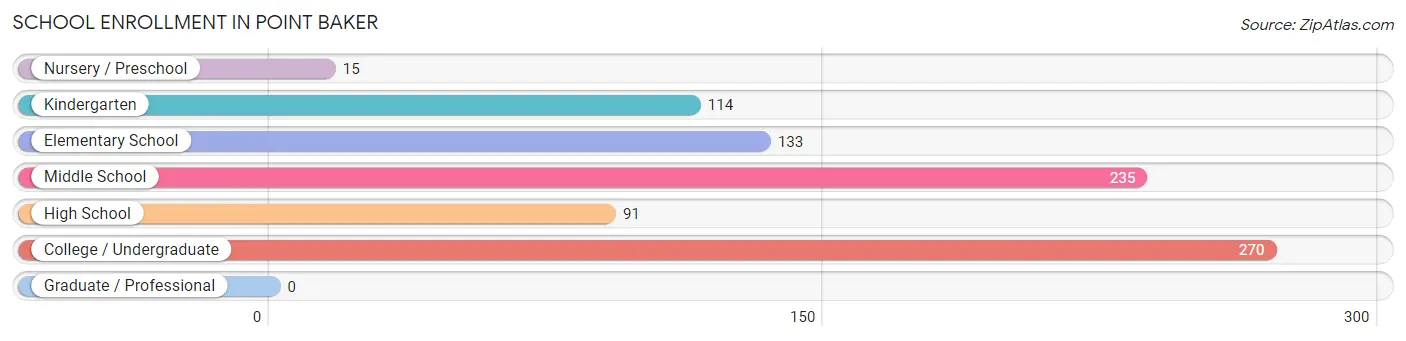
School Enrollment in Point Baker
The most common levels of schooling among the 858 students in Point Baker are college / undergraduate (270 | 31.5%), middle school (235 | 27.4%), and elementary school (133 | 15.5%).
| School Level | # Students | % Students |
| Nursery / Preschool | 15 | 1.8% |
| Kindergarten | 114 | 13.3% |
| Elementary School | 133 | 15.5% |
| Middle School | 235 | 27.4% |
| High School | 91 | 10.6% |
| College / Undergraduate | 270 | 31.5% |
| Graduate / Professional | 0 | 0.0% |
| Total | 858 | 100.0% |
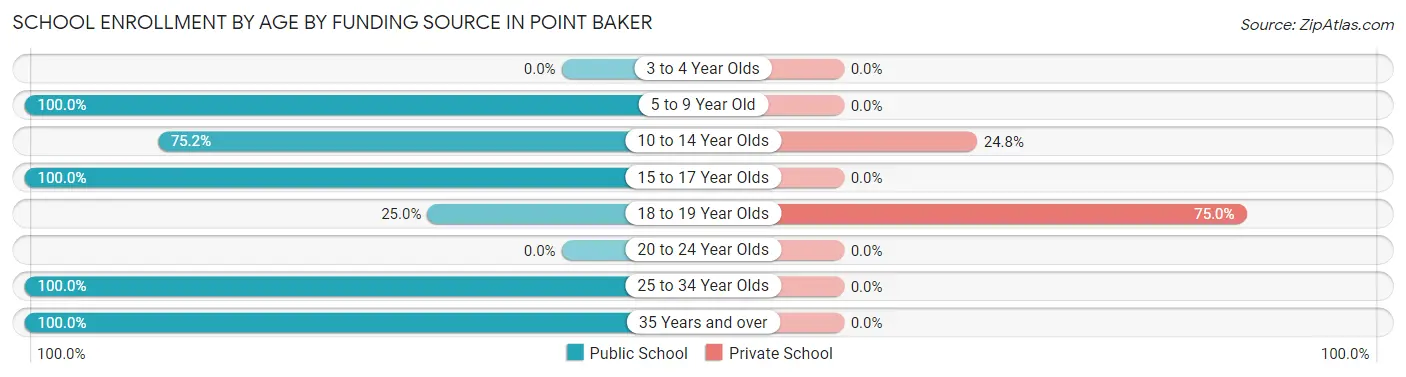
School Enrollment by Age by Funding Source in Point Baker
Out of a total of 858 students who are enrolled in schools in Point Baker, 91 (10.6%) attend a private institution, while the remaining 767 (89.4%) are enrolled in public schools. The age group of 18 to 19 year olds has the highest likelihood of being enrolled in private schools, with 30 (75.0% in the age bracket) enrolled. Conversely, the age group of 5 to 9 year old has the lowest likelihood of being enrolled in a private school, with 242 (100.0% in the age bracket) attending a public institution.
| Age Bracket | Public School | Private School |
| 3 to 4 Year Olds | 0 (0.0%) | 0 (0.0%) |
| 5 to 9 Year Old | 242 (100.0%) | 0 (0.0%) |
| 10 to 14 Year Olds | 185 (75.2%) | 61 (24.8%) |
| 15 to 17 Year Olds | 70 (100.0%) | 0 (0.0%) |
| 18 to 19 Year Olds | 10 (25.0%) | 30 (75.0%) |
| 20 to 24 Year Olds | 0 (0.0%) | 0 (0.0%) |
| 25 to 34 Year Olds | 165 (100.0%) | 0 (0.0%) |
| 35 Years and over | 95 (100.0%) | 0 (0.0%) |
| Total | 767 (89.4%) | 91 (10.6%) |
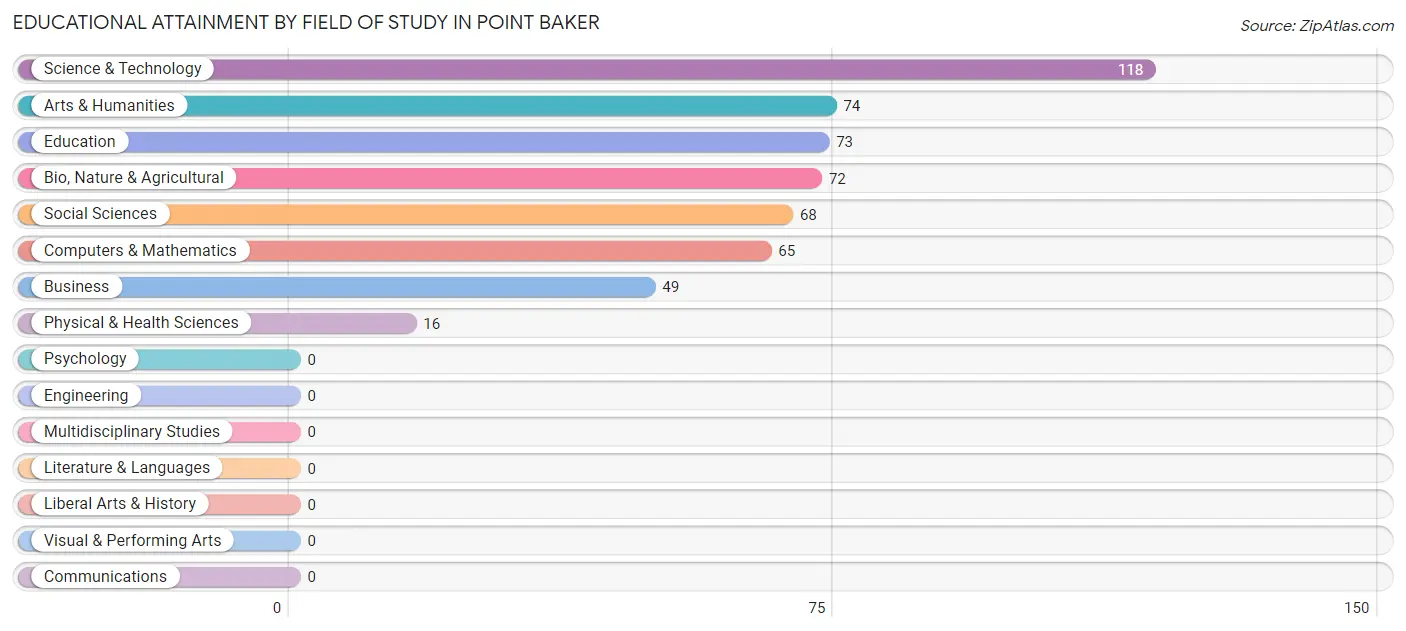
Educational Attainment by Field of Study in Point Baker
Science & technology (118 | 22.1%), arts & humanities (74 | 13.8%), education (73 | 13.6%), bio, nature & agricultural (72 | 13.5%), and social sciences (68 | 12.7%) are the most common fields of study among 535 individuals in Point Baker who have obtained a bachelor's degree or higher.
| Field of Study | # Graduates | % Graduates |
| Computers & Mathematics | 65 | 12.1% |
| Bio, Nature & Agricultural | 72 | 13.5% |
| Physical & Health Sciences | 16 | 3.0% |
| Psychology | 0 | 0.0% |
| Social Sciences | 68 | 12.7% |
| Engineering | 0 | 0.0% |
| Multidisciplinary Studies | 0 | 0.0% |
| Science & Technology | 118 | 22.1% |
| Business | 49 | 9.2% |
| Education | 73 | 13.6% |
| Literature & Languages | 0 | 0.0% |
| Liberal Arts & History | 0 | 0.0% |
| Visual & Performing Arts | 0 | 0.0% |
| Communications | 0 | 0.0% |
| Arts & Humanities | 74 | 13.8% |
| Total | 535 | 100.0% |
Transportation & Commute in Point Baker
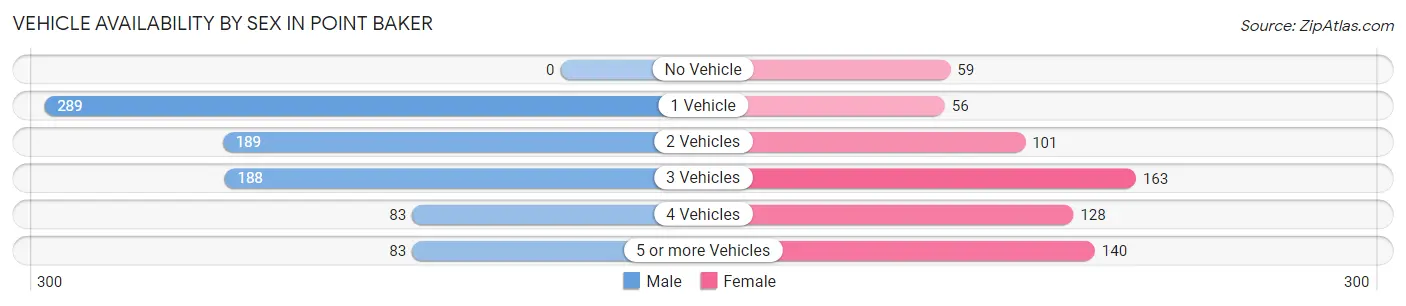
Vehicle Availability by Sex in Point Baker
The most prevalent vehicle ownership categories in Point Baker are males with 1 vehicle (289, accounting for 34.7%) and females with 1 vehicle (56, making up 44.7%).
| Vehicles Available | Male | Female |
| No Vehicle | 0 (0.0%) | 59 (9.1%) |
| 1 Vehicle | 289 (34.7%) | 56 (8.7%) |
| 2 Vehicles | 189 (22.7%) | 101 (15.6%) |
| 3 Vehicles | 188 (22.6%) | 163 (25.2%) |
| 4 Vehicles | 83 (10.0%) | 128 (19.8%) |
| 5 or more Vehicles | 83 (10.0%) | 140 (21.6%) |
| Total | 832 (100.0%) | 647 (100.0%) |
Commute Time in Point Baker
The most frequently occuring commute durations in Point Baker are 30 to 34 minutes (252 commuters, 19.1%), 10 to 14 minutes (234 commuters, 17.7%), and 15 to 19 minutes (234 commuters, 17.7%).
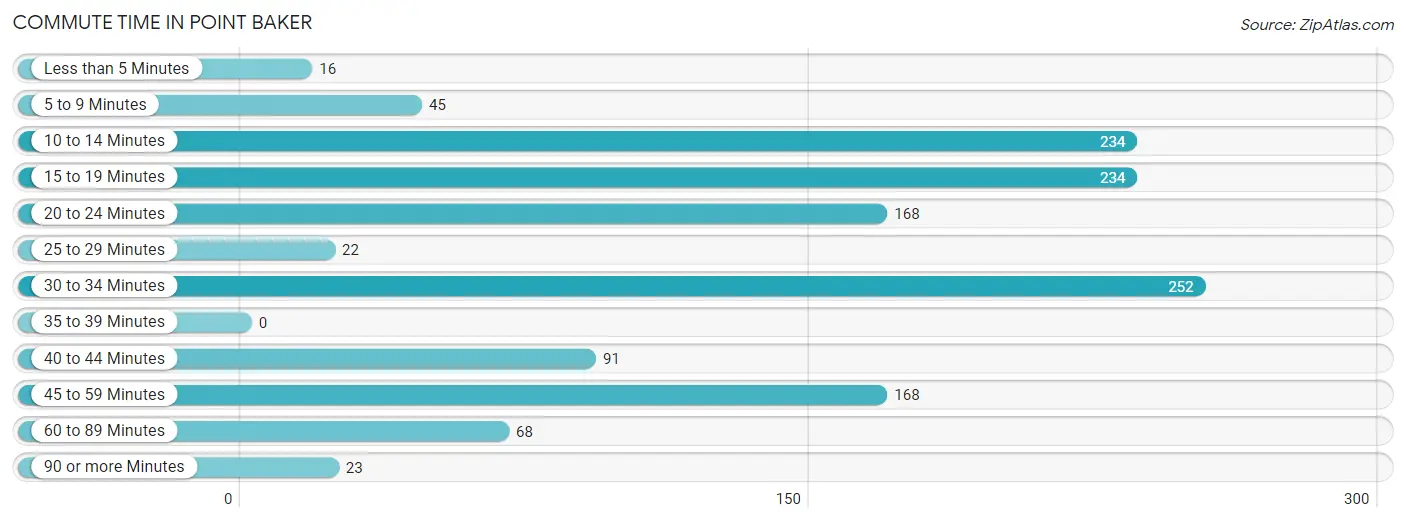
| Commute Time | # Commuters | % Commuters |
| Less than 5 Minutes | 16 | 1.2% |
| 5 to 9 Minutes | 45 | 3.4% |
| 10 to 14 Minutes | 234 | 17.7% |
| 15 to 19 Minutes | 234 | 17.7% |
| 20 to 24 Minutes | 168 | 12.7% |
| 25 to 29 Minutes | 22 | 1.7% |
| 30 to 34 Minutes | 252 | 19.1% |
| 35 to 39 Minutes | 0 | 0.0% |
| 40 to 44 Minutes | 91 | 6.9% |
| 45 to 59 Minutes | 168 | 12.7% |
| 60 to 89 Minutes | 68 | 5.1% |
| 90 or more Minutes | 23 | 1.7% |
Commute Time by Sex in Point Baker
The most common commute times in Point Baker are 30 to 34 minutes (200 commuters, 25.6%) for males and 20 to 24 minutes (159 commuters, 29.4%) for females.
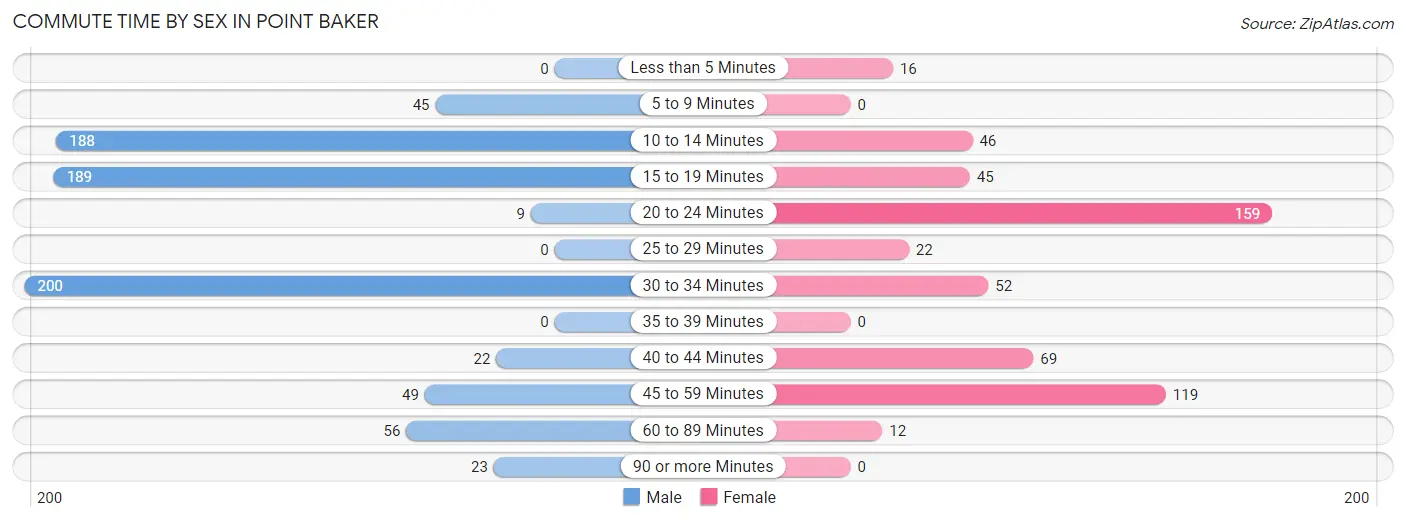
| Commute Time | Male | Female |
| Less than 5 Minutes | 0 (0.0%) | 16 (3.0%) |
| 5 to 9 Minutes | 45 (5.8%) | 0 (0.0%) |
| 10 to 14 Minutes | 188 (24.1%) | 46 (8.5%) |
| 15 to 19 Minutes | 189 (24.2%) | 45 (8.3%) |
| 20 to 24 Minutes | 9 (1.1%) | 159 (29.4%) |
| 25 to 29 Minutes | 0 (0.0%) | 22 (4.1%) |
| 30 to 34 Minutes | 200 (25.6%) | 52 (9.6%) |
| 35 to 39 Minutes | 0 (0.0%) | 0 (0.0%) |
| 40 to 44 Minutes | 22 (2.8%) | 69 (12.8%) |
| 45 to 59 Minutes | 49 (6.3%) | 119 (22.0%) |
| 60 to 89 Minutes | 56 (7.2%) | 12 (2.2%) |
| 90 or more Minutes | 23 (2.9%) | 0 (0.0%) |
Time of Departure to Work by Sex in Point Baker
The most frequent times of departure to work in Point Baker are 4:00 PM to 11:59 PM (159, 20.4%) for males and 7:30 AM to 7:59 AM (108, 20.0%) for females.
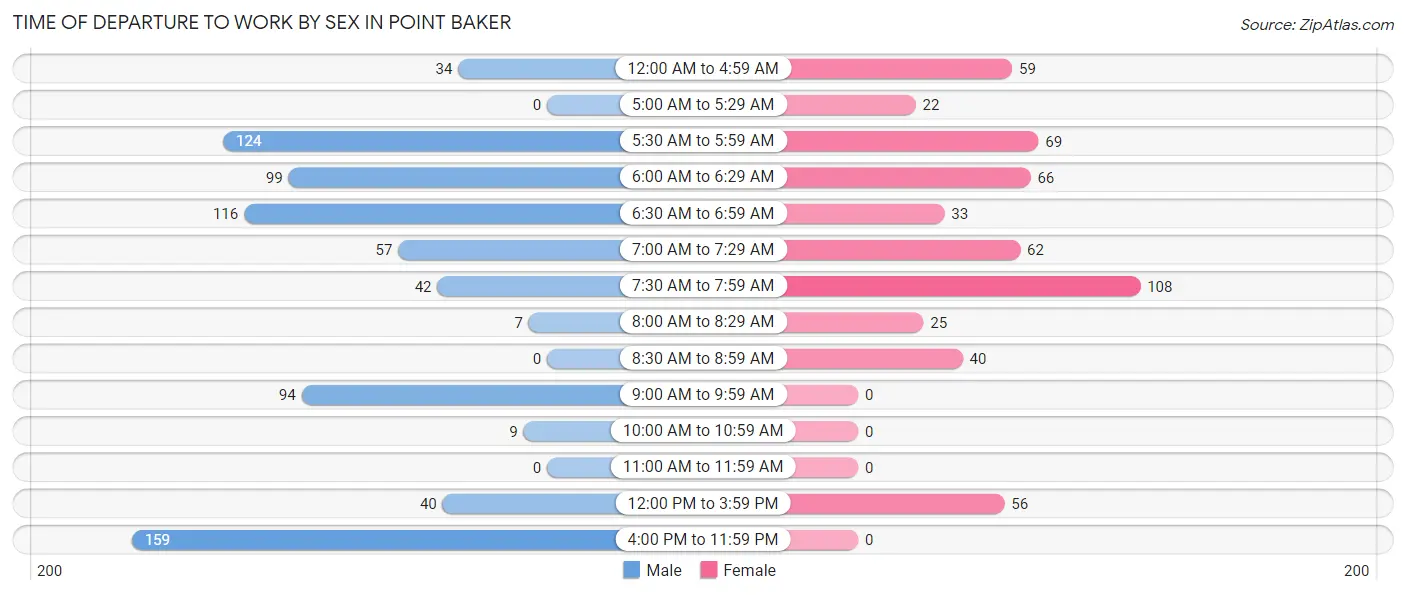
| Time of Departure | Male | Female |
| 12:00 AM to 4:59 AM | 34 (4.3%) | 59 (10.9%) |
| 5:00 AM to 5:29 AM | 0 (0.0%) | 22 (4.1%) |
| 5:30 AM to 5:59 AM | 124 (15.9%) | 69 (12.8%) |
| 6:00 AM to 6:29 AM | 99 (12.7%) | 66 (12.2%) |
| 6:30 AM to 6:59 AM | 116 (14.8%) | 33 (6.1%) |
| 7:00 AM to 7:29 AM | 57 (7.3%) | 62 (11.5%) |
| 7:30 AM to 7:59 AM | 42 (5.4%) | 108 (20.0%) |
| 8:00 AM to 8:29 AM | 7 (0.9%) | 25 (4.6%) |
| 8:30 AM to 8:59 AM | 0 (0.0%) | 40 (7.4%) |
| 9:00 AM to 9:59 AM | 94 (12.0%) | 0 (0.0%) |
| 10:00 AM to 10:59 AM | 9 (1.1%) | 0 (0.0%) |
| 11:00 AM to 11:59 AM | 0 (0.0%) | 0 (0.0%) |
| 12:00 PM to 3:59 PM | 40 (5.1%) | 56 (10.4%) |
| 4:00 PM to 11:59 PM | 159 (20.4%) | 0 (0.0%) |
| Total | 781 (100.0%) | 540 (100.0%) |
Housing Occupancy in Point Baker
Occupancy by Ownership in Point Baker
Of the total 1,263 dwellings in Point Baker, owner-occupied units account for 829 (65.6%), while renter-occupied units make up 434 (34.4%).
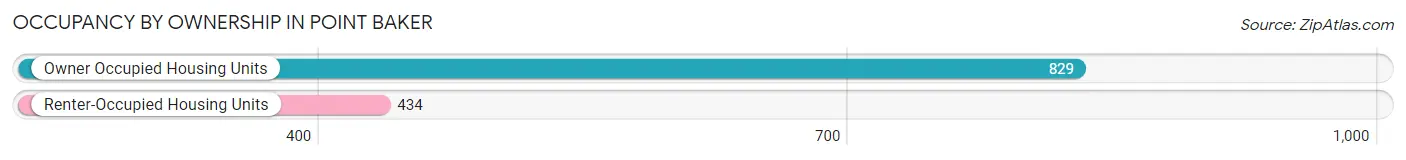
| Occupancy | # Housing Units | % Housing Units |
| Owner Occupied Housing Units | 829 | 65.6% |
| Renter-Occupied Housing Units | 434 | 34.4% |
| Total Occupied Housing Units | 1,263 | 100.0% |
Occupancy by Household Size in Point Baker
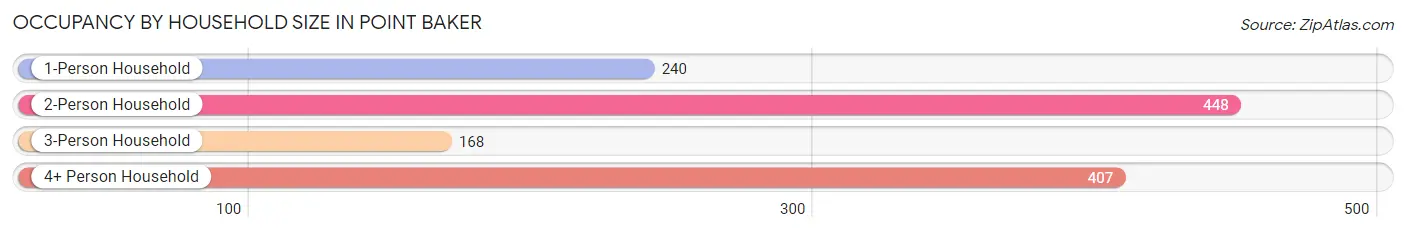
| Household Size | # Housing Units | % Housing Units |
| 1-Person Household | 240 | 19.0% |
| 2-Person Household | 448 | 35.5% |
| 3-Person Household | 168 | 13.3% |
| 4+ Person Household | 407 | 32.2% |
| Total Housing Units | 1,263 | 100.0% |
Occupancy by Ownership by Household Size in Point Baker
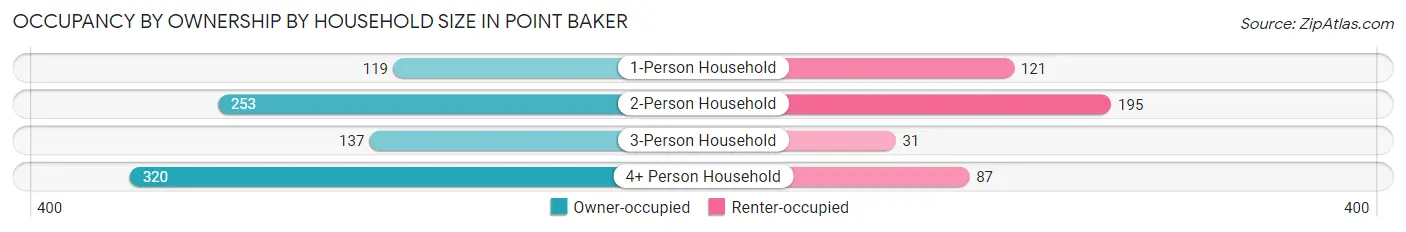
| Household Size | Owner-occupied | Renter-occupied |
| 1-Person Household | 119 (49.6%) | 121 (50.4%) |
| 2-Person Household | 253 (56.5%) | 195 (43.5%) |
| 3-Person Household | 137 (81.6%) | 31 (18.4%) |
| 4+ Person Household | 320 (78.6%) | 87 (21.4%) |
| Total Housing Units | 829 (65.6%) | 434 (34.4%) |
Occupancy by Educational Attainment in Point Baker
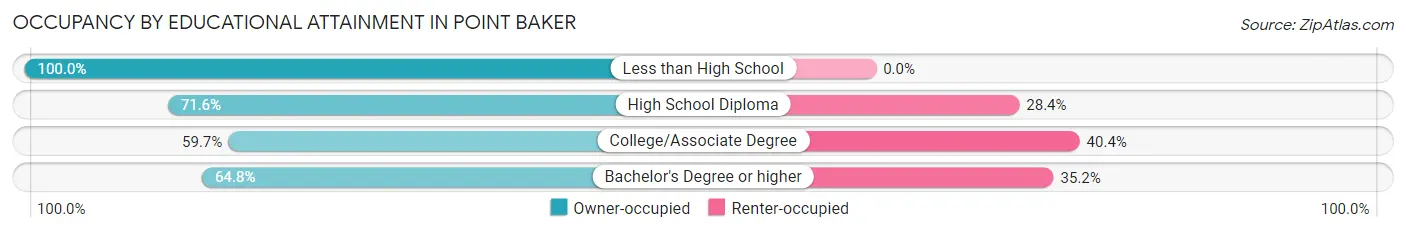
| Household Size | Owner-occupied | Renter-occupied |
| Less than High School | 44 (100.0%) | 0 (0.0%) |
| High School Diploma | 285 (71.6%) | 113 (28.4%) |
| College/Associate Degree | 371 (59.7%) | 251 (40.4%) |
| Bachelor's Degree or higher | 129 (64.8%) | 70 (35.2%) |
Occupancy by Age of Householder in Point Baker
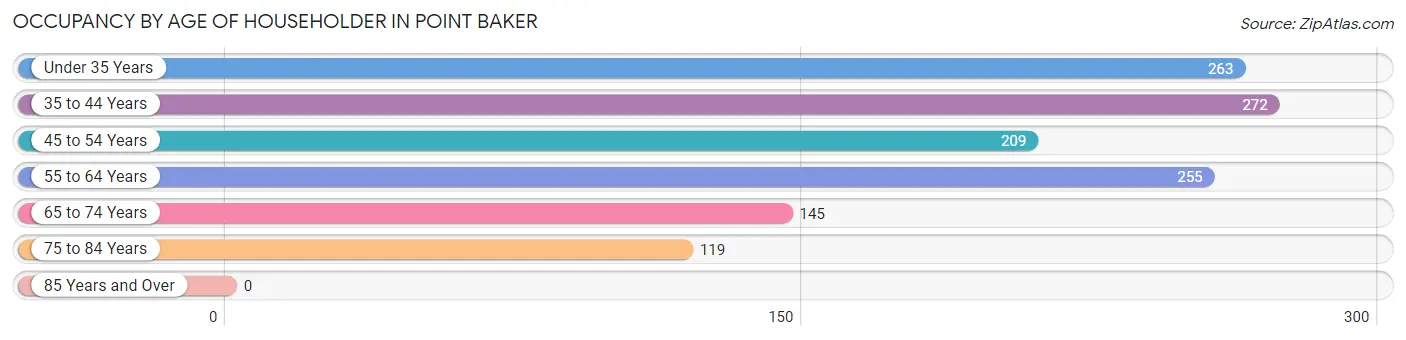
| Age Bracket | # Households | % Households |
| Under 35 Years | 263 | 20.8% |
| 35 to 44 Years | 272 | 21.5% |
| 45 to 54 Years | 209 | 16.6% |
| 55 to 64 Years | 255 | 20.2% |
| 65 to 74 Years | 145 | 11.5% |
| 75 to 84 Years | 119 | 9.4% |
| 85 Years and Over | 0 | 0.0% |
| Total | 1,263 | 100.0% |
Housing Finances in Point Baker
Median Income by Occupancy in Point Baker
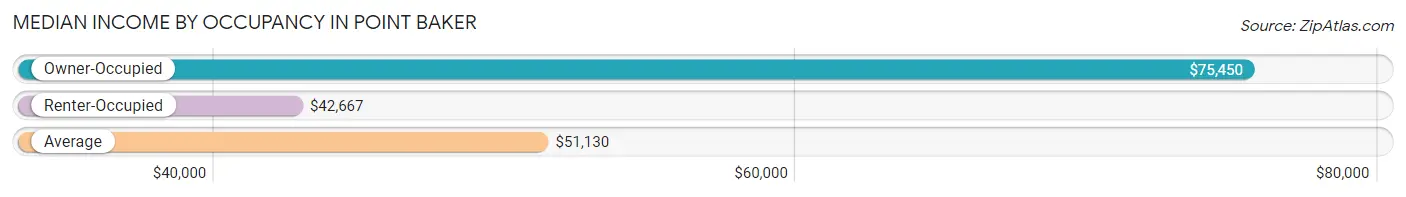
| Occupancy Type | # Households | Median Income |
| Owner-Occupied | 829 (65.6%) | $75,450 |
| Renter-Occupied | 434 (34.4%) | $42,667 |
| Average | 1,263 (100.0%) | $51,130 |
Occupancy by Householder Income Bracket in Point Baker
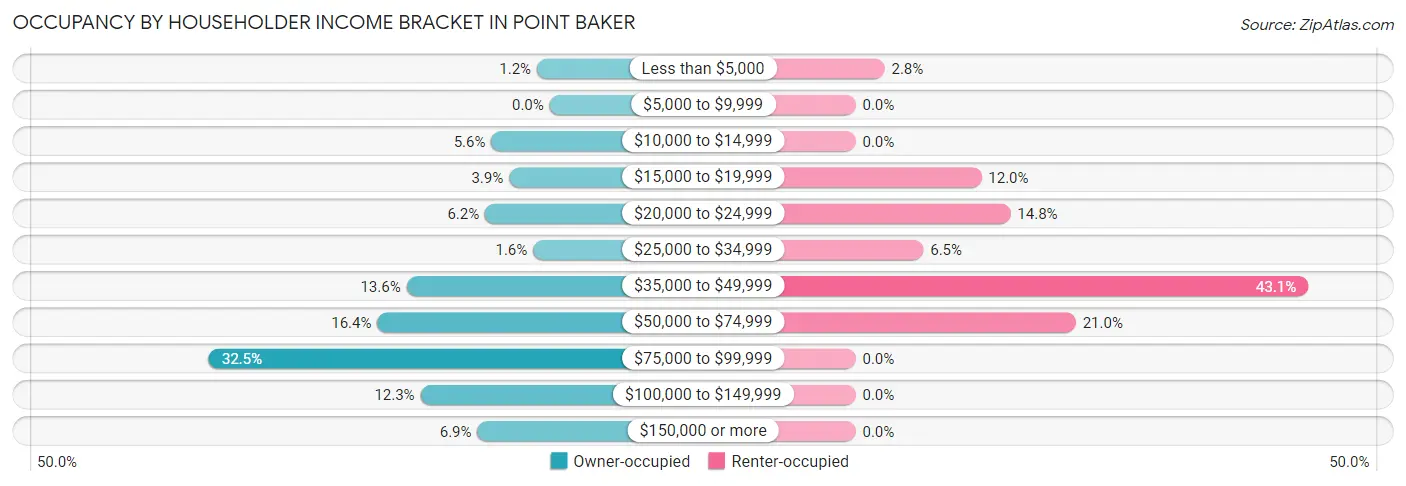
| Income Bracket | Owner-occupied | Renter-occupied |
| Less than $5,000 | 10 (1.2%) | 12 (2.8%) |
| $5,000 to $9,999 | 0 (0.0%) | 0 (0.0%) |
| $10,000 to $14,999 | 46 (5.6%) | 0 (0.0%) |
| $15,000 to $19,999 | 32 (3.9%) | 52 (12.0%) |
| $20,000 to $24,999 | 51 (6.1%) | 64 (14.7%) |
| $25,000 to $34,999 | 13 (1.6%) | 28 (6.5%) |
| $35,000 to $49,999 | 113 (13.6%) | 187 (43.1%) |
| $50,000 to $74,999 | 136 (16.4%) | 91 (21.0%) |
| $75,000 to $99,999 | 269 (32.5%) | 0 (0.0%) |
| $100,000 to $149,999 | 102 (12.3%) | 0 (0.0%) |
| $150,000 or more | 57 (6.9%) | 0 (0.0%) |
| Total | 829 (100.0%) | 434 (100.0%) |
Monthly Housing Cost Tiers in Point Baker
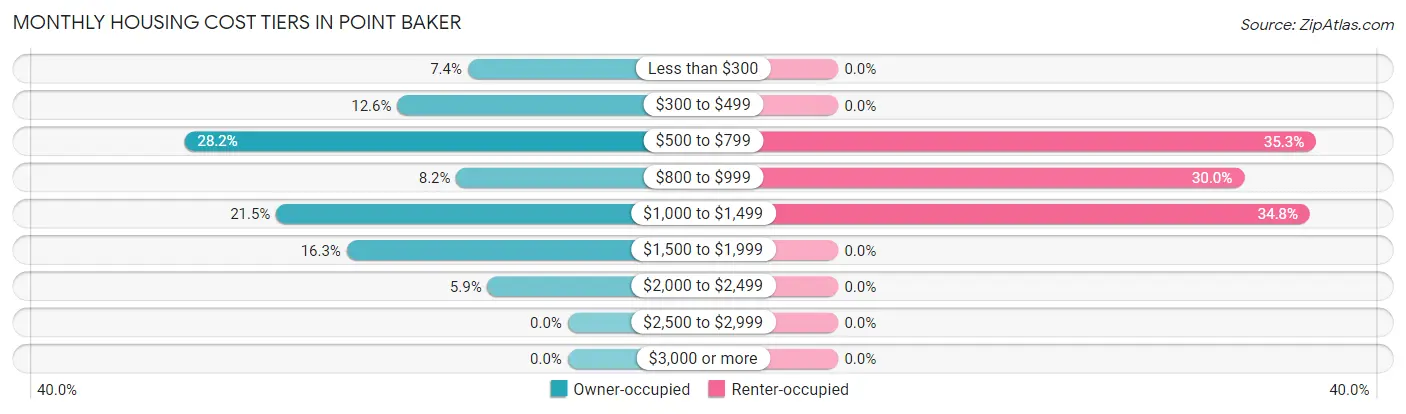
| Monthly Cost | Owner-occupied | Renter-occupied |
| Less than $300 | 61 (7.4%) | 0 (0.0%) |
| $300 to $499 | 104 (12.6%) | 0 (0.0%) |
| $500 to $799 | 234 (28.2%) | 153 (35.2%) |
| $800 to $999 | 68 (8.2%) | 130 (29.9%) |
| $1,000 to $1,499 | 178 (21.5%) | 151 (34.8%) |
| $1,500 to $1,999 | 135 (16.3%) | 0 (0.0%) |
| $2,000 to $2,499 | 49 (5.9%) | 0 (0.0%) |
| $2,500 to $2,999 | 0 (0.0%) | 0 (0.0%) |
| $3,000 or more | 0 (0.0%) | 0 (0.0%) |
| Total | 829 (100.0%) | 434 (100.0%) |
Physical Housing Characteristics in Point Baker
Housing Structures in Point Baker
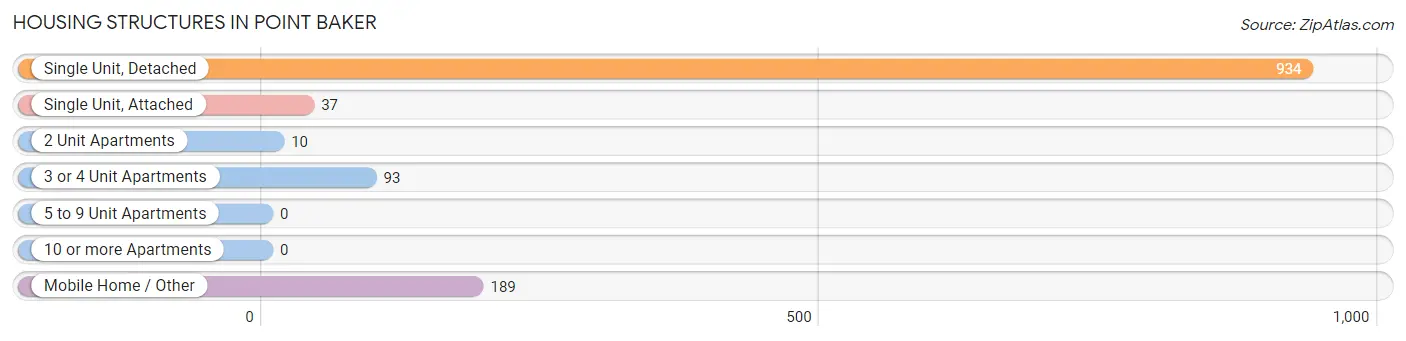
| Structure Type | # Housing Units | % Housing Units |
| Single Unit, Detached | 934 | 74.0% |
| Single Unit, Attached | 37 | 2.9% |
| 2 Unit Apartments | 10 | 0.8% |
| 3 or 4 Unit Apartments | 93 | 7.4% |
| 5 to 9 Unit Apartments | 0 | 0.0% |
| 10 or more Apartments | 0 | 0.0% |
| Mobile Home / Other | 189 | 15.0% |
| Total | 1,263 | 100.0% |
Housing Structures by Occupancy in Point Baker
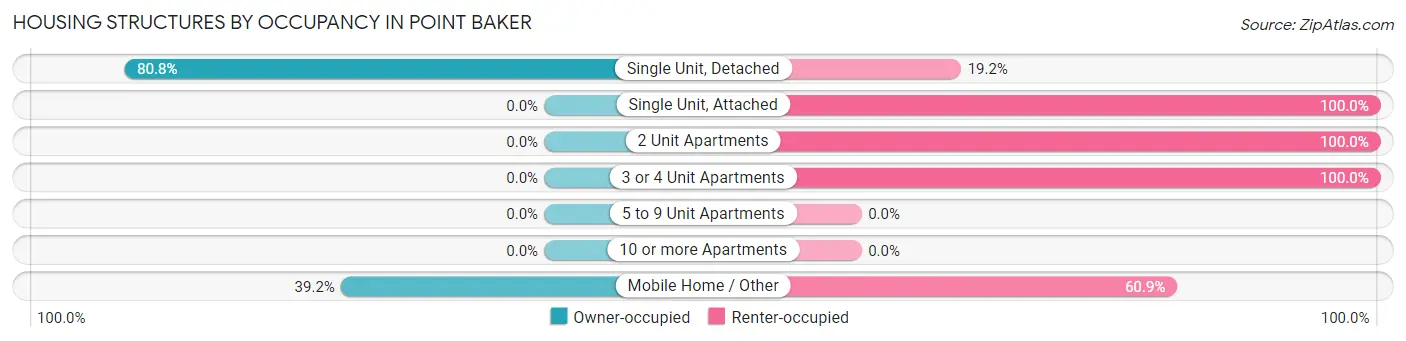
| Structure Type | Owner-occupied | Renter-occupied |
| Single Unit, Detached | 755 (80.8%) | 179 (19.2%) |
| Single Unit, Attached | 0 (0.0%) | 37 (100.0%) |
| 2 Unit Apartments | 0 (0.0%) | 10 (100.0%) |
| 3 or 4 Unit Apartments | 0 (0.0%) | 93 (100.0%) |
| 5 to 9 Unit Apartments | 0 (0.0%) | 0 (0.0%) |
| 10 or more Apartments | 0 (0.0%) | 0 (0.0%) |
| Mobile Home / Other | 74 (39.2%) | 115 (60.9%) |
| Total | 829 (65.6%) | 434 (34.4%) |
Housing Structures by Number of Rooms in Point Baker
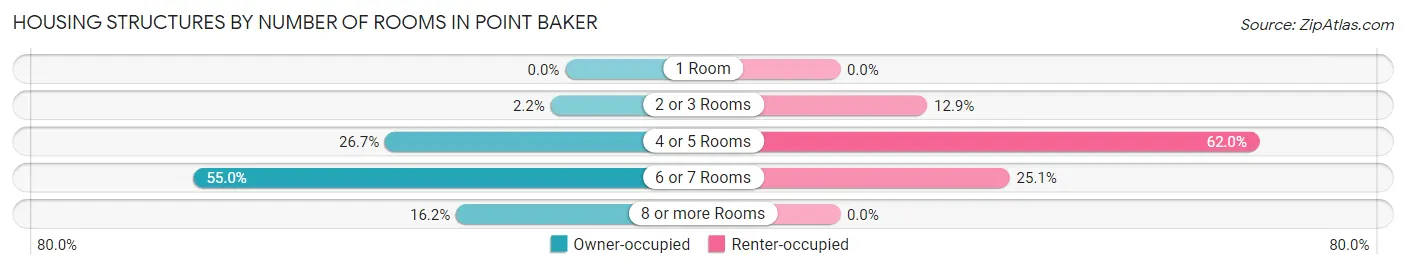
| Number of Rooms | Owner-occupied | Renter-occupied |
| 1 Room | 0 (0.0%) | 0 (0.0%) |
| 2 or 3 Rooms | 18 (2.2%) | 56 (12.9%) |
| 4 or 5 Rooms | 221 (26.7%) | 269 (62.0%) |
| 6 or 7 Rooms | 456 (55.0%) | 109 (25.1%) |
| 8 or more Rooms | 134 (16.2%) | 0 (0.0%) |
| Total | 829 (100.0%) | 434 (100.0%) |
Housing Structure by Heating Type in Point Baker
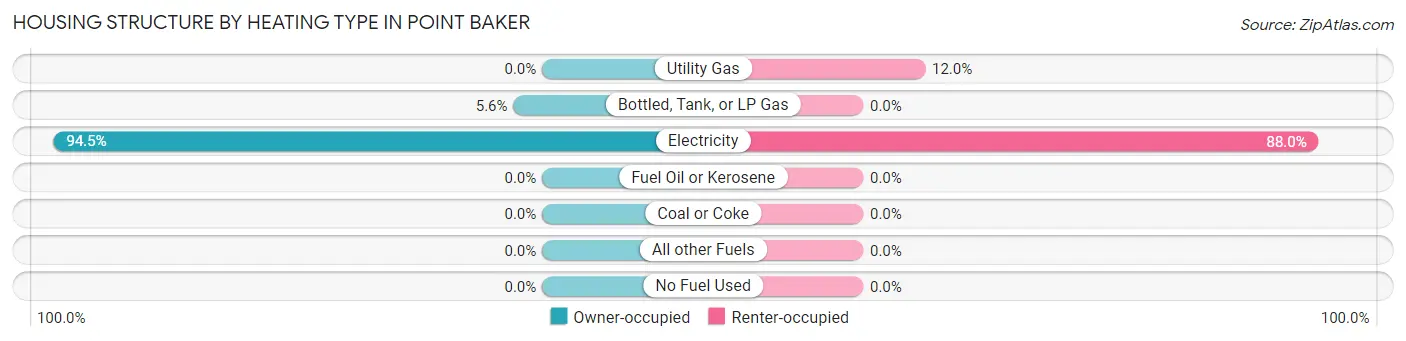
| Heating Type | Owner-occupied | Renter-occupied |
| Utility Gas | 0 (0.0%) | 52 (12.0%) |
| Bottled, Tank, or LP Gas | 46 (5.6%) | 0 (0.0%) |
| Electricity | 783 (94.5%) | 382 (88.0%) |
| Fuel Oil or Kerosene | 0 (0.0%) | 0 (0.0%) |
| Coal or Coke | 0 (0.0%) | 0 (0.0%) |
| All other Fuels | 0 (0.0%) | 0 (0.0%) |
| No Fuel Used | 0 (0.0%) | 0 (0.0%) |
| Total | 829 (100.0%) | 434 (100.0%) |
Household Vehicle Usage in Point Baker
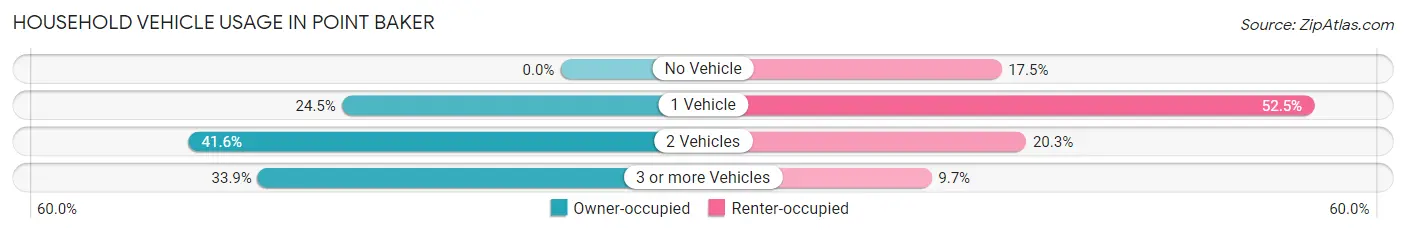
| Vehicles per Household | Owner-occupied | Renter-occupied |
| No Vehicle | 0 (0.0%) | 76 (17.5%) |
| 1 Vehicle | 203 (24.5%) | 228 (52.5%) |
| 2 Vehicles | 345 (41.6%) | 88 (20.3%) |
| 3 or more Vehicles | 281 (33.9%) | 42 (9.7%) |
| Total | 829 (100.0%) | 434 (100.0%) |
Real Estate & Mortgages in Point Baker
Real Estate and Mortgage Overview in Point Baker
| Characteristic | Without Mortgage | With Mortgage |
| Housing Units | 340 | 489 |
| Median Property Value | $219,300 | $192,300 |
| Median Household Income | $70,938 | $48 |
| Monthly Housing Costs | $511 | $0 |
| Real Estate Taxes | $1,321 | $22 |
Property Value by Mortgage Status in Point Baker
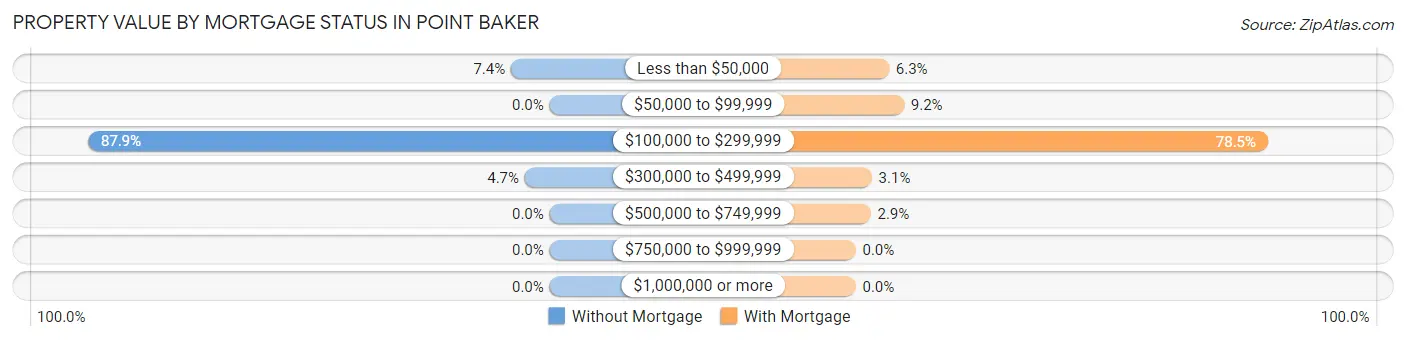
| Property Value | Without Mortgage | With Mortgage |
| Less than $50,000 | 25 (7.3%) | 31 (6.3%) |
| $50,000 to $99,999 | 0 (0.0%) | 45 (9.2%) |
| $100,000 to $299,999 | 299 (87.9%) | 384 (78.5%) |
| $300,000 to $499,999 | 16 (4.7%) | 15 (3.1%) |
| $500,000 to $749,999 | 0 (0.0%) | 14 (2.9%) |
| $750,000 to $999,999 | 0 (0.0%) | 0 (0.0%) |
| $1,000,000 or more | 0 (0.0%) | 0 (0.0%) |
| Total | 340 (100.0%) | 489 (100.0%) |
Household Income by Mortgage Status in Point Baker
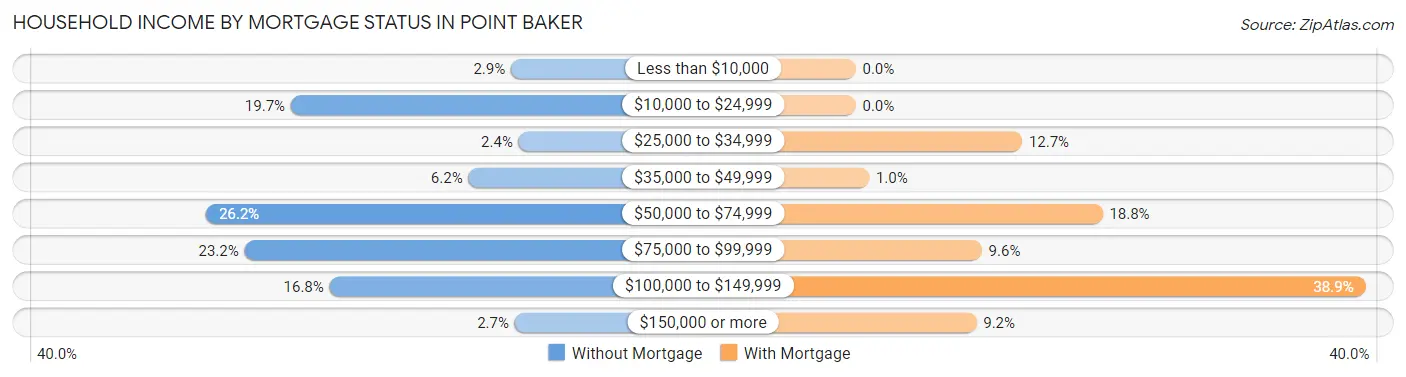
| Household Income | Without Mortgage | With Mortgage |
| Less than $10,000 | 10 (2.9%) | 0 (0.0%) |
| $10,000 to $24,999 | 67 (19.7%) | 0 (0.0%) |
| $25,000 to $34,999 | 8 (2.4%) | 62 (12.7%) |
| $35,000 to $49,999 | 21 (6.2%) | 5 (1.0%) |
| $50,000 to $74,999 | 89 (26.2%) | 92 (18.8%) |
| $75,000 to $99,999 | 79 (23.2%) | 47 (9.6%) |
| $100,000 to $149,999 | 57 (16.8%) | 190 (38.9%) |
| $150,000 or more | 9 (2.6%) | 45 (9.2%) |
| Total | 340 (100.0%) | 489 (100.0%) |
Property Value to Household Income Ratio in Point Baker
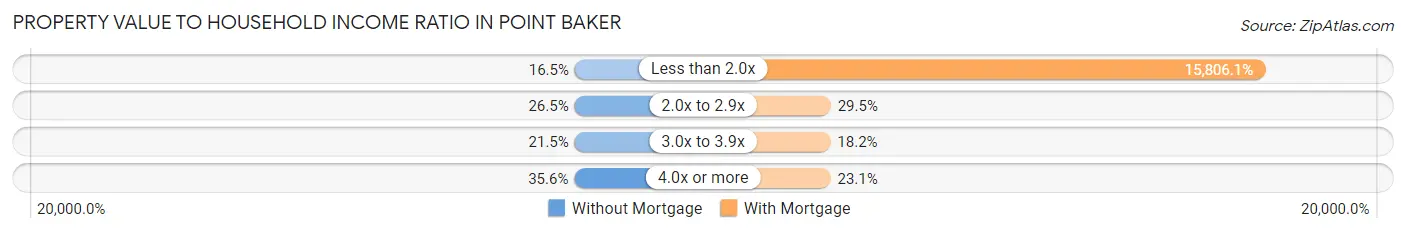
| Value-to-Income Ratio | Without Mortgage | With Mortgage |
| Less than 2.0x | 56 (16.5%) | 77,292 (15,806.1%) |
| 2.0x to 2.9x | 90 (26.5%) | 144 (29.4%) |
| 3.0x to 3.9x | 73 (21.5%) | 89 (18.2%) |
| 4.0x or more | 121 (35.6%) | 113 (23.1%) |
| Total | 340 (100.0%) | 489 (100.0%) |
Real Estate Taxes by Mortgage Status in Point Baker
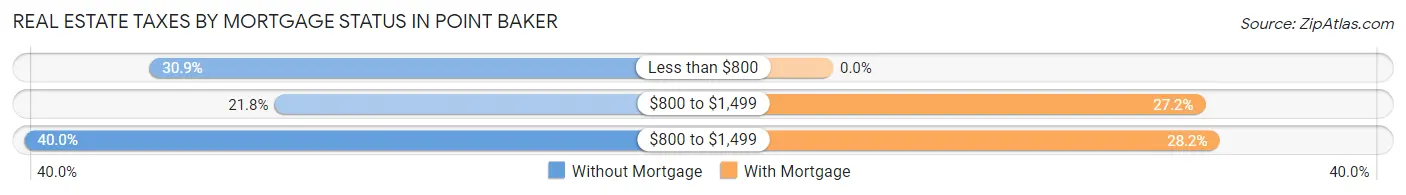
| Property Taxes | Without Mortgage | With Mortgage |
| Less than $800 | 105 (30.9%) | 0 (0.0%) |
| $800 to $1,499 | 74 (21.8%) | 133 (27.2%) |
| $800 to $1,499 | 136 (40.0%) | 138 (28.2%) |
| Total | 340 (100.0%) | 489 (100.0%) |
Health & Disability in Point Baker
Health Insurance Coverage by Age in Point Baker
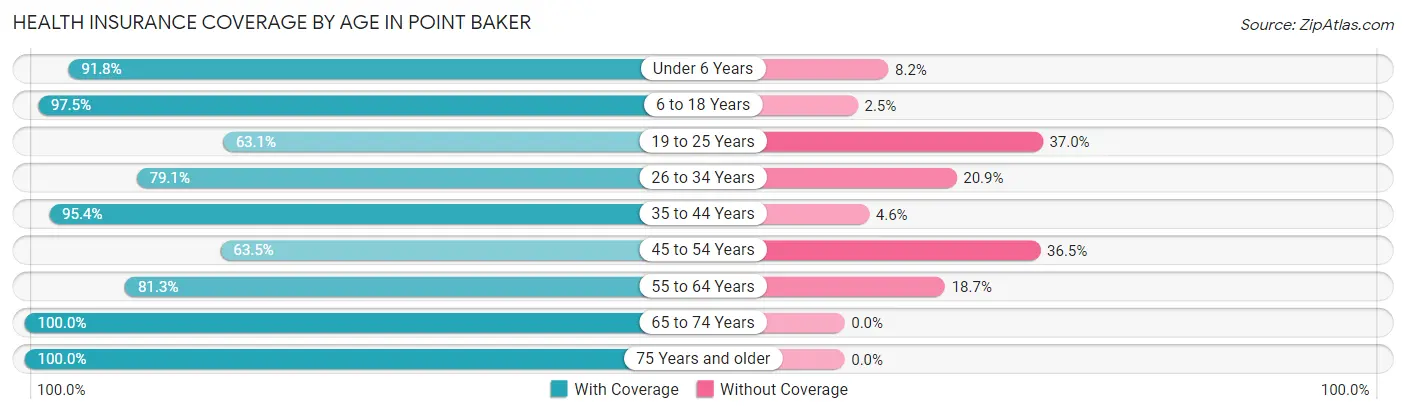
| Age Bracket | With Coverage | Without Coverage |
| Under 6 Years | 236 (91.8%) | 21 (8.2%) |
| 6 to 18 Years | 553 (97.5%) | 14 (2.5%) |
| 19 to 25 Years | 186 (63.0%) | 109 (36.9%) |
| 26 to 34 Years | 682 (79.1%) | 180 (20.9%) |
| 35 to 44 Years | 333 (95.4%) | 16 (4.6%) |
| 45 to 54 Years | 266 (63.5%) | 153 (36.5%) |
| 55 to 64 Years | 321 (81.3%) | 74 (18.7%) |
| 65 to 74 Years | 200 (100.0%) | 0 (0.0%) |
| 75 Years and older | 238 (100.0%) | 0 (0.0%) |
| Total | 3,015 (84.2%) | 567 (15.8%) |
Health Insurance Coverage by Citizenship Status in Point Baker
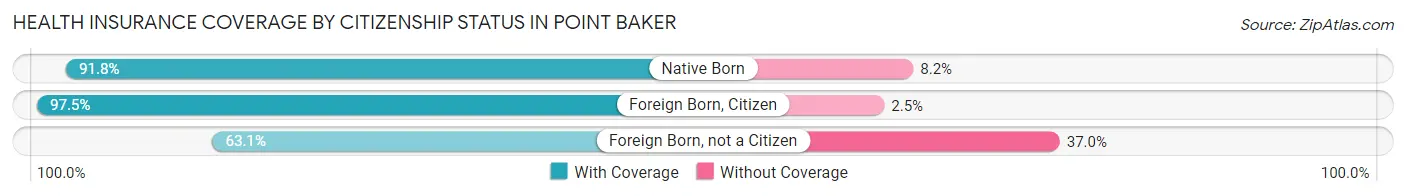
| Citizenship Status | With Coverage | Without Coverage |
| Native Born | 236 (91.8%) | 21 (8.2%) |
| Foreign Born, Citizen | 553 (97.5%) | 14 (2.5%) |
| Foreign Born, not a Citizen | 186 (63.0%) | 109 (36.9%) |
Health Insurance Coverage by Household Income in Point Baker
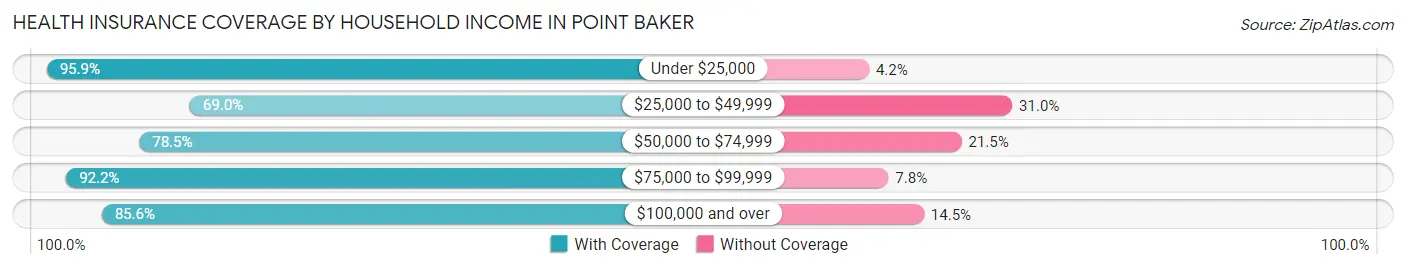
| Household Income | With Coverage | Without Coverage |
| Under $25,000 | 647 (95.9%) | 28 (4.2%) |
| $25,000 to $49,999 | 450 (69.0%) | 202 (31.0%) |
| $50,000 to $74,999 | 723 (78.5%) | 198 (21.5%) |
| $75,000 to $99,999 | 745 (92.2%) | 63 (7.8%) |
| $100,000 and over | 450 (85.6%) | 76 (14.4%) |
Public vs Private Health Insurance Coverage by Age in Point Baker
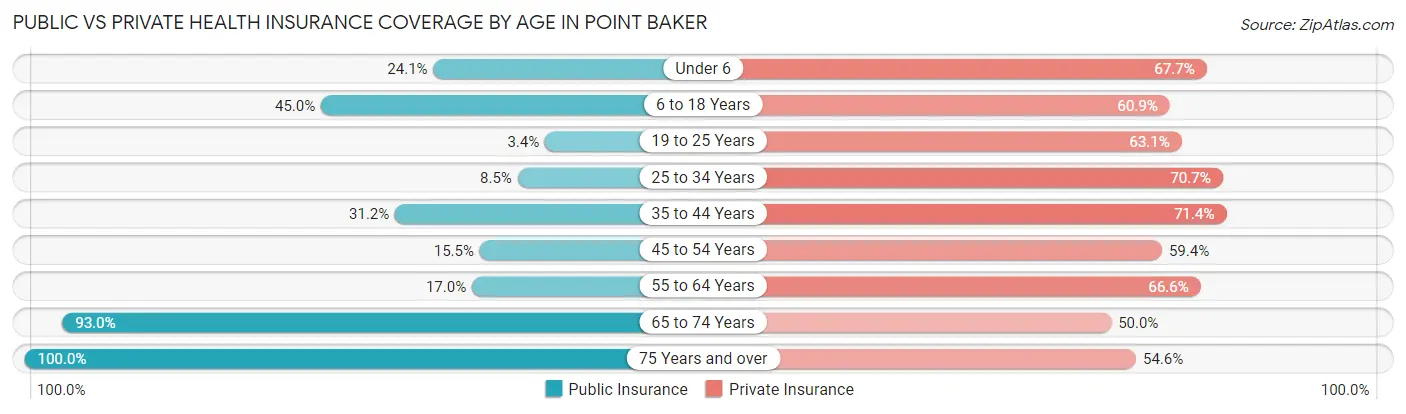
| Age Bracket | Public Insurance | Private Insurance |
| Under 6 | 62 (24.1%) | 174 (67.7%) |
| 6 to 18 Years | 255 (45.0%) | 345 (60.9%) |
| 19 to 25 Years | 10 (3.4%) | 186 (63.0%) |
| 25 to 34 Years | 73 (8.5%) | 609 (70.7%) |
| 35 to 44 Years | 109 (31.2%) | 249 (71.4%) |
| 45 to 54 Years | 65 (15.5%) | 249 (59.4%) |
| 55 to 64 Years | 67 (17.0%) | 263 (66.6%) |
| 65 to 74 Years | 186 (93.0%) | 100 (50.0%) |
| 75 Years and over | 238 (100.0%) | 130 (54.6%) |
| Total | 1,065 (29.7%) | 2,305 (64.3%) |
Disability Status by Sex by Age in Point Baker
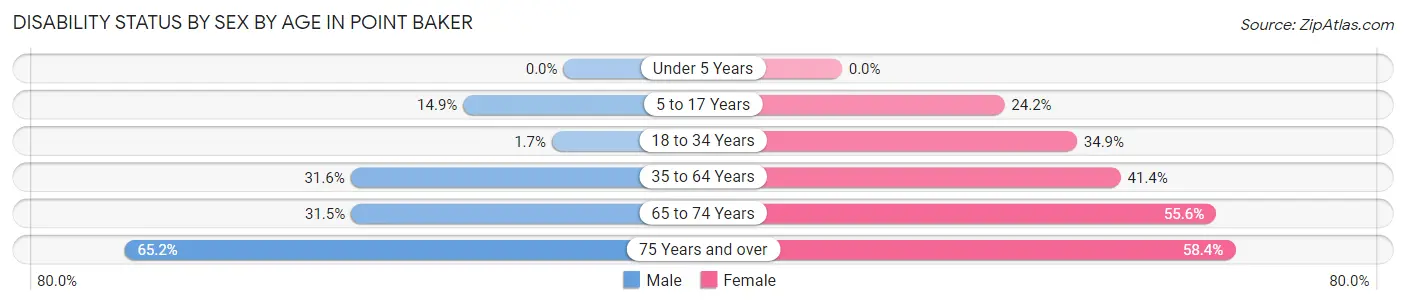
| Age Bracket | Male | Female |
| Under 5 Years | 0 (0.0%) | 0 (0.0%) |
| 5 to 17 Years | 43 (14.9%) | 71 (24.1%) |
| 18 to 34 Years | 12 (1.7%) | 177 (34.9%) |
| 35 to 64 Years | 147 (31.6%) | 289 (41.4%) |
| 65 to 74 Years | 29 (31.5%) | 60 (55.6%) |
| 75 Years and over | 58 (65.2%) | 87 (58.4%) |
Disability Class by Sex by Age in Point Baker
Disability Class: Hearing Difficulty
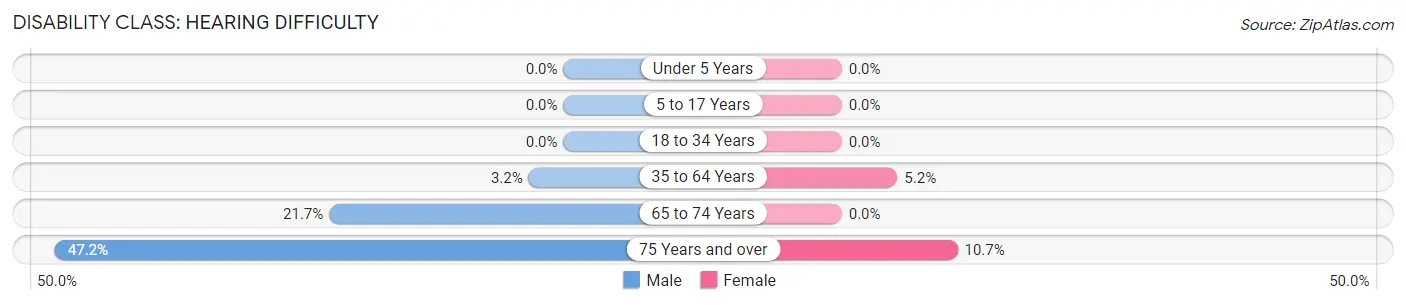
| Age Bracket | Male | Female |
| Under 5 Years | 0 (0.0%) | 0 (0.0%) |
| 5 to 17 Years | 0 (0.0%) | 0 (0.0%) |
| 18 to 34 Years | 0 (0.0%) | 0 (0.0%) |
| 35 to 64 Years | 15 (3.2%) | 36 (5.2%) |
| 65 to 74 Years | 20 (21.7%) | 0 (0.0%) |
| 75 Years and over | 42 (47.2%) | 16 (10.7%) |
Disability Class: Vision Difficulty
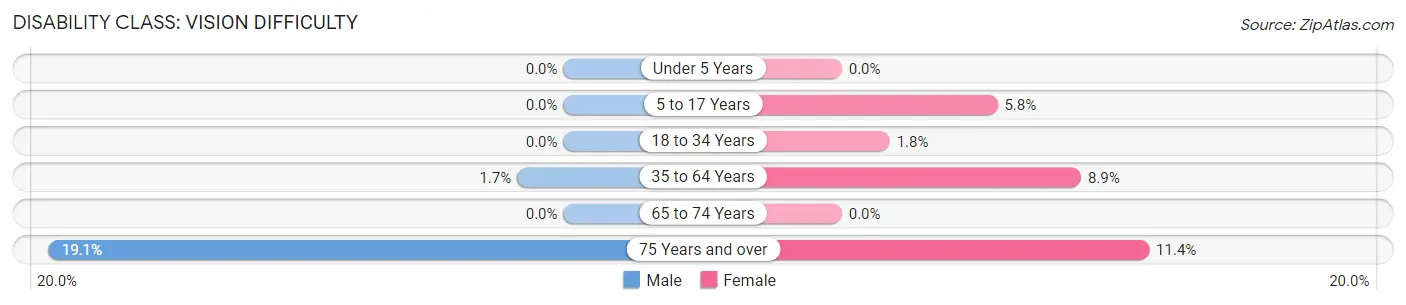
| Age Bracket | Male | Female |
| Under 5 Years | 0 (0.0%) | 0 (0.0%) |
| 5 to 17 Years | 0 (0.0%) | 17 (5.8%) |
| 18 to 34 Years | 0 (0.0%) | 9 (1.8%) |
| 35 to 64 Years | 8 (1.7%) | 62 (8.9%) |
| 65 to 74 Years | 0 (0.0%) | 0 (0.0%) |
| 75 Years and over | 17 (19.1%) | 17 (11.4%) |
Disability Class: Cognitive Difficulty
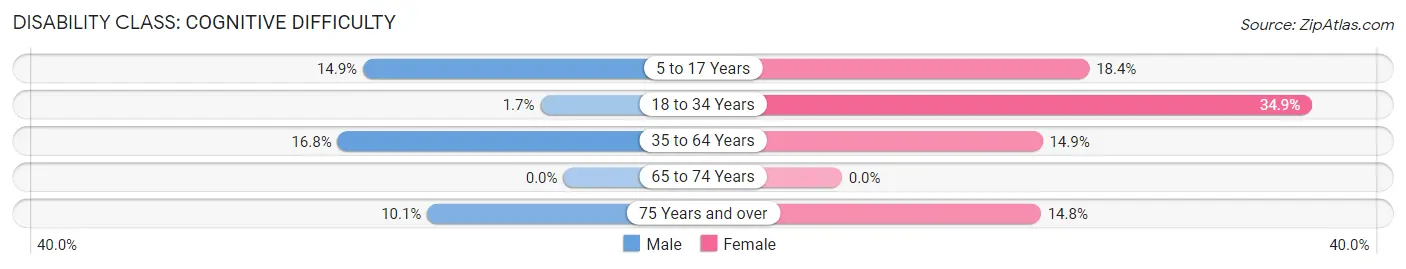
| Age Bracket | Male | Female |
| 5 to 17 Years | 43 (14.9%) | 54 (18.4%) |
| 18 to 34 Years | 12 (1.7%) | 177 (34.9%) |
| 35 to 64 Years | 78 (16.8%) | 104 (14.9%) |
| 65 to 74 Years | 0 (0.0%) | 0 (0.0%) |
| 75 Years and over | 9 (10.1%) | 22 (14.8%) |
Disability Class: Ambulatory Difficulty
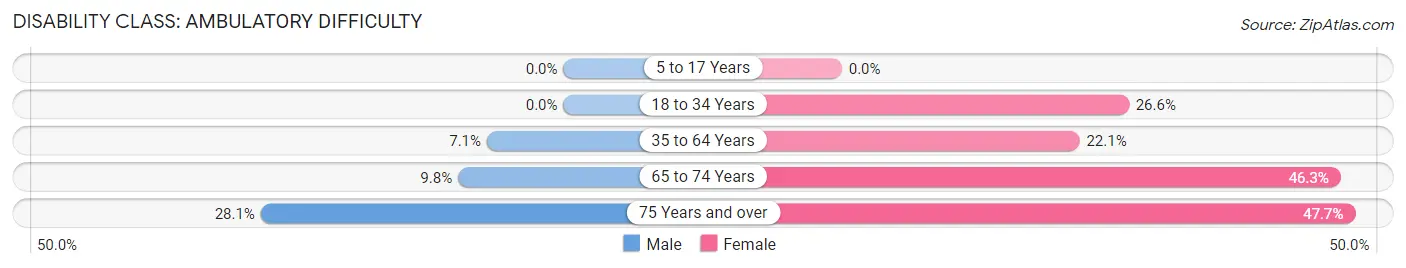
| Age Bracket | Male | Female |
| 5 to 17 Years | 0 (0.0%) | 0 (0.0%) |
| 18 to 34 Years | 0 (0.0%) | 135 (26.6%) |
| 35 to 64 Years | 33 (7.1%) | 154 (22.1%) |
| 65 to 74 Years | 9 (9.8%) | 50 (46.3%) |
| 75 Years and over | 25 (28.1%) | 71 (47.6%) |
Disability Class: Self-Care Difficulty
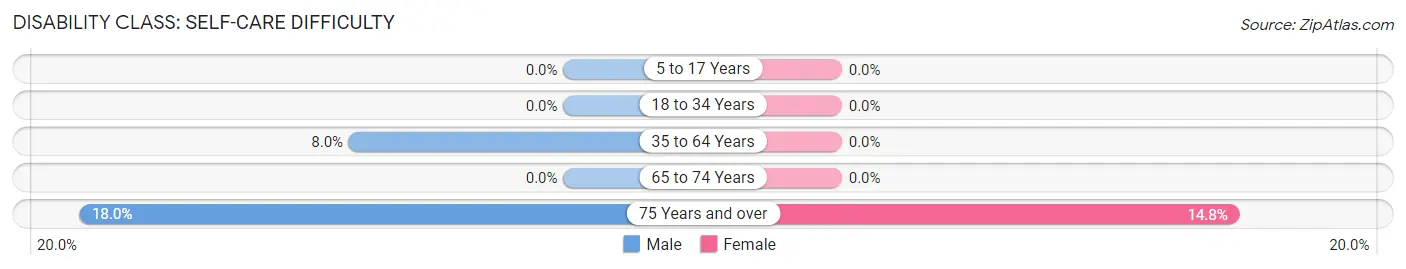
| Age Bracket | Male | Female |
| 5 to 17 Years | 0 (0.0%) | 0 (0.0%) |
| 18 to 34 Years | 0 (0.0%) | 0 (0.0%) |
| 35 to 64 Years | 37 (8.0%) | 0 (0.0%) |
| 65 to 74 Years | 0 (0.0%) | 0 (0.0%) |
| 75 Years and over | 16 (18.0%) | 22 (14.8%) |
Technology Access in Point Baker
Computing Device Access in Point Baker
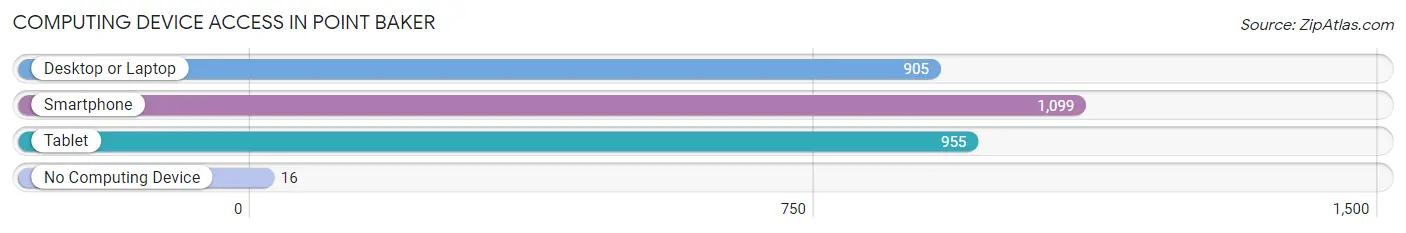
| Device Type | # Households | % Households |
| Desktop or Laptop | 905 | 71.7% |
| Smartphone | 1,099 | 87.0% |
| Tablet | 955 | 75.6% |
| No Computing Device | 16 | 1.3% |
| Total | 1,263 | 100.0% |
Internet Access in Point Baker
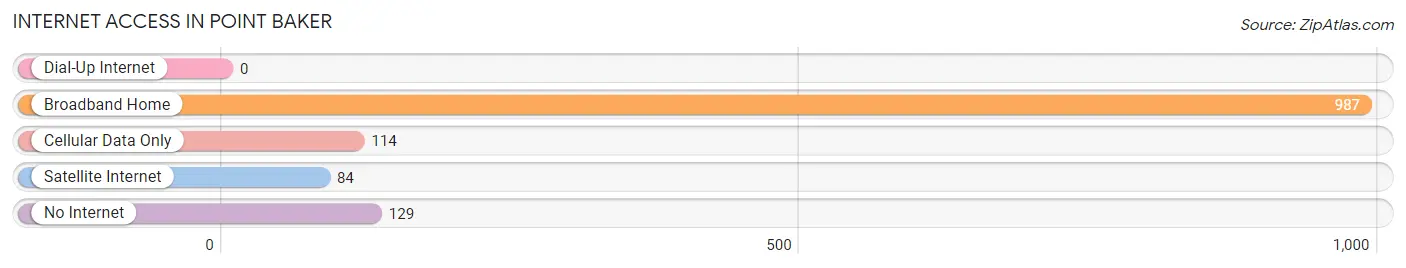
| Internet Type | # Households | % Households |
| Dial-Up Internet | 0 | 0.0% |
| Broadband Home | 987 | 78.1% |
| Cellular Data Only | 114 | 9.0% |
| Satellite Internet | 84 | 6.7% |
| No Internet | 129 | 10.2% |
| Total | 1,263 | 100.0% |
Point Baker Summary
Baker is a small unincorporated community located in Okaloosa County, Florida. It is situated on the western edge of the Florida Panhandle, approximately 20 miles east of Pensacola and 30 miles west of Panama City. The community is named after the Baker family, who settled in the area in the late 19th century.
History
The area that is now known as Baker was originally inhabited by Native American tribes, including the Choctaw and Creek. The first European settlers arrived in the area in the early 19th century, and the community was officially established in 1885. The Baker family, who had moved to the area from Georgia, were among the first settlers. The family established a general store and post office, which served as the center of the community.
In the early 20th century, the area began to grow as more settlers moved to the area. The community was incorporated in 1925, and the first mayor was elected in 1926. The town was named after the Baker family, who had been instrumental in its development.
Geography
Baker is located in Okaloosa County, Florida, on the western edge of the Florida Panhandle. It is situated approximately 20 miles east of Pensacola and 30 miles west of Panama City. The community is located on the banks of the Shoal River, which flows through the area. The area is mostly flat, with some rolling hills in the surrounding area.
The climate in Baker is humid subtropical, with hot, humid summers and mild winters. The average temperature in the summer is around 90°F, and the average temperature in the winter is around 50°F. The area receives an average of 54 inches of rain per year.
Economy
The economy of Baker is largely based on agriculture and tourism. The area is home to several farms, which produce a variety of crops, including corn, soybeans, and cotton. The area is also home to several tourist attractions, including the Gulf Islands National Seashore and the Eglin Air Force Base.
The area is also home to several businesses, including restaurants, retail stores, and service providers. The community is served by the Okaloosa County School District, which operates several schools in the area.
Demographics
As of the 2010 census, the population of Baker was 1,845. The racial makeup of the community was 79.3% White, 15.2% African American, 0.7% Native American, 0.7% Asian, 0.1% Pacific Islander, and 3.9% from other races. The median household income was $37,917, and the median family income was $45,938.
Conclusion
Baker is a small unincorporated community located in Okaloosa County, Florida. It is situated on the western edge of the Florida Panhandle, approximately 20 miles east of Pensacola and 30 miles west of Panama City. The community is named after the Baker family, who settled in the area in the late 19th century. The economy of Baker is largely based on agriculture and tourism, and the area is home to several businesses, including restaurants, retail stores, and service providers. As of the 2010 census, the population of Baker was 1,845, and the racial makeup of the community was 79.3% White, 15.2% African American, 0.7% Native American, 0.7% Asian, 0.1% Pacific Islander, and 3.9% from other races.
Common Questions
What is Per Capita Income in Point Baker?
Per Capita income in Point Baker is $24,310.
What is the Median Family Income in Point Baker?
Median Family Income in Point Baker is $70,882.
What is the Median Household income in Point Baker?
Median Household Income in Point Baker is $51,130.
What is Income or Wage Gap in Point Baker?
Income or Wage Gap in Point Baker is 34.3%.
Women in Point Baker earn 65.7 cents for every dollar earned by a man.
What is Family Income Deficit in Point Baker?
Family Income Deficit in Point Baker is $6,962.
Families that are below poverty line in Point Baker earn $6,962 less on average than the poverty threshold level.
What is Inequality or Gini Index in Point Baker?
Inequality or Gini Index in Point Baker is 0.35.
What is the Total Population of Point Baker?
Total Population of Point Baker is 3,591.
What is the Total Male Population of Point Baker?
Total Male Population of Point Baker is 1,779.
What is the Total Female Population of Point Baker?
Total Female Population of Point Baker is 1,812.
What is the Ratio of Males per 100 Females in Point Baker?
There are 98.18 Males per 100 Females in Point Baker.
What is the Ratio of Females per 100 Males in Point Baker?
There are 101.85 Females per 100 Males in Point Baker.
What is the Median Population Age in Point Baker?
Median Population Age in Point Baker is 32.6 Years.
What is the Average Family Size in Point Baker
Average Family Size in Point Baker is 3.2 People.
What is the Average Household Size in Point Baker
Average Household Size in Point Baker is 2.8 People.
How Large is the Labor Force in Point Baker?
There are 1,854 People in the Labor Forcein in Point Baker.
What is the Percentage of People in the Labor Force in Point Baker?
65.1% of People are in the Labor Force in Point Baker.
What is the Unemployment Rate in Point Baker?
Unemployment Rate in Point Baker is 12.1%.