West DeLand, FL Map & Demographics
West DeLand Map
West DeLand Overview
$29,975
PER CAPITA INCOME
$69,828
AVG FAMILY INCOME
$66,768
AVG HOUSEHOLD INCOME
19.4%
WAGE / INCOME GAP [ % ]
80.6¢/ $1
WAGE / INCOME GAP [ $ ]
0.40
INEQUALITY / GINI INDEX
3,574
TOTAL POPULATION
1,865
MALE POPULATION
1,709
FEMALE POPULATION
109.13
MALES / 100 FEMALES
91.64
FEMALES / 100 MALES
40.1
MEDIAN AGE
3.4
AVG FAMILY SIZE
2.7
AVG HOUSEHOLD SIZE
1,784
LABOR FORCE [ PEOPLE ]
60.0%
PERCENT IN LABOR FORCE
8.4%
UNEMPLOYMENT RATE
Income in West DeLand
Income Overview in West DeLand
Per Capita Income in West DeLand is $29,975, while median incomes of families and households are $69,828 and $66,768 respectively.
| Characteristic | Number | Measure |
| Per Capita Income | 3,574 | $29,975 |
| Median Family Income | 800 | $69,828 |
| Mean Family Income | 800 | $93,117 |
| Median Household Income | 1,296 | $66,768 |
| Mean Household Income | 1,296 | $79,935 |
| Income Deficit | 800 | $0 |
| Wage / Income Gap (%) | 3,574 | 19.44% |
| Wage / Income Gap ($) | 3,574 | 80.56¢ per $1 |
| Gini / Inequality Index | 3,574 | 0.40 |
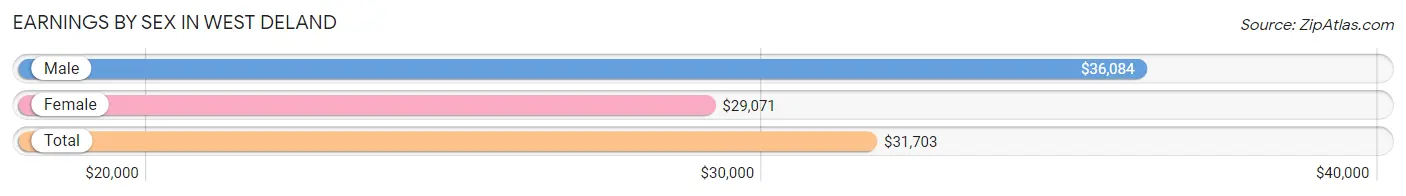
Earnings by Sex in West DeLand
Average Earnings in West DeLand are $31,703, $36,084 for men and $29,071 for women, a difference of 19.4%.
| Sex | Number | Average Earnings |
| Male | 892 (48.1%) | $36,084 |
| Female | 964 (51.9%) | $29,071 |
| Total | 1,856 (100.0%) | $31,703 |
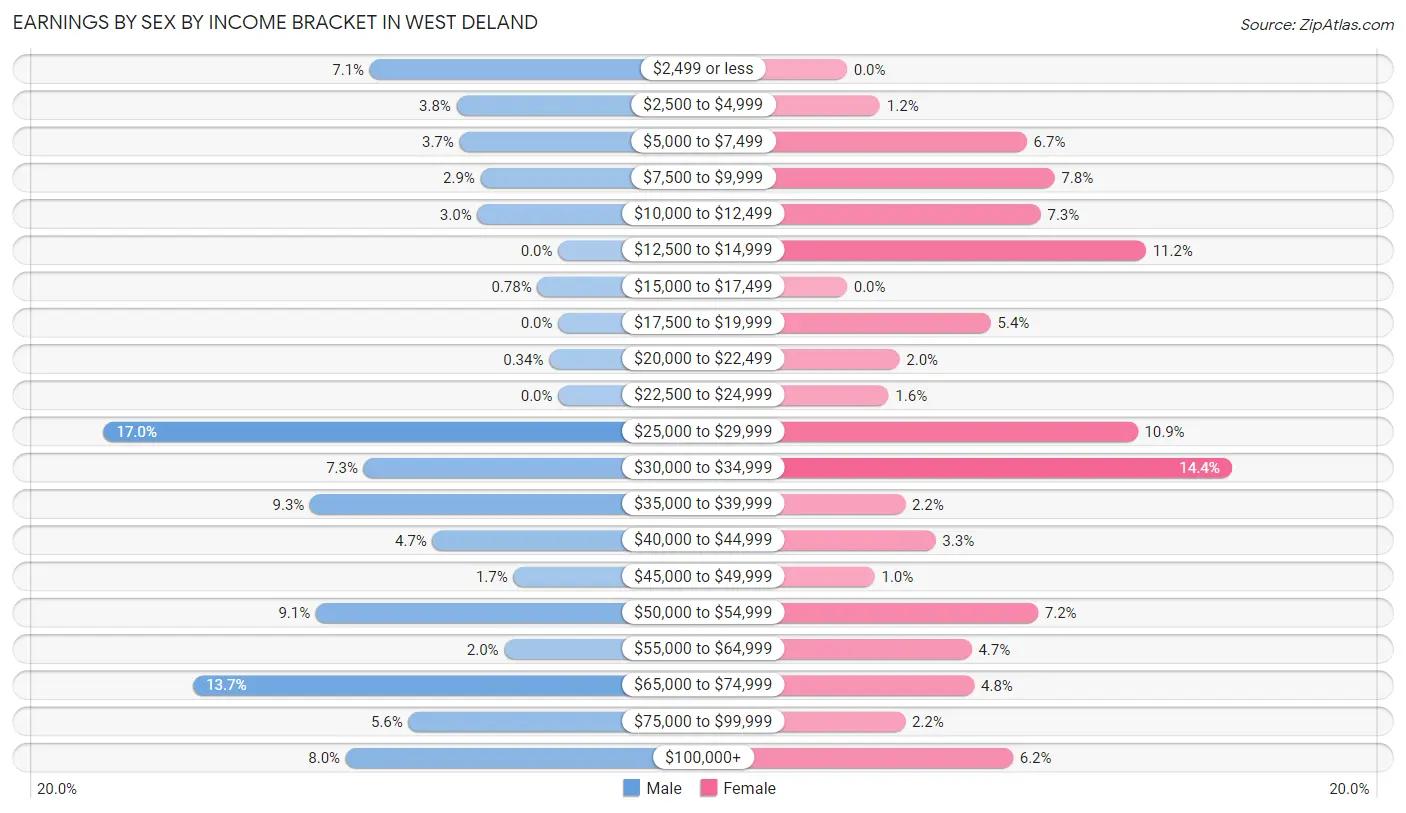
Earnings by Sex by Income Bracket in West DeLand
The most common earnings brackets in West DeLand are $25,000 to $29,999 for men (152 | 17.0%) and $30,000 to $34,999 for women (139 | 14.4%).
| Income | Male | Female |
| $2,499 or less | 63 (7.1%) | 0 (0.0%) |
| $2,500 to $4,999 | 34 (3.8%) | 12 (1.2%) |
| $5,000 to $7,499 | 33 (3.7%) | 65 (6.7%) |
| $7,500 to $9,999 | 26 (2.9%) | 75 (7.8%) |
| $10,000 to $12,499 | 27 (3.0%) | 70 (7.3%) |
| $12,500 to $14,999 | 0 (0.0%) | 108 (11.2%) |
| $15,000 to $17,499 | 7 (0.8%) | 0 (0.0%) |
| $17,500 to $19,999 | 0 (0.0%) | 52 (5.4%) |
| $20,000 to $22,499 | 3 (0.3%) | 19 (2.0%) |
| $22,500 to $24,999 | 0 (0.0%) | 15 (1.6%) |
| $25,000 to $29,999 | 152 (17.0%) | 105 (10.9%) |
| $30,000 to $34,999 | 65 (7.3%) | 139 (14.4%) |
| $35,000 to $39,999 | 83 (9.3%) | 21 (2.2%) |
| $40,000 to $44,999 | 42 (4.7%) | 32 (3.3%) |
| $45,000 to $49,999 | 15 (1.7%) | 10 (1.0%) |
| $50,000 to $54,999 | 81 (9.1%) | 69 (7.2%) |
| $55,000 to $64,999 | 18 (2.0%) | 45 (4.7%) |
| $65,000 to $74,999 | 122 (13.7%) | 46 (4.8%) |
| $75,000 to $99,999 | 50 (5.6%) | 21 (2.2%) |
| $100,000+ | 71 (8.0%) | 60 (6.2%) |
| Total | 892 (100.0%) | 964 (100.0%) |
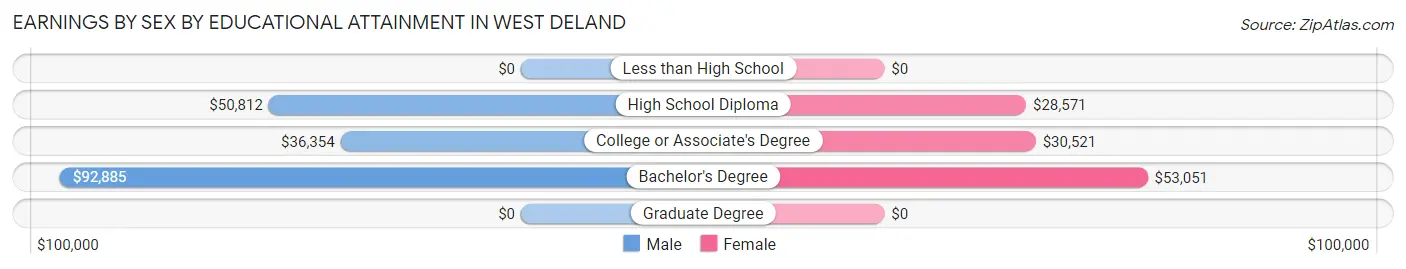
Earnings by Sex by Educational Attainment in West DeLand
Average earnings in West DeLand are $44,048 for men and $29,607 for women, a difference of 32.8%. Men with an educational attainment of bachelor's degree enjoy the highest average annual earnings of $92,885, while those with college or associate's degree education earn the least with $36,354. Women with an educational attainment of bachelor's degree earn the most with the average annual earnings of $53,051, while those with high school diploma education have the smallest earnings of $28,571.
| Educational Attainment | Male Income | Female Income |
| Less than High School | - | - |
| High School Diploma | $50,812 | $28,571 |
| College or Associate's Degree | $36,354 | $30,521 |
| Bachelor's Degree | $92,885 | $53,051 |
| Graduate Degree | - | - |
| Total | $44,048 | $29,607 |
Family Income in West DeLand
Family Income Brackets in West DeLand
According to the West DeLand family income data, there are 274 families falling into the $50,000 to $74,999 income range, which is the most common income bracket and makes up 34.3% of all families.
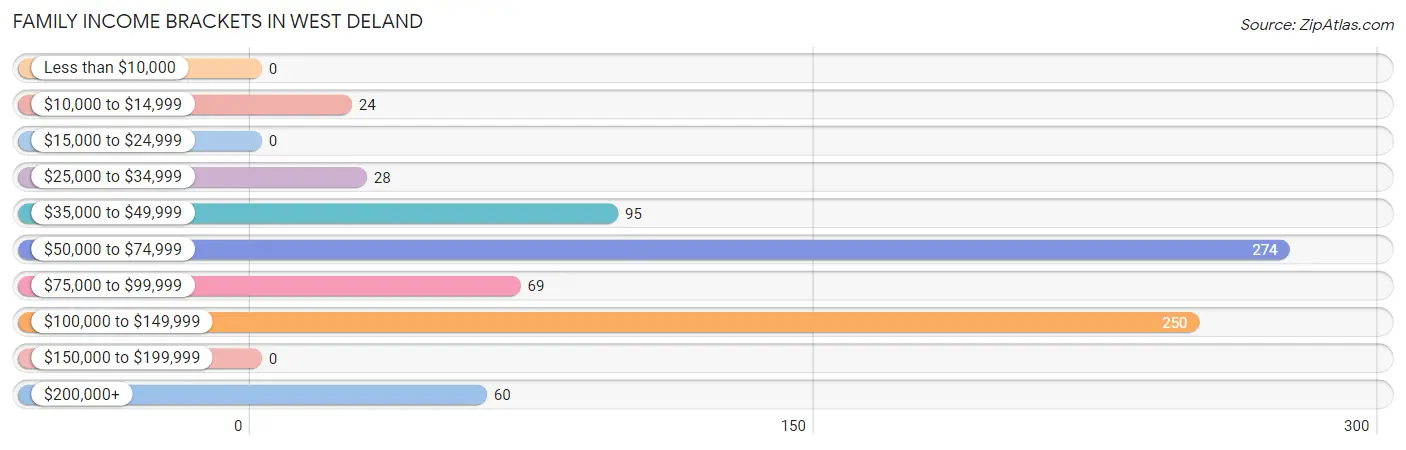
| Income Bracket | # Families | % Families |
| Less than $10,000 | 0 | 0.0% |
| $10,000 to $14,999 | 24 | 3.0% |
| $15,000 to $24,999 | 0 | 0.0% |
| $25,000 to $34,999 | 28 | 3.5% |
| $35,000 to $49,999 | 95 | 11.9% |
| $50,000 to $74,999 | 274 | 34.3% |
| $75,000 to $99,999 | 69 | 8.6% |
| $100,000 to $149,999 | 250 | 31.3% |
| $150,000 to $199,999 | 0 | 0.0% |
| $200,000+ | 60 | 7.5% |
Family Income by Famaliy Size in West DeLand
5-person families (95 | 11.9%) account for the highest median family income in West DeLand with $137,868 per family, while 2-person families (292 | 36.5%) have the highest median income of $40,172 per family member.

| Income Bracket | # Families | Median Income |
| 2-Person Families | 292 (36.5%) | $80,345 |
| 3-Person Families | 213 (26.6%) | $51,282 |
| 4-Person Families | 157 (19.6%) | $0 |
| 5-Person Families | 95 (11.9%) | $137,868 |
| 6-Person Families | 43 (5.4%) | $119,402 |
| 7+ Person Families | 0 (0.0%) | $0 |
| Total | 800 (100.0%) | $69,828 |
Family Income by Number of Earners in West DeLand
The median family income in West DeLand is $69,828, with families comprising 3+ earners (140) having the highest median family income of $140,985, while families with 1 earner (339) have the lowest median family income of $66,616, accounting for 17.5% and 42.4% of families, respectively.
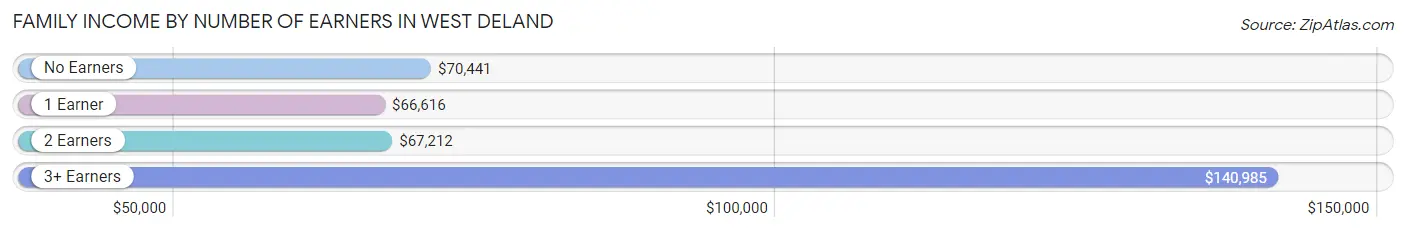
| Number of Earners | # Families | Median Income |
| No Earners | 120 (15.0%) | $70,441 |
| 1 Earner | 339 (42.4%) | $66,616 |
| 2 Earners | 201 (25.1%) | $67,212 |
| 3+ Earners | 140 (17.5%) | $140,985 |
| Total | 800 (100.0%) | $69,828 |
Household Income in West DeLand
Household Income Brackets in West DeLand
With 380 households falling in the category, the $50,000 to $74,999 income range is the most frequent in West DeLand, accounting for 29.3% of all households. In contrast, only 29 households (2.2%) fall into the $25,000 to $34,999 income bracket, making it the least populous group.
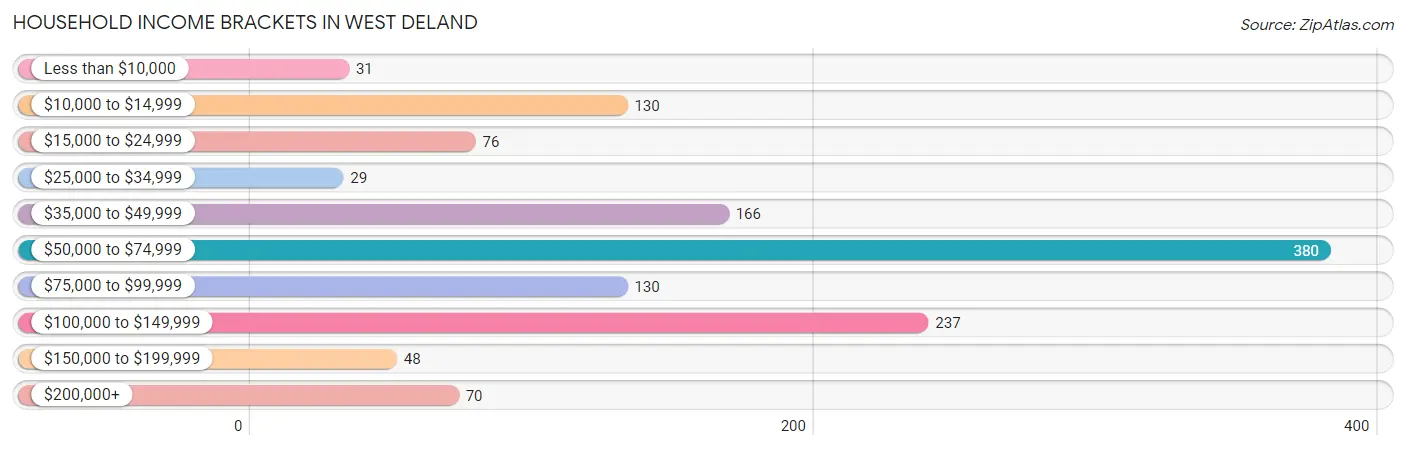
| Income Bracket | # Households | % Households |
| Less than $10,000 | 31 | 2.4% |
| $10,000 to $14,999 | 130 | 10.0% |
| $15,000 to $24,999 | 76 | 5.9% |
| $25,000 to $34,999 | 29 | 2.2% |
| $35,000 to $49,999 | 166 | 12.8% |
| $50,000 to $74,999 | 380 | 29.3% |
| $75,000 to $99,999 | 130 | 10.0% |
| $100,000 to $149,999 | 237 | 18.3% |
| $150,000 to $199,999 | 48 | 3.7% |
| $200,000+ | 70 | 5.4% |
Household Income by Householder Age in West DeLand
The median household income in West DeLand is $66,768, with the highest median household income of $72,857 found in the 45 to 64 years age bracket for the primary householder. A total of 482 households (37.2%) fall into this category. Meanwhile, the 15 to 24 years age bracket for the primary householder has the lowest median household income of $0, with 52 households (4.0%) in this group.
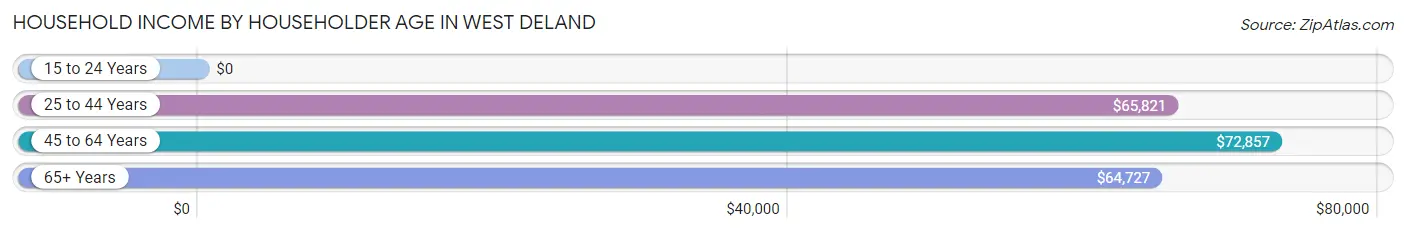
| Income Bracket | # Households | Median Income |
| 15 to 24 Years | 52 (4.0%) | $0 |
| 25 to 44 Years | 333 (25.7%) | $65,821 |
| 45 to 64 Years | 482 (37.2%) | $72,857 |
| 65+ Years | 429 (33.1%) | $64,727 |
| Total | 1,296 (100.0%) | $66,768 |
Poverty in West DeLand
Income Below Poverty by Sex and Age in West DeLand
With 13.6% poverty level for males and 13.5% for females among the residents of West DeLand, 12 to 14 year old males and 18 to 24 year old females are the most vulnerable to poverty, with 28 males (26.2%) and 60 females (44.4%) in their respective age groups living below the poverty level.
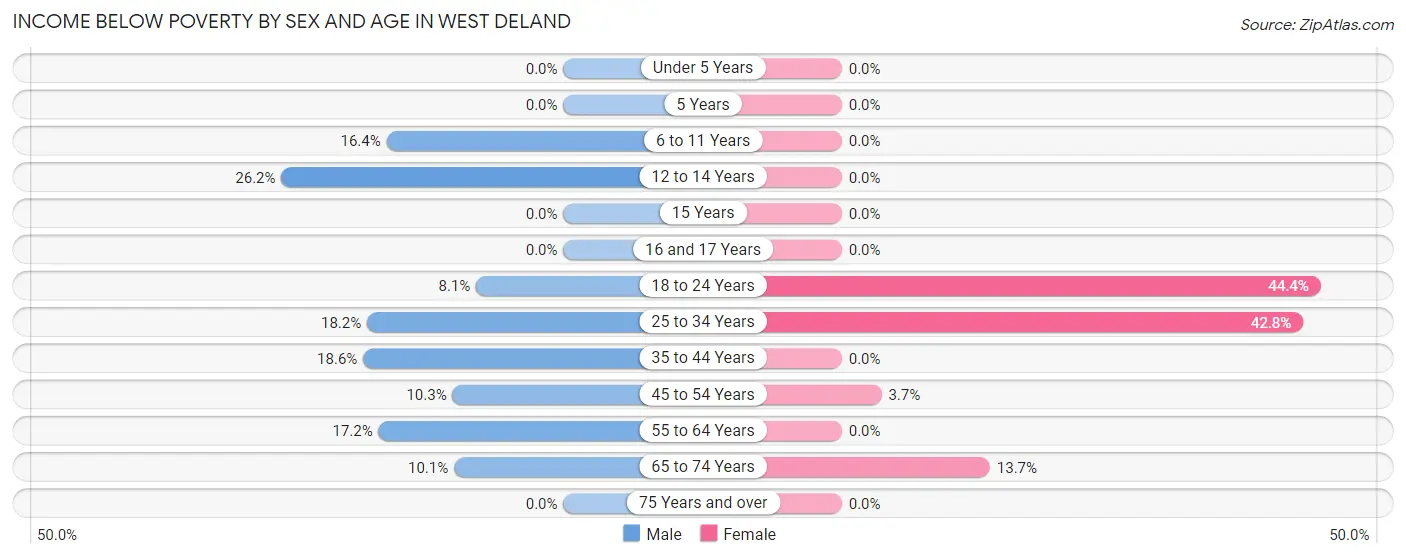
| Age Bracket | Male | Female |
| Under 5 Years | 0 (0.0%) | 0 (0.0%) |
| 5 Years | 0 (0.0%) | 0 (0.0%) |
| 6 to 11 Years | 32 (16.4%) | 0 (0.0%) |
| 12 to 14 Years | 28 (26.2%) | 0 (0.0%) |
| 15 Years | 0 (0.0%) | 0 (0.0%) |
| 16 and 17 Years | 0 (0.0%) | 0 (0.0%) |
| 18 to 24 Years | 19 (8.1%) | 60 (44.4%) |
| 25 to 34 Years | 43 (18.2%) | 137 (42.8%) |
| 35 to 44 Years | 34 (18.6%) | 0 (0.0%) |
| 45 to 54 Years | 18 (10.3%) | 7 (3.7%) |
| 55 to 64 Years | 59 (17.2%) | 0 (0.0%) |
| 65 to 74 Years | 21 (10.1%) | 25 (13.7%) |
| 75 Years and over | 0 (0.0%) | 0 (0.0%) |
| Total | 254 (13.6%) | 229 (13.5%) |
Income Above Poverty by Sex and Age in West DeLand
According to the poverty statistics in West DeLand, males aged under 5 years and females aged under 5 years are the age groups that are most secure financially, with 100.0% of males and 100.0% of females in these age groups living above the poverty line.
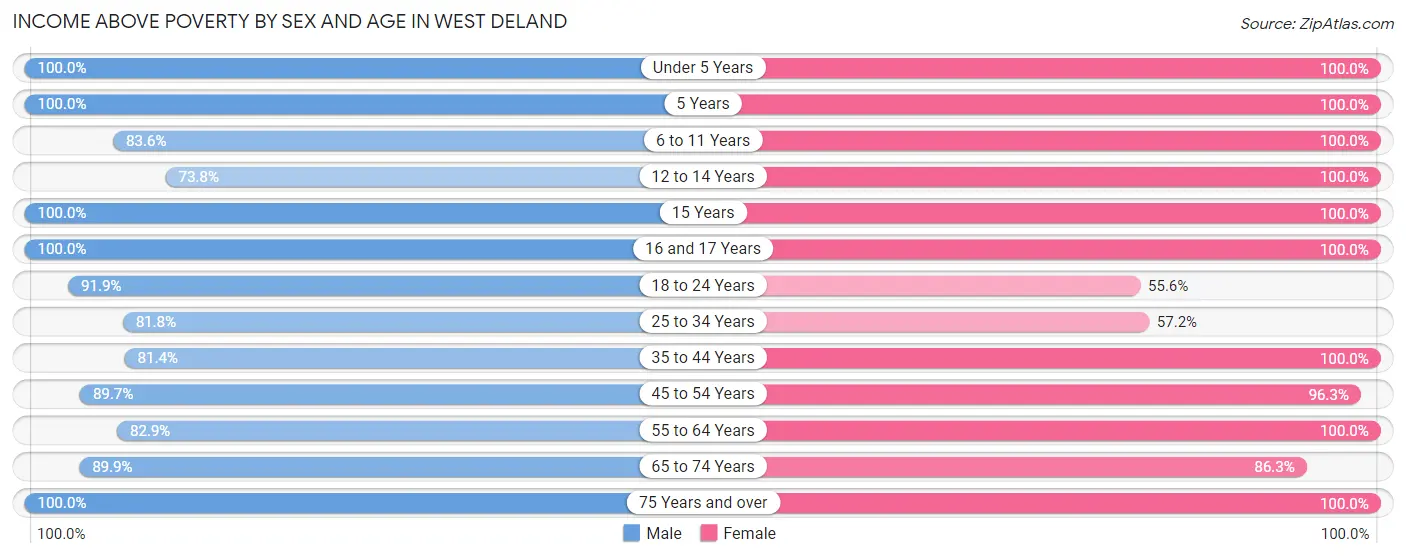
| Age Bracket | Male | Female |
| Under 5 Years | 6 (100.0%) | 43 (100.0%) |
| 5 Years | 10 (100.0%) | 22 (100.0%) |
| 6 to 11 Years | 163 (83.6%) | 164 (100.0%) |
| 12 to 14 Years | 79 (73.8%) | 21 (100.0%) |
| 15 Years | 4 (100.0%) | 28 (100.0%) |
| 16 and 17 Years | 59 (100.0%) | 30 (100.0%) |
| 18 to 24 Years | 216 (91.9%) | 75 (55.6%) |
| 25 to 34 Years | 193 (81.8%) | 183 (57.2%) |
| 35 to 44 Years | 149 (81.4%) | 167 (100.0%) |
| 45 to 54 Years | 157 (89.7%) | 183 (96.3%) |
| 55 to 64 Years | 285 (82.9%) | 196 (100.0%) |
| 65 to 74 Years | 186 (89.9%) | 157 (86.3%) |
| 75 Years and over | 104 (100.0%) | 204 (100.0%) |
| Total | 1,611 (86.4%) | 1,473 (86.6%) |
Income Below Poverty Among Married-Couple Families in West DeLand
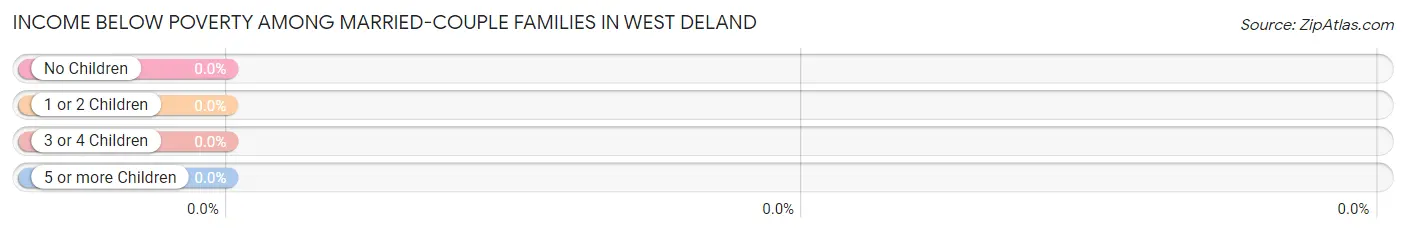
| Children | Above Poverty | Below Poverty |
| No Children | 263 (100.0%) | 0 (0.0%) |
| 1 or 2 Children | 191 (100.0%) | 0 (0.0%) |
| 3 or 4 Children | 43 (100.0%) | 0 (0.0%) |
| 5 or more Children | 0 (0.0%) | 0 (0.0%) |
| Total | 497 (100.0%) | 0 (0.0%) |
Income Below Poverty Among Single-Parent Households in West DeLand
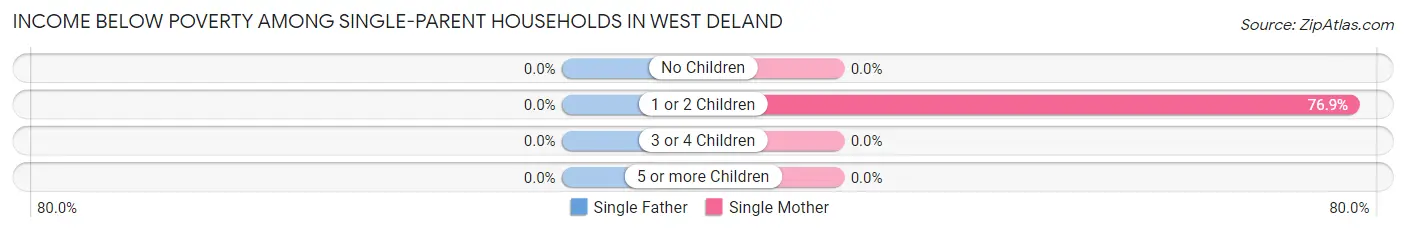
| Children | Single Father | Single Mother |
| No Children | 0 (0.0%) | 0 (0.0%) |
| 1 or 2 Children | 0 (0.0%) | 40 (76.9%) |
| 3 or 4 Children | 0 (0.0%) | 0 (0.0%) |
| 5 or more Children | 0 (0.0%) | 0 (0.0%) |
| Total | 0 (0.0%) | 40 (26.1%) |
Income Below Poverty Among Married-Couple vs Single-Parent Households in West DeLand
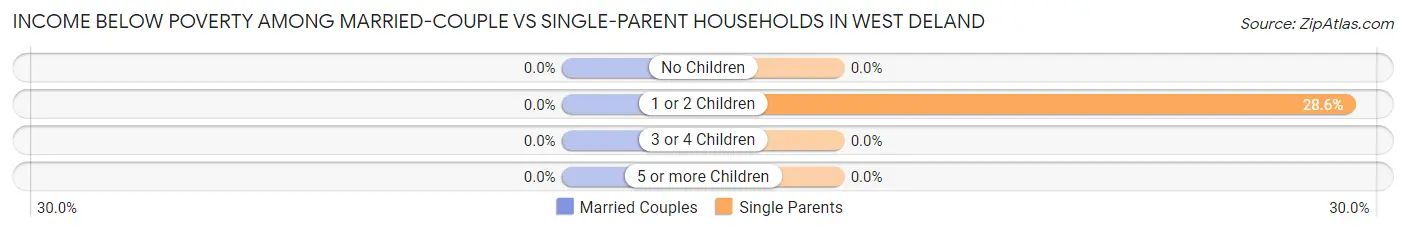
| Children | Married-Couple Families | Single-Parent Households |
| No Children | 0 (0.0%) | 0 (0.0%) |
| 1 or 2 Children | 0 (0.0%) | 40 (28.6%) |
| 3 or 4 Children | 0 (0.0%) | 0 (0.0%) |
| 5 or more Children | 0 (0.0%) | 0 (0.0%) |
| Total | 0 (0.0%) | 40 (13.2%) |
Race in West DeLand
The most populous races in West DeLand are White / Caucasian (2,440 | 68.3%), Hispanic or Latino (855 | 23.9%), and Some other Race (536 | 15.0%).
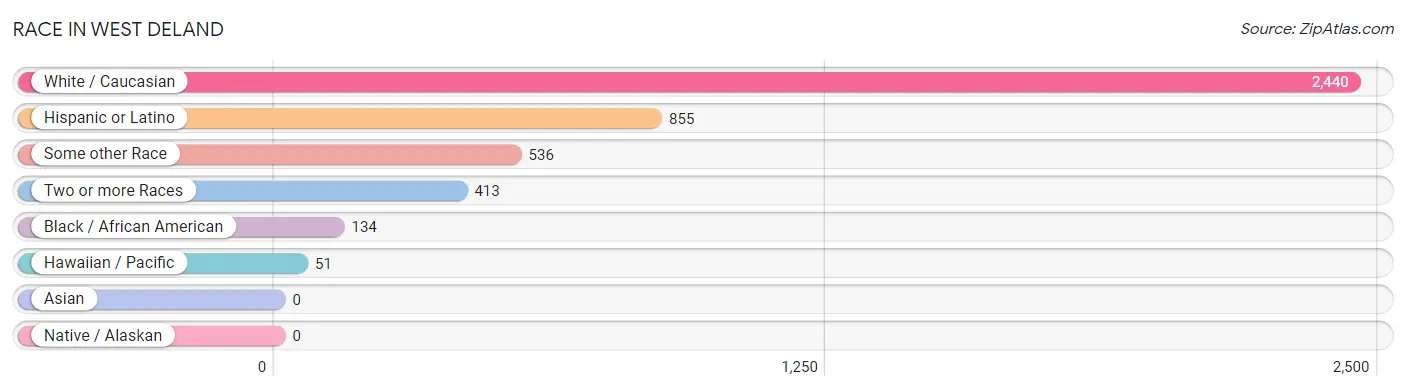
| Race | # Population | % Population |
| Asian | 0 | 0.0% |
| Black / African American | 134 | 3.7% |
| Hawaiian / Pacific | 51 | 1.4% |
| Hispanic or Latino | 855 | 23.9% |
| Native / Alaskan | 0 | 0.0% |
| White / Caucasian | 2,440 | 68.3% |
| Two or more Races | 413 | 11.6% |
| Some other Race | 536 | 15.0% |
| Total | 3,574 | 100.0% |
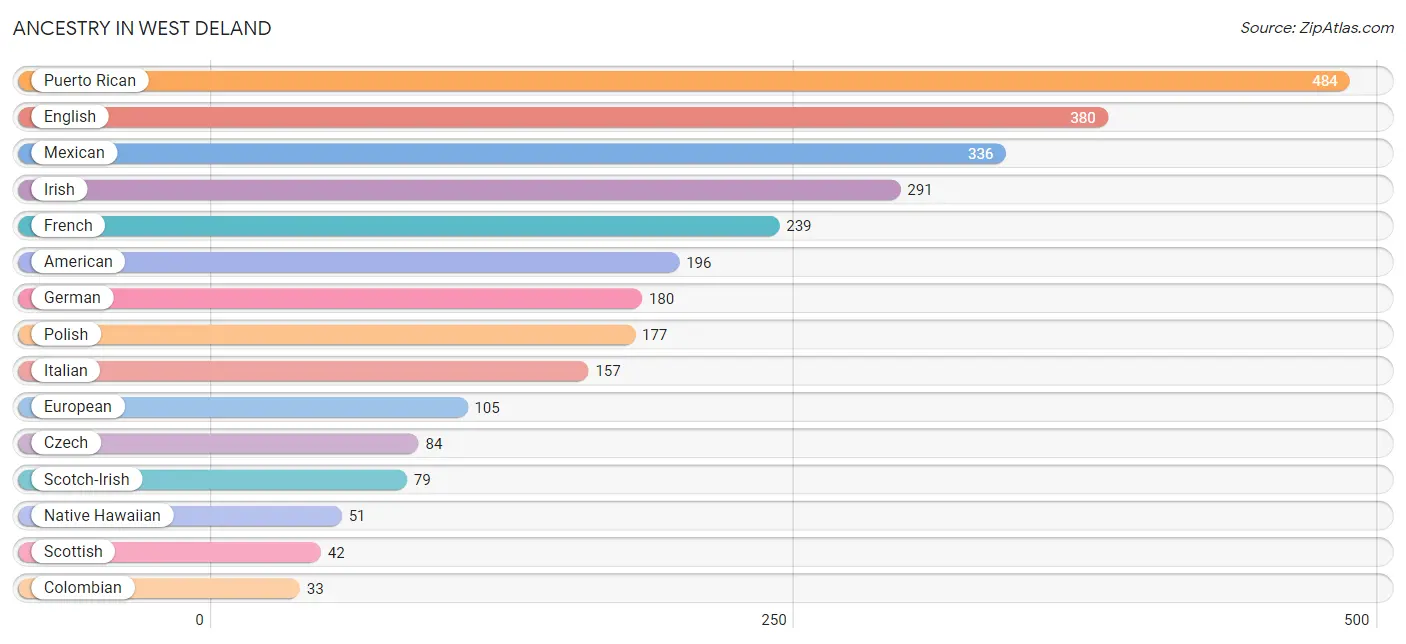
Ancestry in West DeLand
The most populous ancestries reported in West DeLand are Puerto Rican (484 | 13.5%), English (380 | 10.6%), Mexican (336 | 9.4%), Irish (291 | 8.1%), and French (239 | 6.7%), together accounting for 48.4% of all West DeLand residents.
| Ancestry | # Population | % Population |
| African | 24 | 0.7% |
| American | 196 | 5.5% |
| Austrian | 30 | 0.8% |
| Belgian | 12 | 0.3% |
| Canadian | 13 | 0.4% |
| Colombian | 33 | 0.9% |
| Czech | 84 | 2.4% |
| Dutch | 10 | 0.3% |
| Eastern European | 7 | 0.2% |
| English | 380 | 10.6% |
| European | 105 | 2.9% |
| French | 239 | 6.7% |
| French Canadian | 11 | 0.3% |
| German | 180 | 5.0% |
| Greek | 21 | 0.6% |
| Haitian | 2 | 0.1% |
| Hungarian | 14 | 0.4% |
| Irish | 291 | 8.1% |
| Italian | 157 | 4.4% |
| Mexican | 336 | 9.4% |
| Native Hawaiian | 51 | 1.4% |
| Polish | 177 | 5.0% |
| Portuguese | 7 | 0.2% |
| Puerto Rican | 484 | 13.5% |
| Romanian | 31 | 0.9% |
| Scandinavian | 22 | 0.6% |
| Scotch-Irish | 79 | 2.2% |
| Scottish | 42 | 1.2% |
| South American | 33 | 0.9% |
| Subsaharan African | 24 | 0.7% |
| Welsh | 13 | 0.4% | View All 31 Rows |
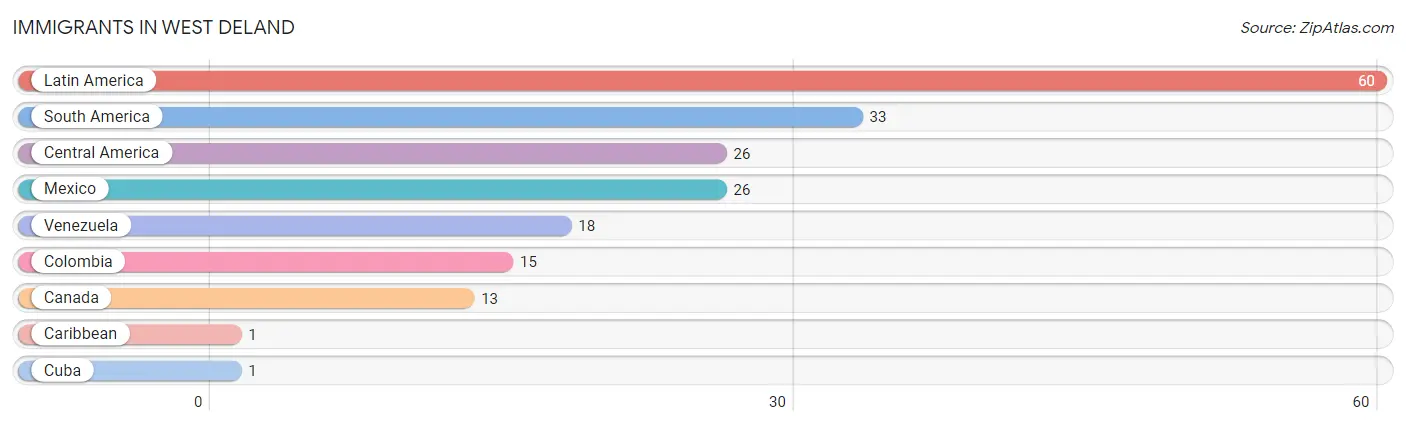
Immigrants in West DeLand
The most numerous immigrant groups reported in West DeLand came from Latin America (60 | 1.7%), South America (33 | 0.9%), Central America (26 | 0.7%), Mexico (26 | 0.7%), and Venezuela (18 | 0.5%), together accounting for 4.6% of all West DeLand residents.
| Immigration Origin | # Population | % Population |
| Canada | 13 | 0.4% |
| Caribbean | 1 | 0.0% |
| Central America | 26 | 0.7% |
| Colombia | 15 | 0.4% |
| Cuba | 1 | 0.0% |
| Latin America | 60 | 1.7% |
| Mexico | 26 | 0.7% |
| South America | 33 | 0.9% |
| Venezuela | 18 | 0.5% | View All 9 Rows |
Sex and Age in West DeLand
Sex and Age in West DeLand
The most populous age groups in West DeLand are 55 to 59 Years (195 | 10.5%) for men and 25 to 29 Years (207 | 12.1%) for women.
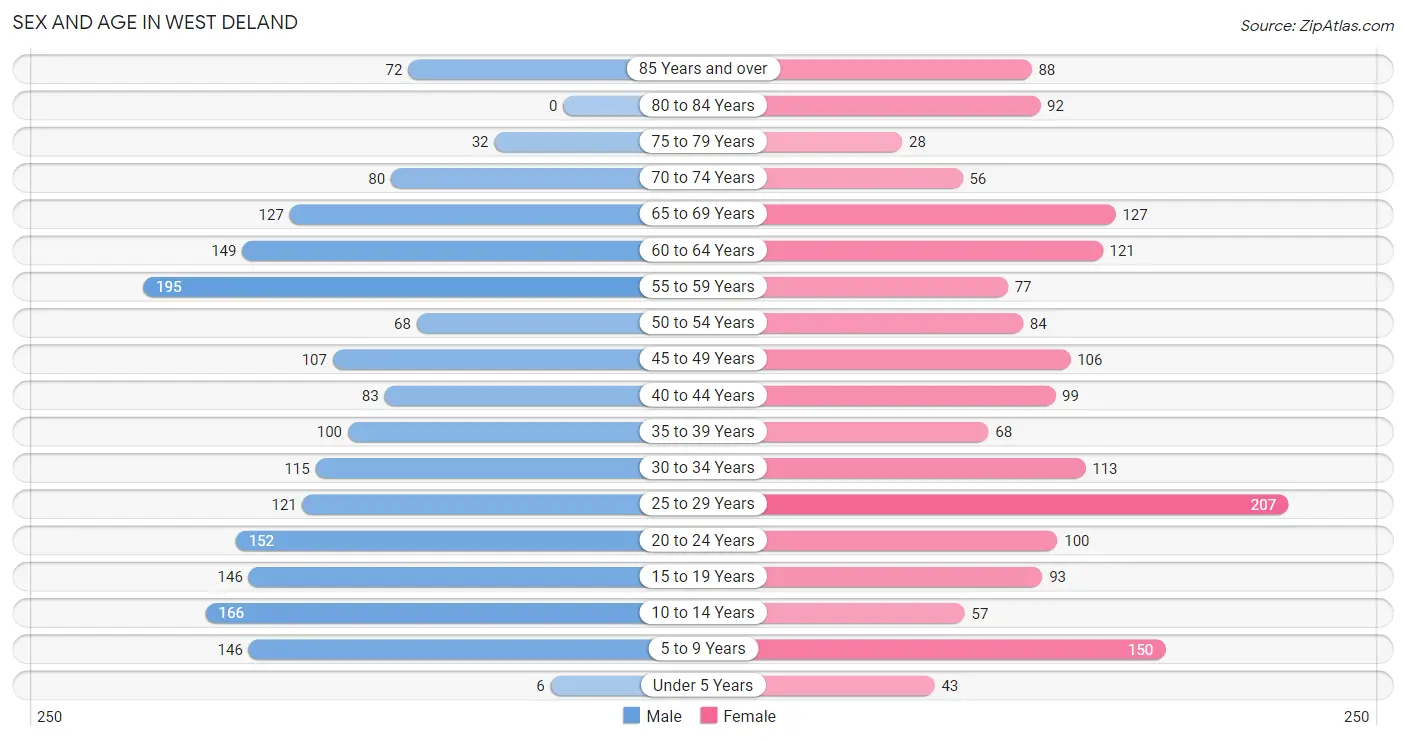
| Age Bracket | Male | Female |
| Under 5 Years | 6 (0.3%) | 43 (2.5%) |
| 5 to 9 Years | 146 (7.8%) | 150 (8.8%) |
| 10 to 14 Years | 166 (8.9%) | 57 (3.3%) |
| 15 to 19 Years | 146 (7.8%) | 93 (5.4%) |
| 20 to 24 Years | 152 (8.2%) | 100 (5.9%) |
| 25 to 29 Years | 121 (6.5%) | 207 (12.1%) |
| 30 to 34 Years | 115 (6.2%) | 113 (6.6%) |
| 35 to 39 Years | 100 (5.4%) | 68 (4.0%) |
| 40 to 44 Years | 83 (4.4%) | 99 (5.8%) |
| 45 to 49 Years | 107 (5.7%) | 106 (6.2%) |
| 50 to 54 Years | 68 (3.6%) | 84 (4.9%) |
| 55 to 59 Years | 195 (10.5%) | 77 (4.5%) |
| 60 to 64 Years | 149 (8.0%) | 121 (7.1%) |
| 65 to 69 Years | 127 (6.8%) | 127 (7.4%) |
| 70 to 74 Years | 80 (4.3%) | 56 (3.3%) |
| 75 to 79 Years | 32 (1.7%) | 28 (1.6%) |
| 80 to 84 Years | 0 (0.0%) | 92 (5.4%) |
| 85 Years and over | 72 (3.9%) | 88 (5.1%) |
| Total | 1,865 (100.0%) | 1,709 (100.0%) |
Families and Households in West DeLand
Median Family Size in West DeLand
The median family size in West DeLand is 3.41 persons per family, with single male/father families (150 | 18.8%) accounting for the largest median family size of 3.71 persons per family. On the other hand, married-couple families (497 | 62.1%) represent the smallest median family size with 3.30 persons per family.
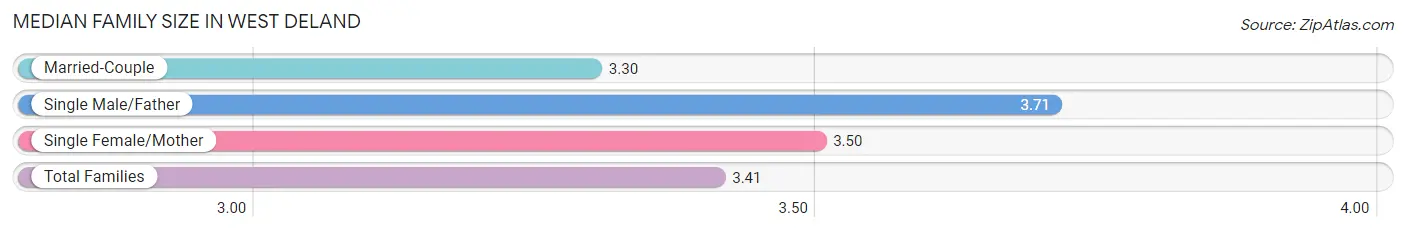
| Family Type | # Families | Family Size |
| Married-Couple | 497 (62.1%) | 3.30 |
| Single Male/Father | 150 (18.8%) | 3.71 |
| Single Female/Mother | 153 (19.1%) | 3.50 |
| Total Families | 800 (100.0%) | 3.41 |
Median Household Size in West DeLand
The median household size in West DeLand is 2.74 persons per household, with single male/father households (150 | 11.6%) accounting for the largest median household size of 4.35 persons per household. non-family households (496 | 38.3%) represent the smallest median household size with 1.42 persons per household.
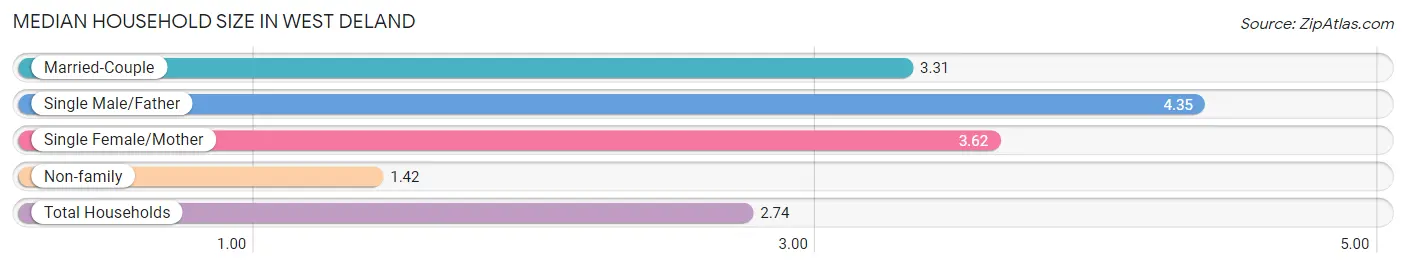
| Household Type | # Households | Household Size |
| Married-Couple | 497 (38.4%) | 3.31 |
| Single Male/Father | 150 (11.6%) | 4.35 |
| Single Female/Mother | 153 (11.8%) | 3.62 |
| Non-family | 496 (38.3%) | 1.42 |
| Total Households | 1,296 (100.0%) | 2.74 |
Household Size by Marriage Status in West DeLand
Out of a total of 1,296 households in West DeLand, 800 (61.7%) are family households, while 496 (38.3%) are nonfamily households. The most numerous type of family households are 2-person households, comprising 272, and the most common type of nonfamily households are 1-person households, comprising 298.
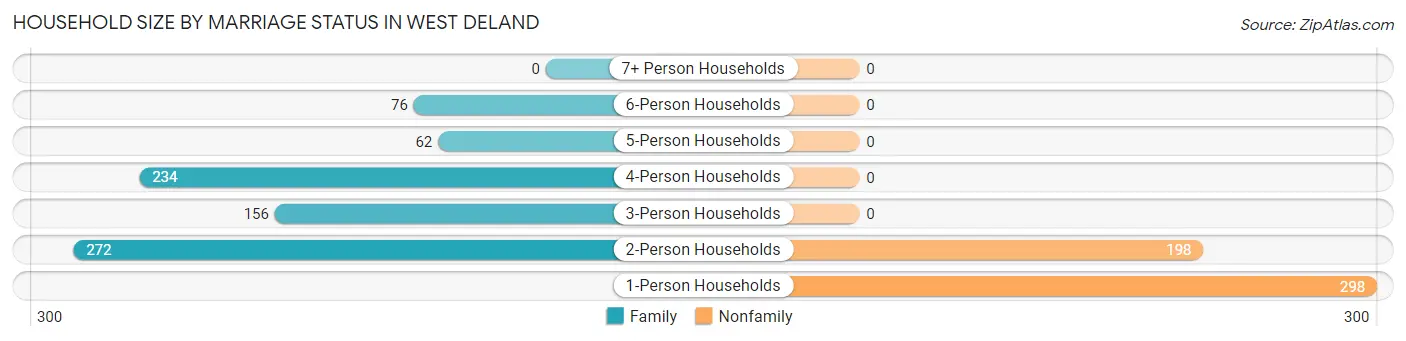
| Household Size | Family Households | Nonfamily Households |
| 1-Person Households | - | 298 (23.0%) |
| 2-Person Households | 272 (21.0%) | 198 (15.3%) |
| 3-Person Households | 156 (12.0%) | 0 (0.0%) |
| 4-Person Households | 234 (18.1%) | 0 (0.0%) |
| 5-Person Households | 62 (4.8%) | 0 (0.0%) |
| 6-Person Households | 76 (5.9%) | 0 (0.0%) |
| 7+ Person Households | 0 (0.0%) | 0 (0.0%) |
| Total | 800 (61.7%) | 496 (38.3%) |
Female Fertility in West DeLand
Fertility by Age in West DeLand
| Age Bracket | Women with Births | Births / 1,000 Women |
| 15 to 19 years | 0 (0.0%) | 0.0 |
| 20 to 34 years | 0 (0.0%) | 0.0 |
| 35 to 50 years | 0 (0.0%) | 0.0 |
| Total | 0 (0.0%) | 0.0 |
Fertility by Age by Marriage Status in West DeLand
| Age Bracket | Married | Unmarried |
| 15 to 19 years | 0 (0.0%) | 0 (0.0%) |
| 20 to 34 years | 0 (0.0%) | 0 (0.0%) |
| 35 to 50 years | 0 (0.0%) | 0 (0.0%) |
| Total | 0 (0.0%) | 0 (0.0%) |
Fertility by Education in West DeLand
| Educational Attainment | Women with Births | Births / 1,000 Women |
| Less than High School | 0 (0.0%) | 0.0 |
| High School Diploma | 0 (0.0%) | 0.0 |
| College or Associate's Degree | 0 (0.0%) | 0.0 |
| Bachelor's Degree | 0 (0.0%) | 0.0 |
| Graduate Degree | 0 (0.0%) | 0.0 |
| Total | 0 (0.0%) | 0.0 |
Fertility by Education by Marriage Status in West DeLand
| Educational Attainment | Married | Unmarried |
| Less than High School | 0 (0.0%) | 0 (0.0%) |
| High School Diploma | 0 (0.0%) | 0 (0.0%) |
| College or Associate's Degree | 0 (0.0%) | 0 (0.0%) |
| Bachelor's Degree | 0 (0.0%) | 0 (0.0%) |
| Graduate Degree | 0 (0.0%) | 0 (0.0%) |
| Total | 0 (0.0%) | 0 (0.0%) |
Employment Characteristics in West DeLand
Employment by Class of Employer in West DeLand
Among the 1,579 employed individuals in West DeLand, private company employees (1,037 | 65.7%), self-employed (incorporated) (185 | 11.7%), and local government employees (115 | 7.3%) make up the most common classes of employment.
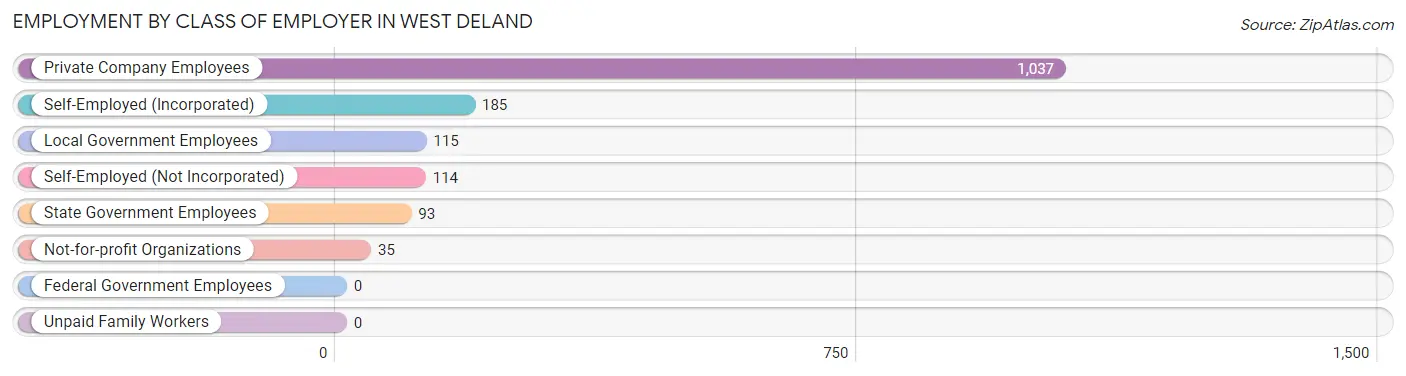
| Employer Class | # Employees | % Employees |
| Private Company Employees | 1,037 | 65.7% |
| Self-Employed (Incorporated) | 185 | 11.7% |
| Self-Employed (Not Incorporated) | 114 | 7.2% |
| Not-for-profit Organizations | 35 | 2.2% |
| Local Government Employees | 115 | 7.3% |
| State Government Employees | 93 | 5.9% |
| Federal Government Employees | 0 | 0.0% |
| Unpaid Family Workers | 0 | 0.0% |
| Total | 1,579 | 100.0% |
Employment Status by Age in West DeLand
According to the labor force statistics for West DeLand, out of the total population over 16 years of age (2,974), 60.0% or 1,784 individuals are in the labor force, with 8.4% or 150 of them unemployed. The age group with the highest labor force participation rate is 30 to 34 years, with 99.1% or 226 individuals in the labor force. Within the labor force, the 55 to 59 years age range has the highest percentage of unemployed individuals, with 34.7% or 51 of them being unemployed.
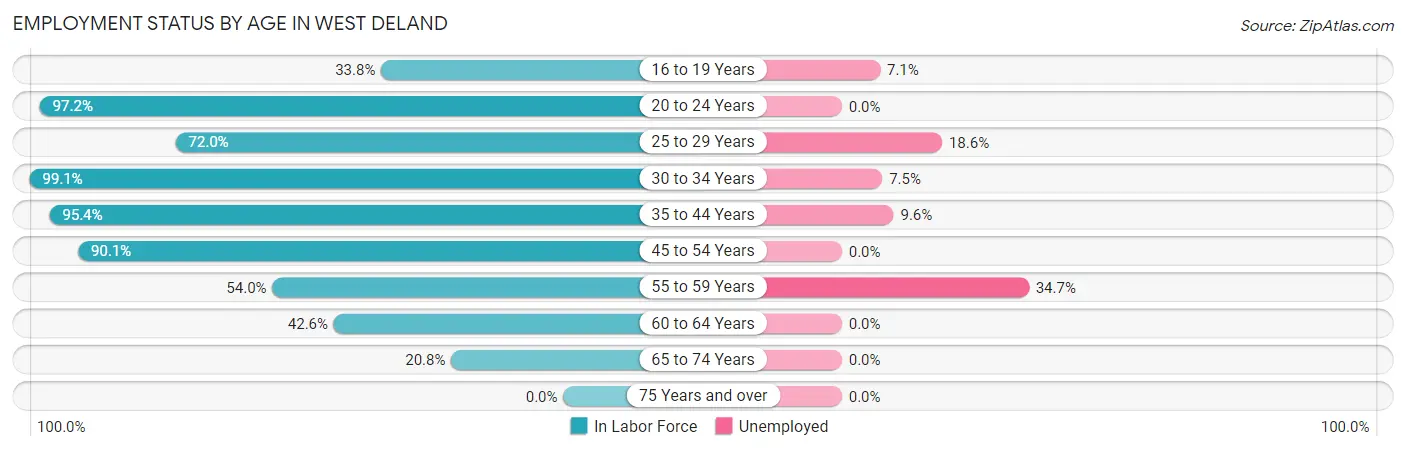
| Age Bracket | In Labor Force | Unemployed |
| 16 to 19 Years | 70 (33.8%) | 5 (7.1%) |
| 20 to 24 Years | 245 (97.2%) | 0 (0.0%) |
| 25 to 29 Years | 236 (72.0%) | 44 (18.6%) |
| 30 to 34 Years | 226 (99.1%) | 17 (7.5%) |
| 35 to 44 Years | 334 (95.4%) | 32 (9.6%) |
| 45 to 54 Years | 329 (90.1%) | 0 (0.0%) |
| 55 to 59 Years | 147 (54.0%) | 51 (34.7%) |
| 60 to 64 Years | 115 (42.6%) | 0 (0.0%) |
| 65 to 74 Years | 81 (20.8%) | 0 (0.0%) |
| 75 Years and over | 0 (0.0%) | 0 (0.0%) |
| Total | 1,784 (60.0%) | 150 (8.4%) |
Employment Status by Educational Attainment in West DeLand
According to labor force statistics for West DeLand, 76.5% of individuals (1,387) out of the total population between 25 and 64 years of age (1,813) are in the labor force, with 10.4% or 144 of them being unemployed. The group with the highest labor force participation rate are those with the educational attainment of bachelor's degree or higher, with 81.7% or 170 individuals in the labor force. Within the labor force, individuals with less than high school education have the highest percentage of unemployment, with 23.4% or 32 of them being unemployed.
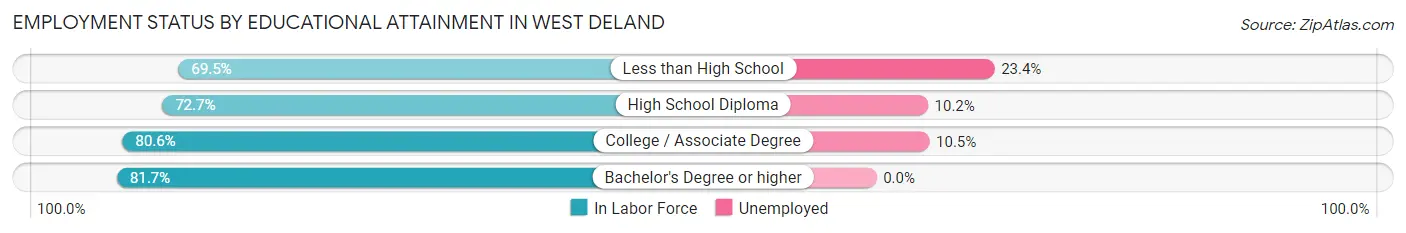
| Educational Attainment | In Labor Force | Unemployed |
| Less than High School | 137 (69.5%) | 46 (23.4%) |
| High School Diploma | 500 (72.7%) | 70 (10.2%) |
| College / Associate Degree | 580 (80.6%) | 76 (10.5%) |
| Bachelor's Degree or higher | 170 (81.7%) | 0 (0.0%) |
| Total | 1,387 (76.5%) | 189 (10.4%) |
Employment Occupations by Sex in West DeLand
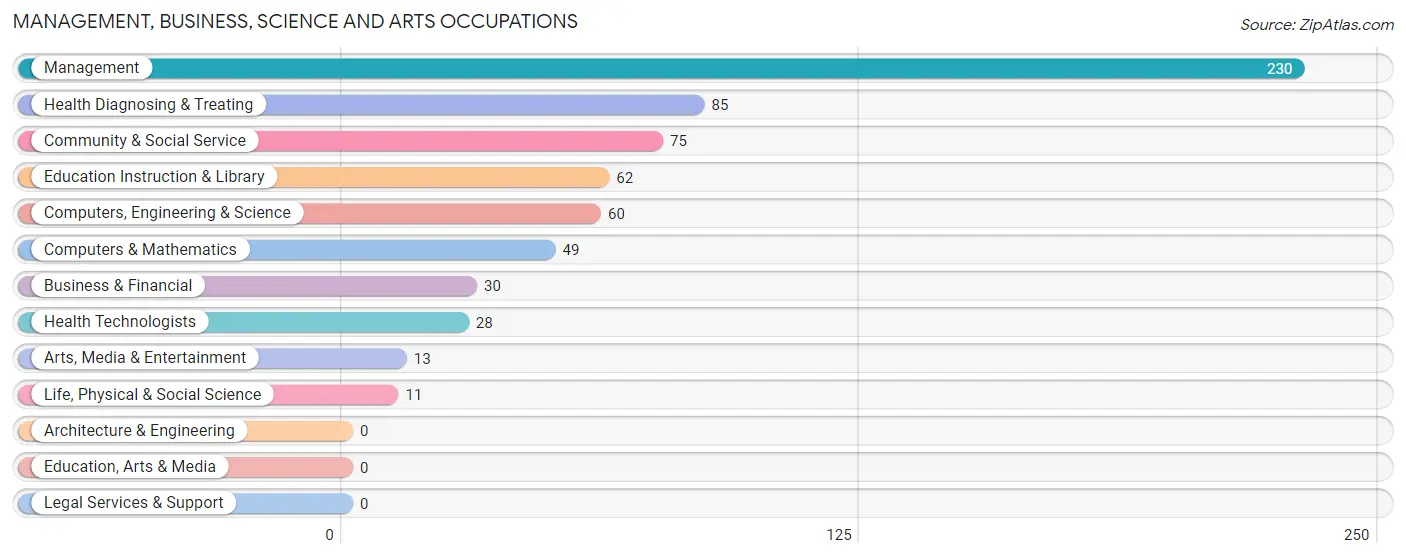
Management, Business, Science and Arts Occupations
The most common Management, Business, Science and Arts occupations in West DeLand are Management (230 | 14.1%), Health Diagnosing & Treating (85 | 5.2%), Community & Social Service (75 | 4.6%), Education Instruction & Library (62 | 3.8%), and Computers, Engineering & Science (60 | 3.7%).
Management, Business, Science and Arts Occupations by Sex
Within the Management, Business, Science and Arts occupations in West DeLand, the most male-oriented occupations are Computers, Engineering & Science (100.0%), Computers & Mathematics (100.0%), and Life, Physical & Social Science (100.0%), while the most female-oriented occupations are Education Instruction & Library (100.0%), Health Diagnosing & Treating (100.0%), and Health Technologists (100.0%).
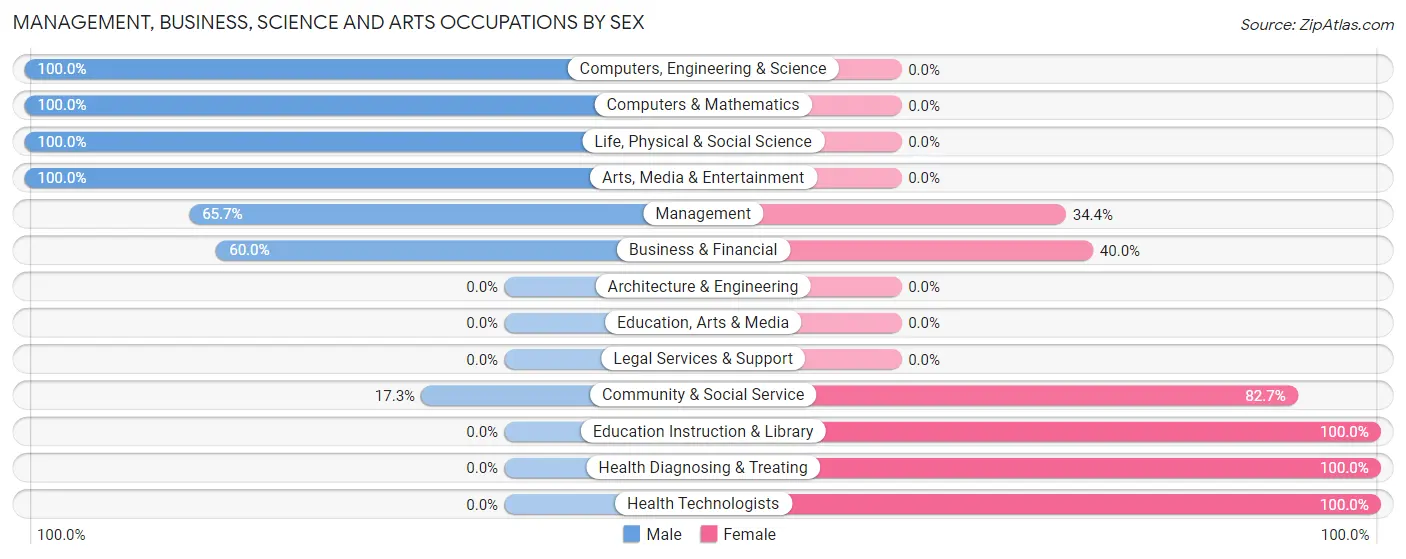
| Occupation | Male | Female |
| Management | 151 (65.6%) | 79 (34.4%) |
| Business & Financial | 18 (60.0%) | 12 (40.0%) |
| Computers, Engineering & Science | 60 (100.0%) | 0 (0.0%) |
| Computers & Mathematics | 49 (100.0%) | 0 (0.0%) |
| Architecture & Engineering | 0 (0.0%) | 0 (0.0%) |
| Life, Physical & Social Science | 11 (100.0%) | 0 (0.0%) |
| Community & Social Service | 13 (17.3%) | 62 (82.7%) |
| Education, Arts & Media | 0 (0.0%) | 0 (0.0%) |
| Legal Services & Support | 0 (0.0%) | 0 (0.0%) |
| Education Instruction & Library | 0 (0.0%) | 62 (100.0%) |
| Arts, Media & Entertainment | 13 (100.0%) | 0 (0.0%) |
| Health Diagnosing & Treating | 0 (0.0%) | 85 (100.0%) |
| Health Technologists | 0 (0.0%) | 28 (100.0%) |
| Total (Category) | 242 (50.4%) | 238 (49.6%) |
| Total (Overall) | 746 (45.7%) | 888 (54.3%) |
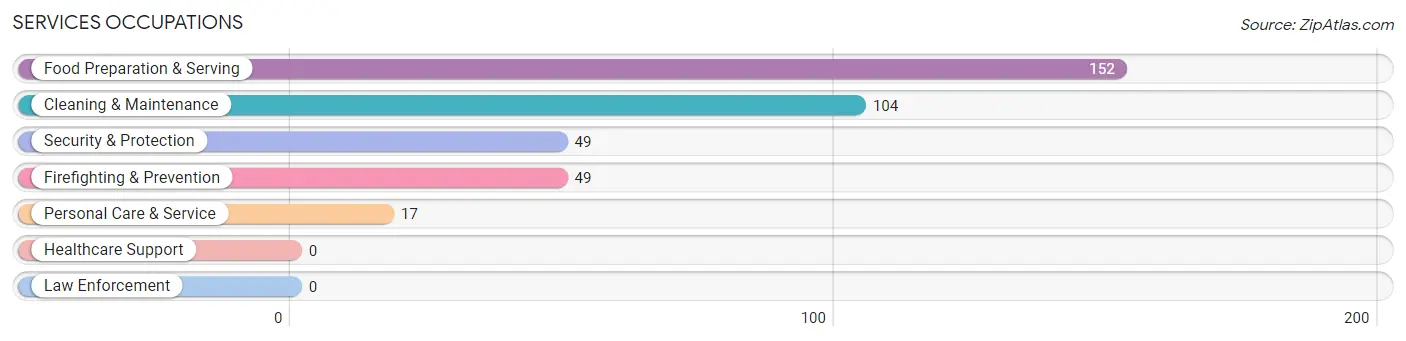
Services Occupations
The most common Services occupations in West DeLand are Food Preparation & Serving (152 | 9.3%), Cleaning & Maintenance (104 | 6.4%), Security & Protection (49 | 3.0%), Firefighting & Prevention (49 | 3.0%), and Personal Care & Service (17 | 1.0%).
Services Occupations by Sex
Within the Services occupations in West DeLand, the most male-oriented occupations are Security & Protection (100.0%), Firefighting & Prevention (100.0%), and Personal Care & Service (35.3%), while the most female-oriented occupations are Cleaning & Maintenance (100.0%), Food Preparation & Serving (77.0%), and Personal Care & Service (64.7%).
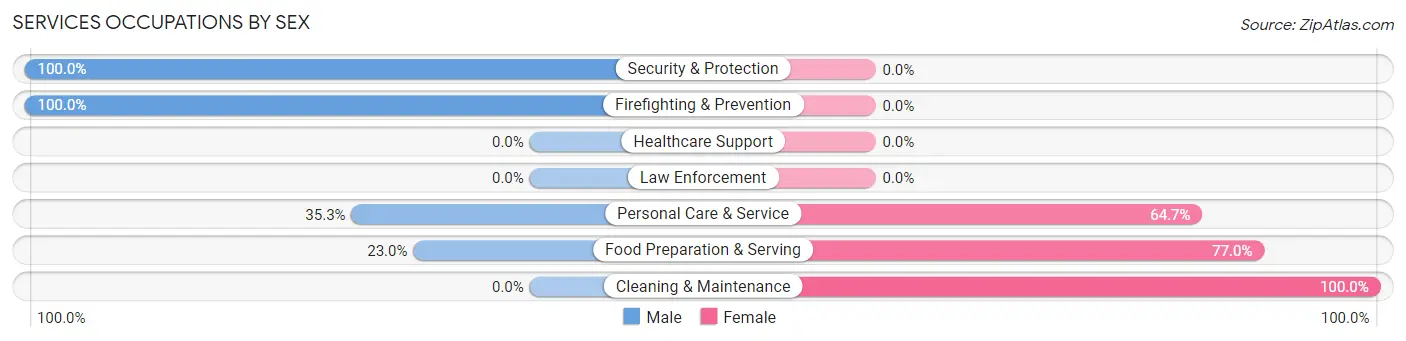
| Occupation | Male | Female |
| Healthcare Support | 0 (0.0%) | 0 (0.0%) |
| Security & Protection | 49 (100.0%) | 0 (0.0%) |
| Firefighting & Prevention | 49 (100.0%) | 0 (0.0%) |
| Law Enforcement | 0 (0.0%) | 0 (0.0%) |
| Food Preparation & Serving | 35 (23.0%) | 117 (77.0%) |
| Cleaning & Maintenance | 0 (0.0%) | 104 (100.0%) |
| Personal Care & Service | 6 (35.3%) | 11 (64.7%) |
| Total (Category) | 90 (28.0%) | 232 (72.1%) |
| Total (Overall) | 746 (45.7%) | 888 (54.3%) |
Sales and Office Occupations
The most common Sales and Office occupations in West DeLand are Office & Administration (429 | 26.3%), and Sales & Related (94 | 5.8%).

Sales and Office Occupations by Sex

| Occupation | Male | Female |
| Sales & Related | 87 (92.5%) | 7 (7.4%) |
| Office & Administration | 52 (12.1%) | 377 (87.9%) |
| Total (Category) | 139 (26.6%) | 384 (73.4%) |
| Total (Overall) | 746 (45.7%) | 888 (54.3%) |
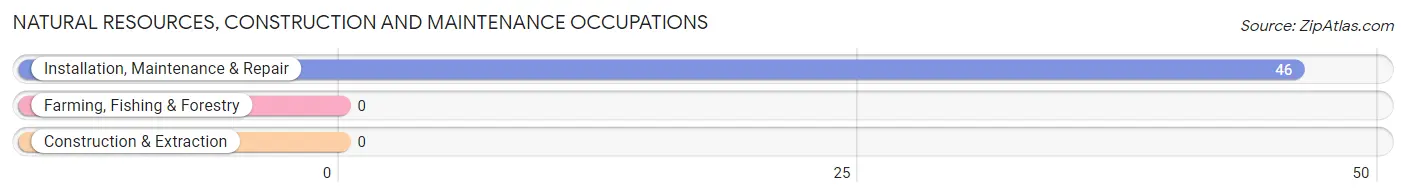
Natural Resources, Construction and Maintenance Occupations
The most common Natural Resources, Construction and Maintenance occupations in West DeLand are , and Installation, Maintenance & Repair (46 | 2.8%).
Natural Resources, Construction and Maintenance Occupations by Sex

| Occupation | Male | Female |
| Farming, Fishing & Forestry | 0 (0.0%) | 0 (0.0%) |
| Construction & Extraction | 0 (0.0%) | 0 (0.0%) |
| Installation, Maintenance & Repair | 46 (100.0%) | 0 (0.0%) |
| Total (Category) | 46 (100.0%) | 0 (0.0%) |
| Total (Overall) | 746 (45.7%) | 888 (54.3%) |
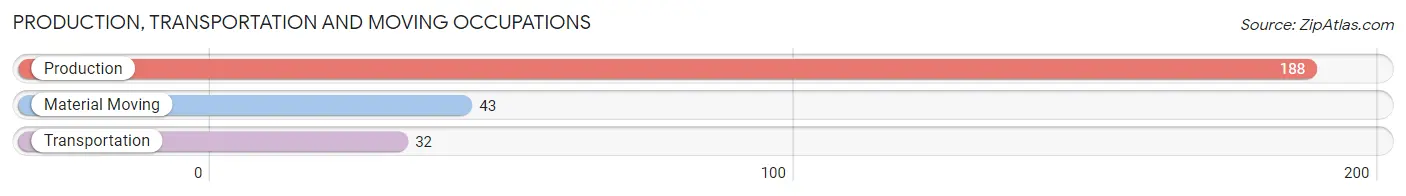
Production, Transportation and Moving Occupations
The most common Production, Transportation and Moving occupations in West DeLand are Production (188 | 11.5%), Material Moving (43 | 2.6%), and Transportation (32 | 2.0%).
Production, Transportation and Moving Occupations by Sex
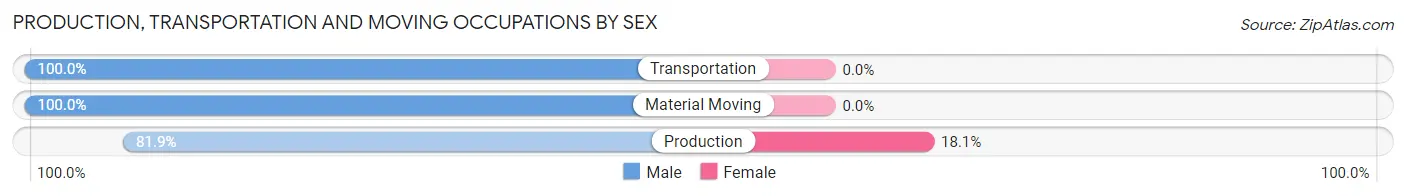
| Occupation | Male | Female |
| Production | 154 (81.9%) | 34 (18.1%) |
| Transportation | 32 (100.0%) | 0 (0.0%) |
| Material Moving | 43 (100.0%) | 0 (0.0%) |
| Total (Category) | 229 (87.1%) | 34 (12.9%) |
| Total (Overall) | 746 (45.7%) | 888 (54.3%) |
Employment Industries by Sex in West DeLand
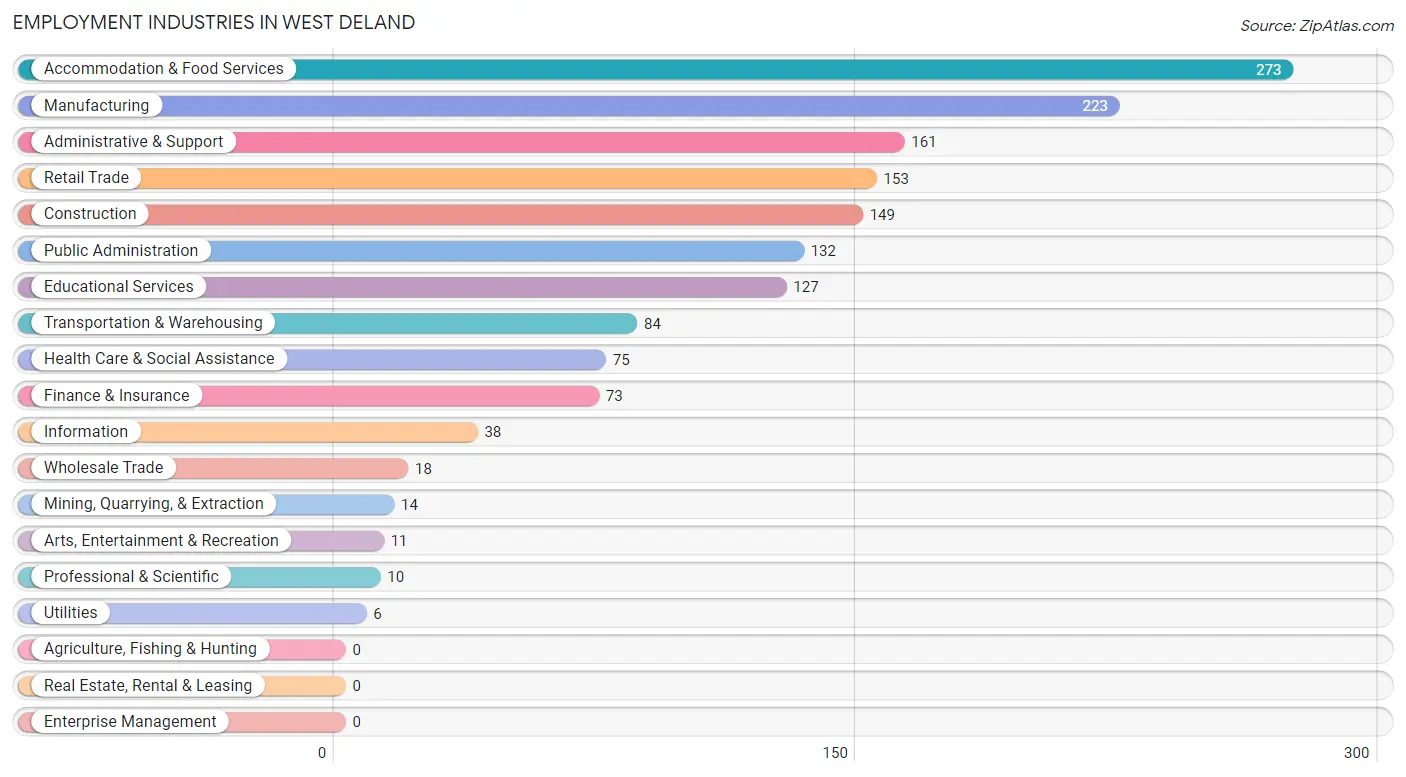
Employment Industries in West DeLand
The major employment industries in West DeLand include Accommodation & Food Services (273 | 16.7%), Manufacturing (223 | 13.7%), Administrative & Support (161 | 9.9%), Retail Trade (153 | 9.4%), and Construction (149 | 9.1%).
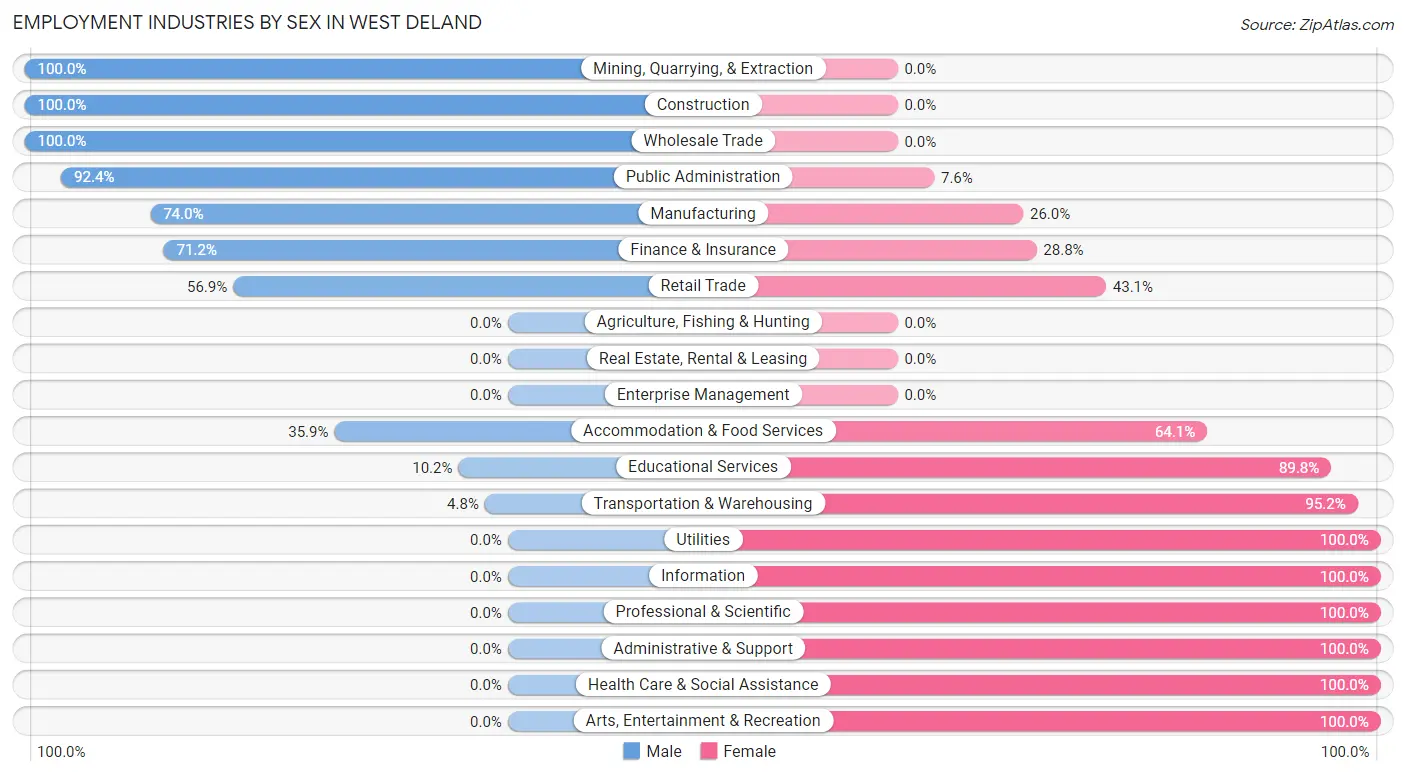
Employment Industries by Sex in West DeLand
The West DeLand industries that see more men than women are Mining, Quarrying, & Extraction (100.0%), Construction (100.0%), and Wholesale Trade (100.0%), whereas the industries that tend to have a higher number of women are Utilities (100.0%), Information (100.0%), and Professional & Scientific (100.0%).
| Industry | Male | Female |
| Agriculture, Fishing & Hunting | 0 (0.0%) | 0 (0.0%) |
| Mining, Quarrying, & Extraction | 14 (100.0%) | 0 (0.0%) |
| Construction | 149 (100.0%) | 0 (0.0%) |
| Manufacturing | 165 (74.0%) | 58 (26.0%) |
| Wholesale Trade | 18 (100.0%) | 0 (0.0%) |
| Retail Trade | 87 (56.9%) | 66 (43.1%) |
| Transportation & Warehousing | 4 (4.8%) | 80 (95.2%) |
| Utilities | 0 (0.0%) | 6 (100.0%) |
| Information | 0 (0.0%) | 38 (100.0%) |
| Finance & Insurance | 52 (71.2%) | 21 (28.8%) |
| Real Estate, Rental & Leasing | 0 (0.0%) | 0 (0.0%) |
| Professional & Scientific | 0 (0.0%) | 10 (100.0%) |
| Enterprise Management | 0 (0.0%) | 0 (0.0%) |
| Administrative & Support | 0 (0.0%) | 161 (100.0%) |
| Educational Services | 13 (10.2%) | 114 (89.8%) |
| Health Care & Social Assistance | 0 (0.0%) | 75 (100.0%) |
| Arts, Entertainment & Recreation | 0 (0.0%) | 11 (100.0%) |
| Accommodation & Food Services | 98 (35.9%) | 175 (64.1%) |
| Public Administration | 122 (92.4%) | 10 (7.6%) |
| Total | 746 (45.7%) | 888 (54.3%) |
Education in West DeLand
School Enrollment in West DeLand
The most common levels of schooling among the 864 students in West DeLand are elementary school (251 | 29.0%), middle school (196 | 22.7%), and high school (182 | 21.1%).
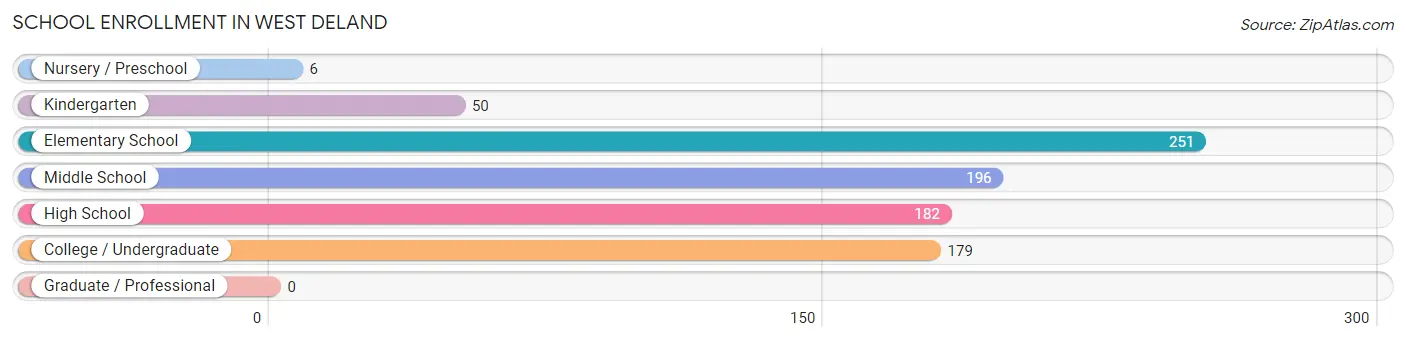
| School Level | # Students | % Students |
| Nursery / Preschool | 6 | 0.7% |
| Kindergarten | 50 | 5.8% |
| Elementary School | 251 | 29.0% |
| Middle School | 196 | 22.7% |
| High School | 182 | 21.1% |
| College / Undergraduate | 179 | 20.7% |
| Graduate / Professional | 0 | 0.0% |
| Total | 864 | 100.0% |
School Enrollment by Age by Funding Source in West DeLand
Out of a total of 864 students who are enrolled in schools in West DeLand, 77 (8.9%) attend a private institution, while the remaining 787 (91.1%) are enrolled in public schools. The age group of 3 to 4 year olds has the highest likelihood of being enrolled in private schools, with 6 (100.0% in the age bracket) enrolled. Conversely, the age group of 10 to 14 year olds has the lowest likelihood of being enrolled in a private school, with 223 (100.0% in the age bracket) attending a public institution.
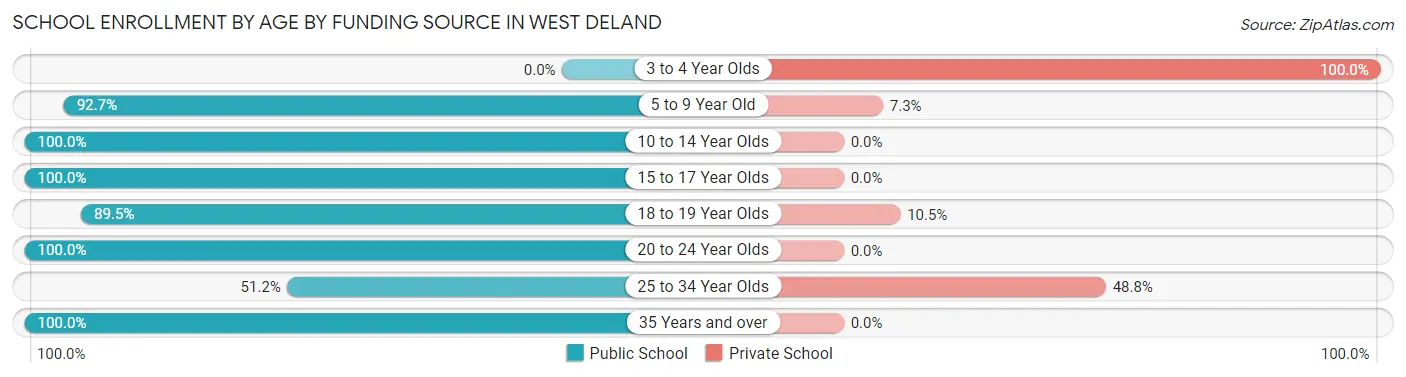
| Age Bracket | Public School | Private School |
| 3 to 4 Year Olds | 0 (0.0%) | 6 (100.0%) |
| 5 to 9 Year Old | 254 (92.7%) | 20 (7.3%) |
| 10 to 14 Year Olds | 223 (100.0%) | 0 (0.0%) |
| 15 to 17 Year Olds | 107 (100.0%) | 0 (0.0%) |
| 18 to 19 Year Olds | 85 (89.5%) | 10 (10.5%) |
| 20 to 24 Year Olds | 45 (100.0%) | 0 (0.0%) |
| 25 to 34 Year Olds | 43 (51.2%) | 41 (48.8%) |
| 35 Years and over | 30 (100.0%) | 0 (0.0%) |
| Total | 787 (91.1%) | 77 (8.9%) |
Educational Attainment by Field of Study in West DeLand
Business (147 | 28.6%), visual & performing arts (94 | 18.3%), science & technology (72 | 14.0%), education (55 | 10.7%), and social sciences (48 | 9.3%) are the most common fields of study among 514 individuals in West DeLand who have obtained a bachelor's degree or higher.
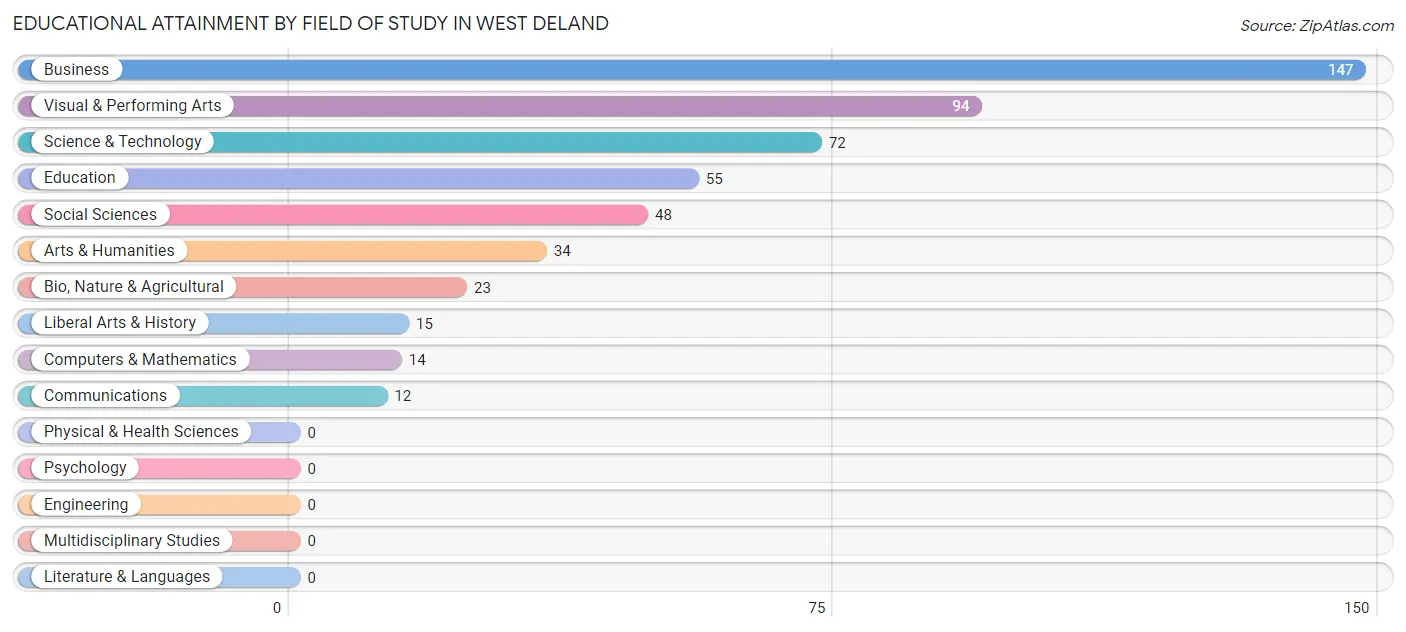
| Field of Study | # Graduates | % Graduates |
| Computers & Mathematics | 14 | 2.7% |
| Bio, Nature & Agricultural | 23 | 4.5% |
| Physical & Health Sciences | 0 | 0.0% |
| Psychology | 0 | 0.0% |
| Social Sciences | 48 | 9.3% |
| Engineering | 0 | 0.0% |
| Multidisciplinary Studies | 0 | 0.0% |
| Science & Technology | 72 | 14.0% |
| Business | 147 | 28.6% |
| Education | 55 | 10.7% |
| Literature & Languages | 0 | 0.0% |
| Liberal Arts & History | 15 | 2.9% |
| Visual & Performing Arts | 94 | 18.3% |
| Communications | 12 | 2.3% |
| Arts & Humanities | 34 | 6.6% |
| Total | 514 | 100.0% |
Transportation & Commute in West DeLand
Vehicle Availability by Sex in West DeLand
The most prevalent vehicle ownership categories in West DeLand are males with 2 vehicles (353, accounting for 51.1%) and females with 2 vehicles (373, making up 39.8%).
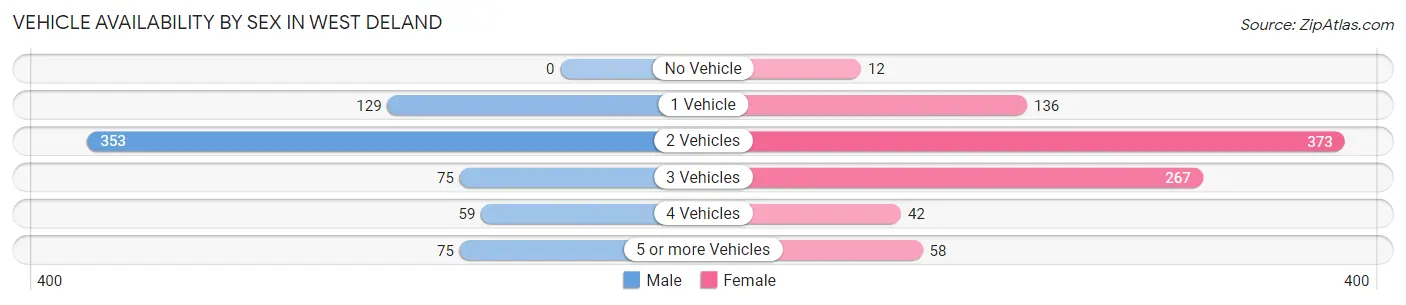
| Vehicles Available | Male | Female |
| No Vehicle | 0 (0.0%) | 12 (1.3%) |
| 1 Vehicle | 129 (18.7%) | 136 (15.3%) |
| 2 Vehicles | 353 (51.1%) | 373 (42.0%) |
| 3 Vehicles | 75 (10.8%) | 267 (30.1%) |
| 4 Vehicles | 59 (8.5%) | 42 (4.7%) |
| 5 or more Vehicles | 75 (10.8%) | 58 (6.5%) |
| Total | 691 (100.0%) | 888 (100.0%) |
Commute Time in West DeLand
The most frequently occuring commute durations in West DeLand are 5 to 9 minutes (282 commuters, 20.8%), 10 to 14 minutes (240 commuters, 17.7%), and 15 to 19 minutes (238 commuters, 17.6%).
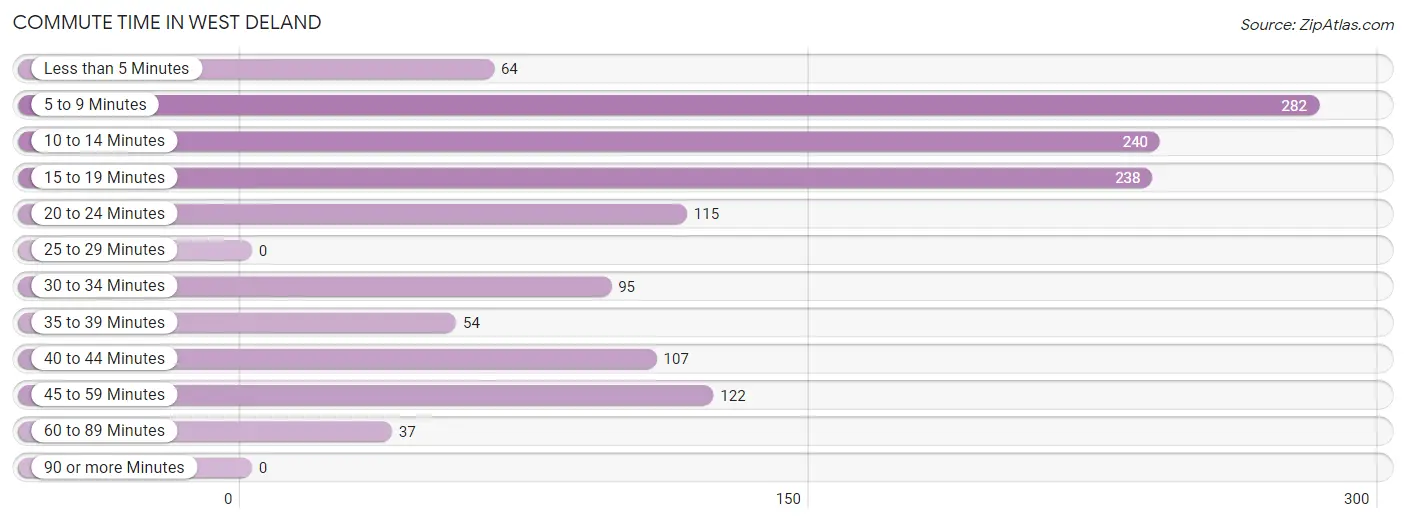
| Commute Time | # Commuters | % Commuters |
| Less than 5 Minutes | 64 | 4.7% |
| 5 to 9 Minutes | 282 | 20.8% |
| 10 to 14 Minutes | 240 | 17.7% |
| 15 to 19 Minutes | 238 | 17.6% |
| 20 to 24 Minutes | 115 | 8.5% |
| 25 to 29 Minutes | 0 | 0.0% |
| 30 to 34 Minutes | 95 | 7.0% |
| 35 to 39 Minutes | 54 | 4.0% |
| 40 to 44 Minutes | 107 | 7.9% |
| 45 to 59 Minutes | 122 | 9.0% |
| 60 to 89 Minutes | 37 | 2.7% |
| 90 or more Minutes | 0 | 0.0% |
Commute Time by Sex in West DeLand
The most common commute times in West DeLand are 5 to 9 minutes (140 commuters, 23.5%) for males and 5 to 9 minutes (142 commuters, 18.7%) for females.
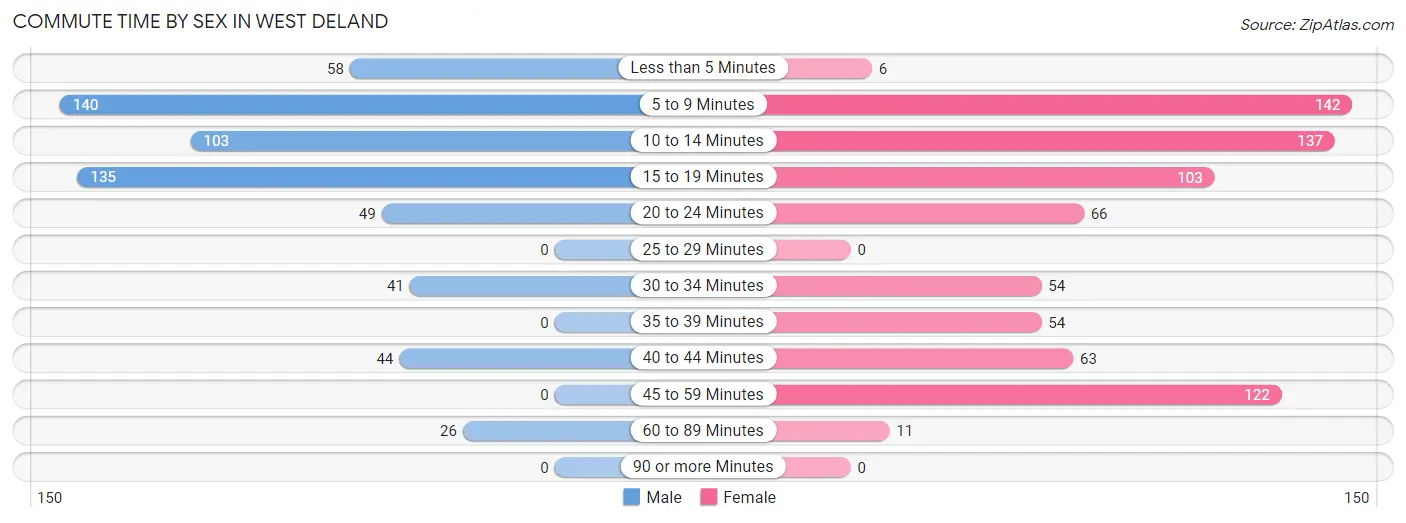
| Commute Time | Male | Female |
| Less than 5 Minutes | 58 (9.7%) | 6 (0.8%) |
| 5 to 9 Minutes | 140 (23.5%) | 142 (18.7%) |
| 10 to 14 Minutes | 103 (17.3%) | 137 (18.1%) |
| 15 to 19 Minutes | 135 (22.7%) | 103 (13.6%) |
| 20 to 24 Minutes | 49 (8.2%) | 66 (8.7%) |
| 25 to 29 Minutes | 0 (0.0%) | 0 (0.0%) |
| 30 to 34 Minutes | 41 (6.9%) | 54 (7.1%) |
| 35 to 39 Minutes | 0 (0.0%) | 54 (7.1%) |
| 40 to 44 Minutes | 44 (7.4%) | 63 (8.3%) |
| 45 to 59 Minutes | 0 (0.0%) | 122 (16.1%) |
| 60 to 89 Minutes | 26 (4.4%) | 11 (1.5%) |
| 90 or more Minutes | 0 (0.0%) | 0 (0.0%) |
Time of Departure to Work by Sex in West DeLand
The most frequent times of departure to work in West DeLand are 6:30 AM to 6:59 AM (104, 17.4%) for males and 9:00 AM to 9:59 AM (150, 19.8%) for females.
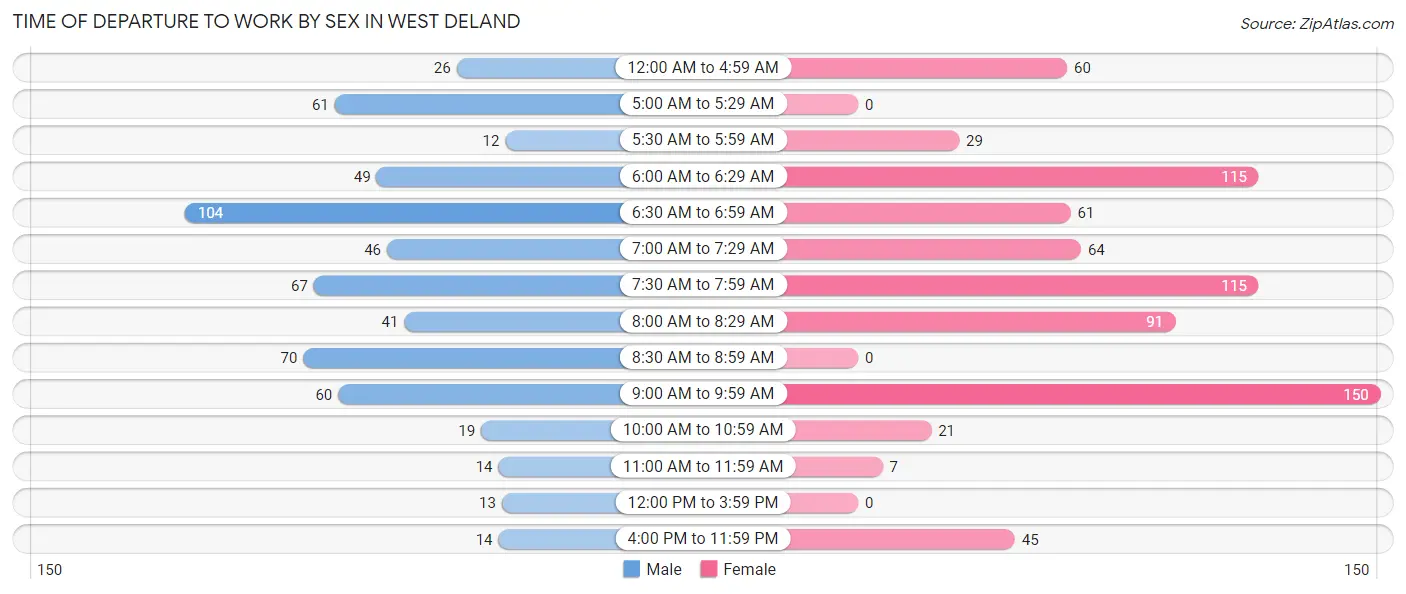
| Time of Departure | Male | Female |
| 12:00 AM to 4:59 AM | 26 (4.4%) | 60 (7.9%) |
| 5:00 AM to 5:29 AM | 61 (10.2%) | 0 (0.0%) |
| 5:30 AM to 5:59 AM | 12 (2.0%) | 29 (3.8%) |
| 6:00 AM to 6:29 AM | 49 (8.2%) | 115 (15.2%) |
| 6:30 AM to 6:59 AM | 104 (17.4%) | 61 (8.1%) |
| 7:00 AM to 7:29 AM | 46 (7.7%) | 64 (8.4%) |
| 7:30 AM to 7:59 AM | 67 (11.2%) | 115 (15.2%) |
| 8:00 AM to 8:29 AM | 41 (6.9%) | 91 (12.0%) |
| 8:30 AM to 8:59 AM | 70 (11.7%) | 0 (0.0%) |
| 9:00 AM to 9:59 AM | 60 (10.1%) | 150 (19.8%) |
| 10:00 AM to 10:59 AM | 19 (3.2%) | 21 (2.8%) |
| 11:00 AM to 11:59 AM | 14 (2.4%) | 7 (0.9%) |
| 12:00 PM to 3:59 PM | 13 (2.2%) | 0 (0.0%) |
| 4:00 PM to 11:59 PM | 14 (2.4%) | 45 (5.9%) |
| Total | 596 (100.0%) | 758 (100.0%) |
Housing Occupancy in West DeLand
Occupancy by Ownership in West DeLand
Of the total 1,296 dwellings in West DeLand, owner-occupied units account for 1,046 (80.7%), while renter-occupied units make up 250 (19.3%).
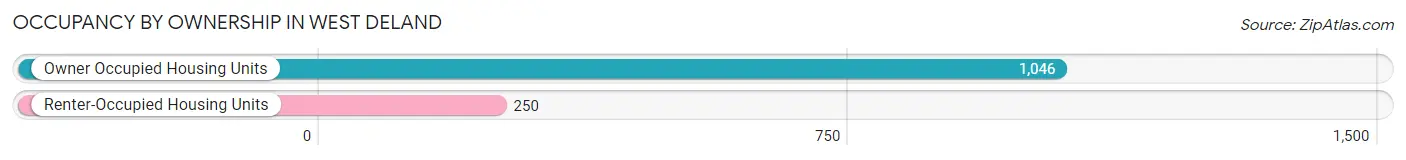
| Occupancy | # Housing Units | % Housing Units |
| Owner Occupied Housing Units | 1,046 | 80.7% |
| Renter-Occupied Housing Units | 250 | 19.3% |
| Total Occupied Housing Units | 1,296 | 100.0% |
Occupancy by Household Size in West DeLand
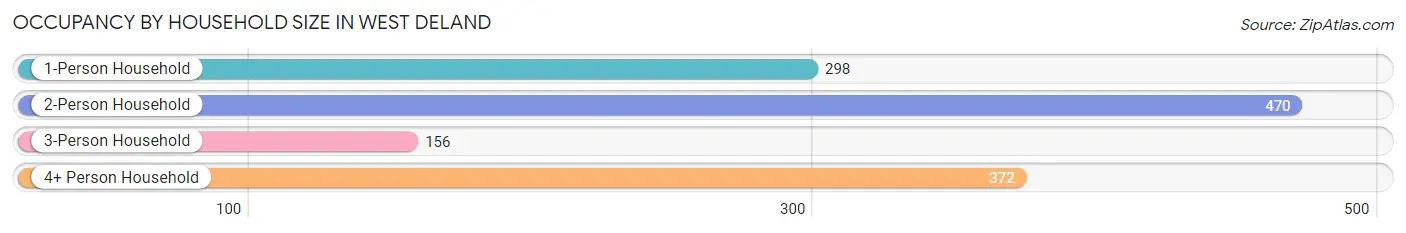
| Household Size | # Housing Units | % Housing Units |
| 1-Person Household | 298 | 23.0% |
| 2-Person Household | 470 | 36.3% |
| 3-Person Household | 156 | 12.0% |
| 4+ Person Household | 372 | 28.7% |
| Total Housing Units | 1,296 | 100.0% |
Occupancy by Ownership by Household Size in West DeLand
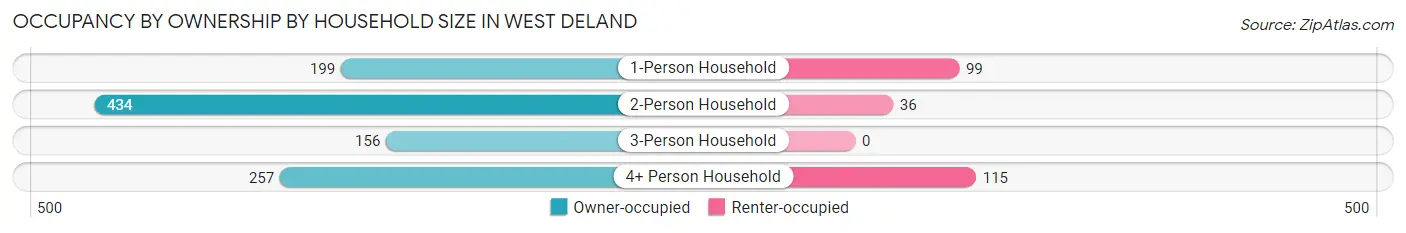
| Household Size | Owner-occupied | Renter-occupied |
| 1-Person Household | 199 (66.8%) | 99 (33.2%) |
| 2-Person Household | 434 (92.3%) | 36 (7.7%) |
| 3-Person Household | 156 (100.0%) | 0 (0.0%) |
| 4+ Person Household | 257 (69.1%) | 115 (30.9%) |
| Total Housing Units | 1,046 (80.7%) | 250 (19.3%) |
Occupancy by Educational Attainment in West DeLand
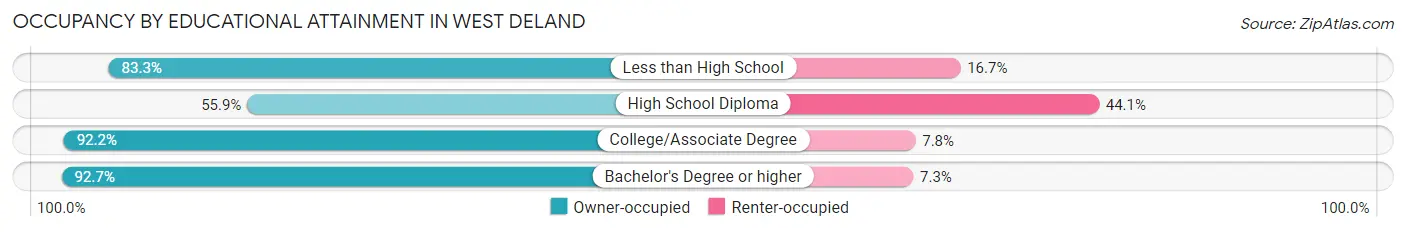
| Household Size | Owner-occupied | Renter-occupied |
| Less than High School | 105 (83.3%) | 21 (16.7%) |
| High School Diploma | 214 (55.9%) | 169 (44.1%) |
| College/Associate Degree | 499 (92.2%) | 42 (7.8%) |
| Bachelor's Degree or higher | 228 (92.7%) | 18 (7.3%) |
Occupancy by Age of Householder in West DeLand
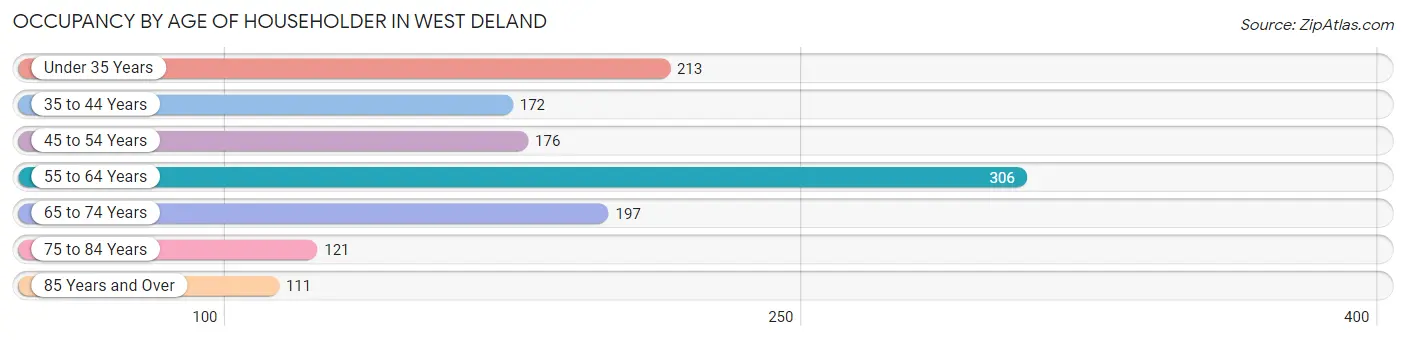
| Age Bracket | # Households | % Households |
| Under 35 Years | 213 | 16.4% |
| 35 to 44 Years | 172 | 13.3% |
| 45 to 54 Years | 176 | 13.6% |
| 55 to 64 Years | 306 | 23.6% |
| 65 to 74 Years | 197 | 15.2% |
| 75 to 84 Years | 121 | 9.3% |
| 85 Years and Over | 111 | 8.6% |
| Total | 1,296 | 100.0% |
Housing Finances in West DeLand
Median Income by Occupancy in West DeLand
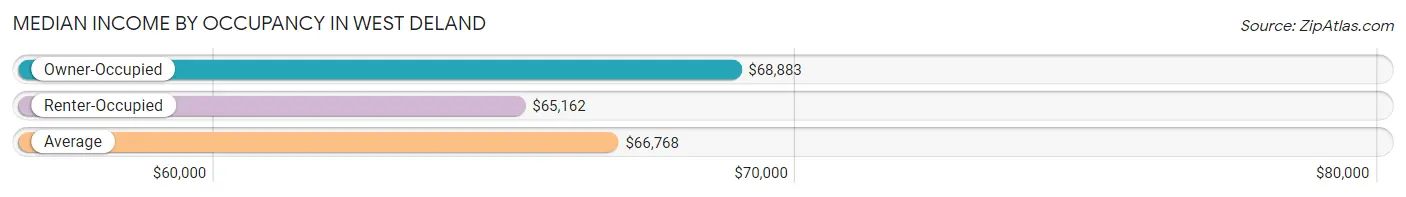
| Occupancy Type | # Households | Median Income |
| Owner-Occupied | 1,046 (80.7%) | $68,883 |
| Renter-Occupied | 250 (19.3%) | $65,162 |
| Average | 1,296 (100.0%) | $66,768 |
Occupancy by Householder Income Bracket in West DeLand
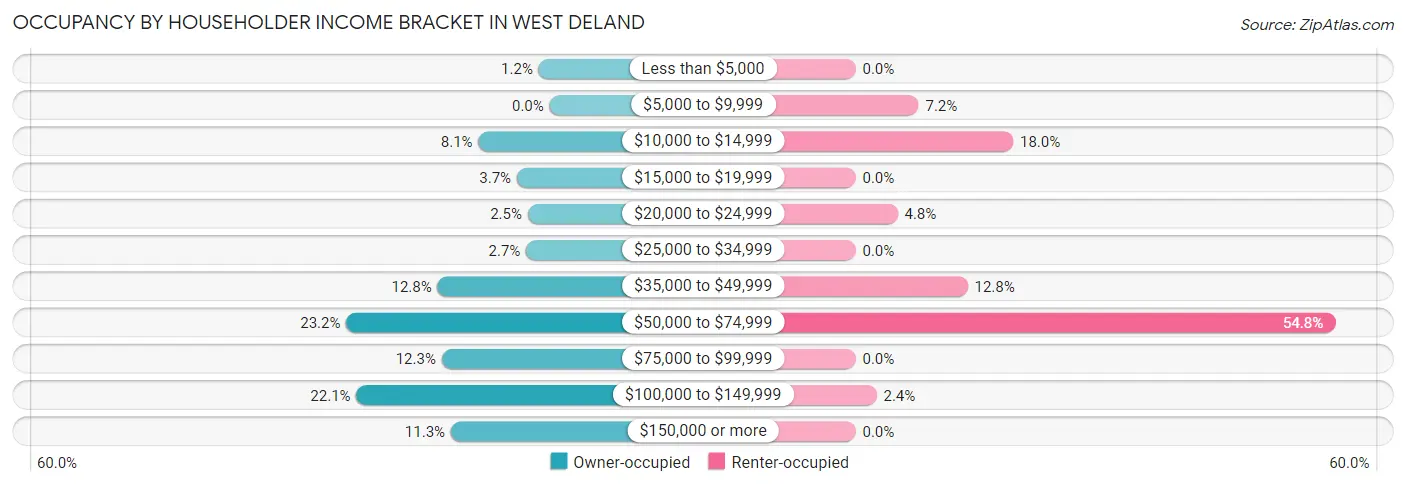
| Income Bracket | Owner-occupied | Renter-occupied |
| Less than $5,000 | 13 (1.2%) | 0 (0.0%) |
| $5,000 to $9,999 | 0 (0.0%) | 18 (7.2%) |
| $10,000 to $14,999 | 85 (8.1%) | 45 (18.0%) |
| $15,000 to $19,999 | 39 (3.7%) | 0 (0.0%) |
| $20,000 to $24,999 | 26 (2.5%) | 12 (4.8%) |
| $25,000 to $34,999 | 28 (2.7%) | 0 (0.0%) |
| $35,000 to $49,999 | 134 (12.8%) | 32 (12.8%) |
| $50,000 to $74,999 | 243 (23.2%) | 137 (54.8%) |
| $75,000 to $99,999 | 129 (12.3%) | 0 (0.0%) |
| $100,000 to $149,999 | 231 (22.1%) | 6 (2.4%) |
| $150,000 or more | 118 (11.3%) | 0 (0.0%) |
| Total | 1,046 (100.0%) | 250 (100.0%) |
Monthly Housing Cost Tiers in West DeLand
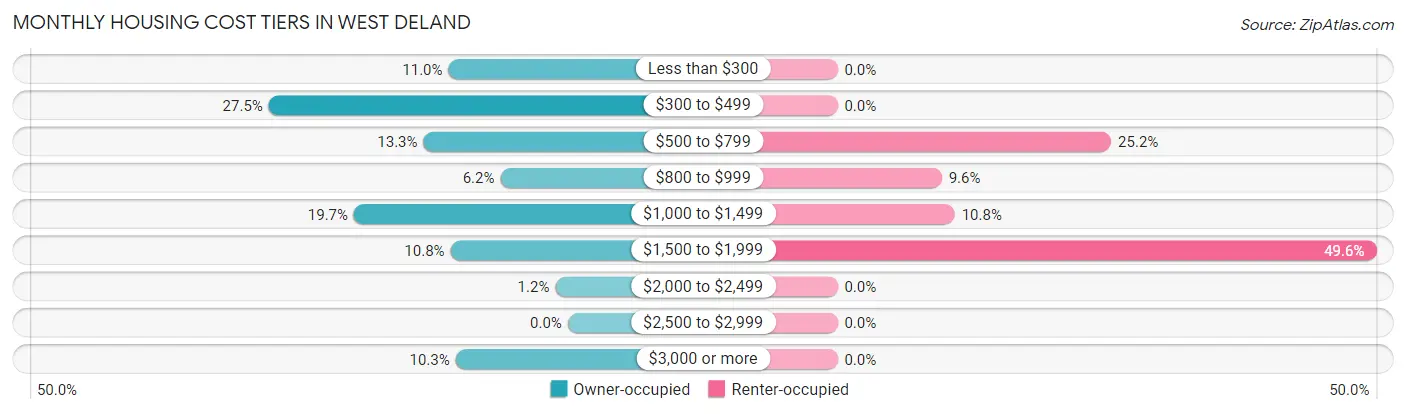
| Monthly Cost | Owner-occupied | Renter-occupied |
| Less than $300 | 115 (11.0%) | 0 (0.0%) |
| $300 to $499 | 288 (27.5%) | 0 (0.0%) |
| $500 to $799 | 139 (13.3%) | 63 (25.2%) |
| $800 to $999 | 65 (6.2%) | 24 (9.6%) |
| $1,000 to $1,499 | 206 (19.7%) | 27 (10.8%) |
| $1,500 to $1,999 | 113 (10.8%) | 124 (49.6%) |
| $2,000 to $2,499 | 12 (1.1%) | 0 (0.0%) |
| $2,500 to $2,999 | 0 (0.0%) | 0 (0.0%) |
| $3,000 or more | 108 (10.3%) | 0 (0.0%) |
| Total | 1,046 (100.0%) | 250 (100.0%) |
Physical Housing Characteristics in West DeLand
Housing Structures in West DeLand
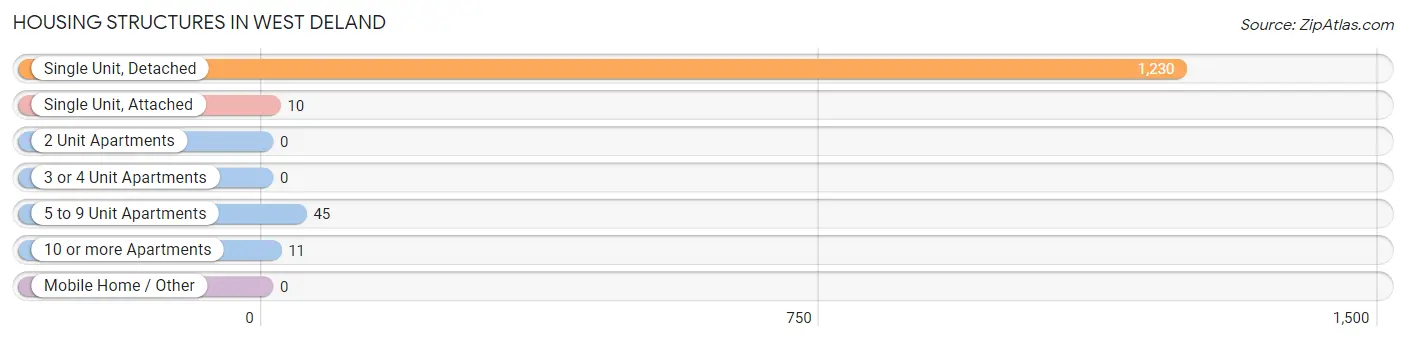
| Structure Type | # Housing Units | % Housing Units |
| Single Unit, Detached | 1,230 | 94.9% |
| Single Unit, Attached | 10 | 0.8% |
| 2 Unit Apartments | 0 | 0.0% |
| 3 or 4 Unit Apartments | 0 | 0.0% |
| 5 to 9 Unit Apartments | 45 | 3.5% |
| 10 or more Apartments | 11 | 0.9% |
| Mobile Home / Other | 0 | 0.0% |
| Total | 1,296 | 100.0% |
Housing Structures by Occupancy in West DeLand
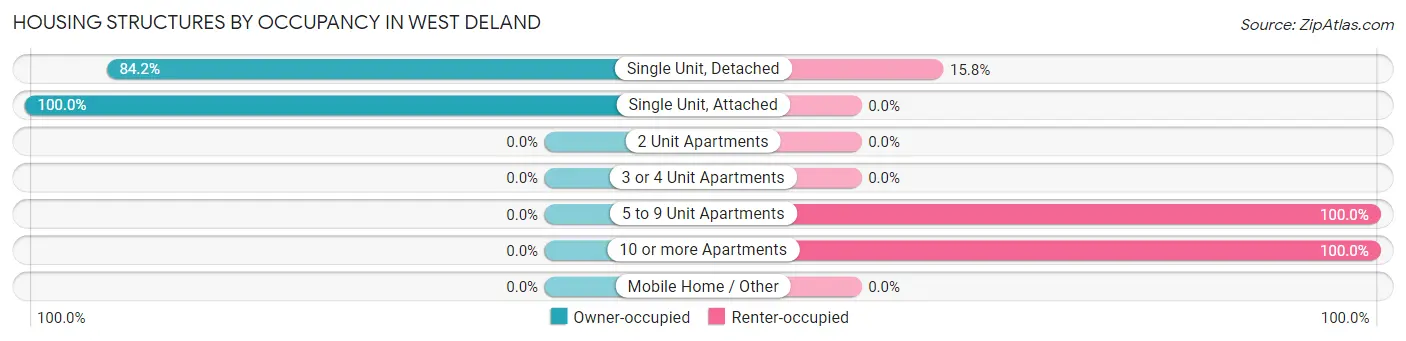
| Structure Type | Owner-occupied | Renter-occupied |
| Single Unit, Detached | 1,036 (84.2%) | 194 (15.8%) |
| Single Unit, Attached | 10 (100.0%) | 0 (0.0%) |
| 2 Unit Apartments | 0 (0.0%) | 0 (0.0%) |
| 3 or 4 Unit Apartments | 0 (0.0%) | 0 (0.0%) |
| 5 to 9 Unit Apartments | 0 (0.0%) | 45 (100.0%) |
| 10 or more Apartments | 0 (0.0%) | 11 (100.0%) |
| Mobile Home / Other | 0 (0.0%) | 0 (0.0%) |
| Total | 1,046 (80.7%) | 250 (19.3%) |
Housing Structures by Number of Rooms in West DeLand
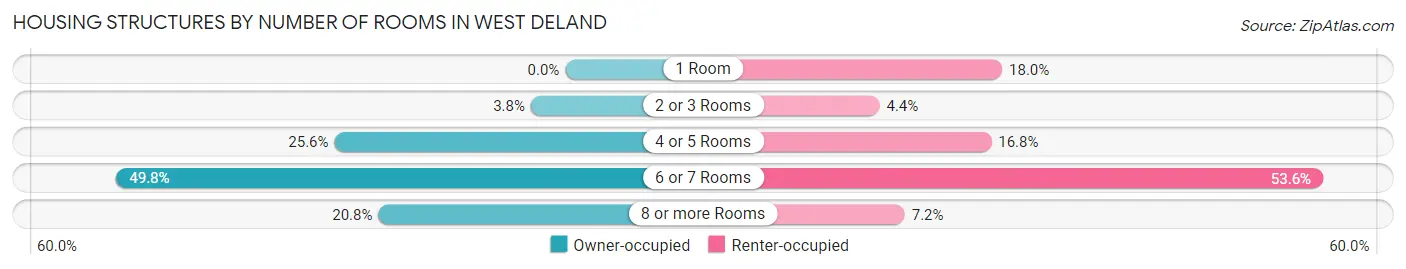
| Number of Rooms | Owner-occupied | Renter-occupied |
| 1 Room | 0 (0.0%) | 45 (18.0%) |
| 2 or 3 Rooms | 40 (3.8%) | 11 (4.4%) |
| 4 or 5 Rooms | 268 (25.6%) | 42 (16.8%) |
| 6 or 7 Rooms | 521 (49.8%) | 134 (53.6%) |
| 8 or more Rooms | 217 (20.7%) | 18 (7.2%) |
| Total | 1,046 (100.0%) | 250 (100.0%) |
Housing Structure by Heating Type in West DeLand
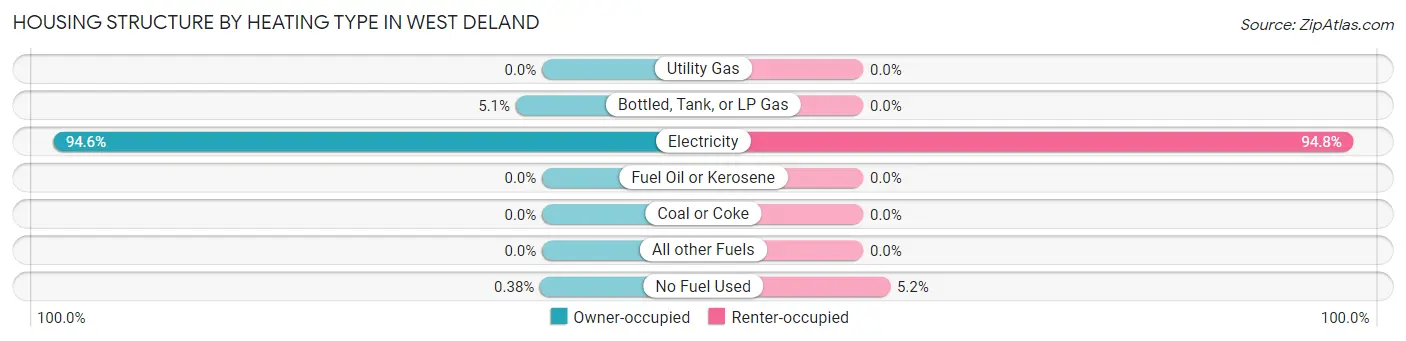
| Heating Type | Owner-occupied | Renter-occupied |
| Utility Gas | 0 (0.0%) | 0 (0.0%) |
| Bottled, Tank, or LP Gas | 53 (5.1%) | 0 (0.0%) |
| Electricity | 989 (94.6%) | 237 (94.8%) |
| Fuel Oil or Kerosene | 0 (0.0%) | 0 (0.0%) |
| Coal or Coke | 0 (0.0%) | 0 (0.0%) |
| All other Fuels | 0 (0.0%) | 0 (0.0%) |
| No Fuel Used | 4 (0.4%) | 13 (5.2%) |
| Total | 1,046 (100.0%) | 250 (100.0%) |
Household Vehicle Usage in West DeLand
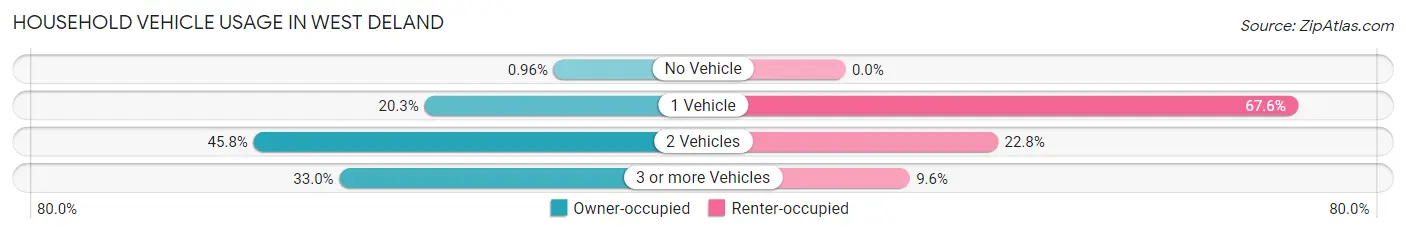
| Vehicles per Household | Owner-occupied | Renter-occupied |
| No Vehicle | 10 (1.0%) | 0 (0.0%) |
| 1 Vehicle | 212 (20.3%) | 169 (67.6%) |
| 2 Vehicles | 479 (45.8%) | 57 (22.8%) |
| 3 or more Vehicles | 345 (33.0%) | 24 (9.6%) |
| Total | 1,046 (100.0%) | 250 (100.0%) |
Real Estate & Mortgages in West DeLand
Real Estate and Mortgage Overview in West DeLand
| Characteristic | Without Mortgage | With Mortgage |
| Housing Units | 492 | 554 |
| Median Property Value | $187,500 | $236,900 |
| Median Household Income | $65,254 | $61 |
| Monthly Housing Costs | $412 | $108 |
| Real Estate Taxes | $1,586 | $26 |
Property Value by Mortgage Status in West DeLand
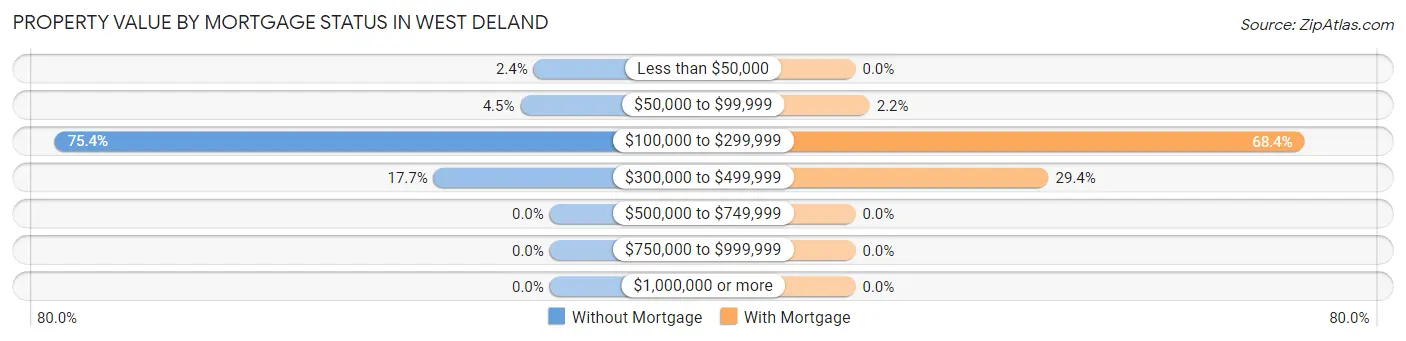
| Property Value | Without Mortgage | With Mortgage |
| Less than $50,000 | 12 (2.4%) | 0 (0.0%) |
| $50,000 to $99,999 | 22 (4.5%) | 12 (2.2%) |
| $100,000 to $299,999 | 371 (75.4%) | 379 (68.4%) |
| $300,000 to $499,999 | 87 (17.7%) | 163 (29.4%) |
| $500,000 to $749,999 | 0 (0.0%) | 0 (0.0%) |
| $750,000 to $999,999 | 0 (0.0%) | 0 (0.0%) |
| $1,000,000 or more | 0 (0.0%) | 0 (0.0%) |
| Total | 492 (100.0%) | 554 (100.0%) |
Household Income by Mortgage Status in West DeLand
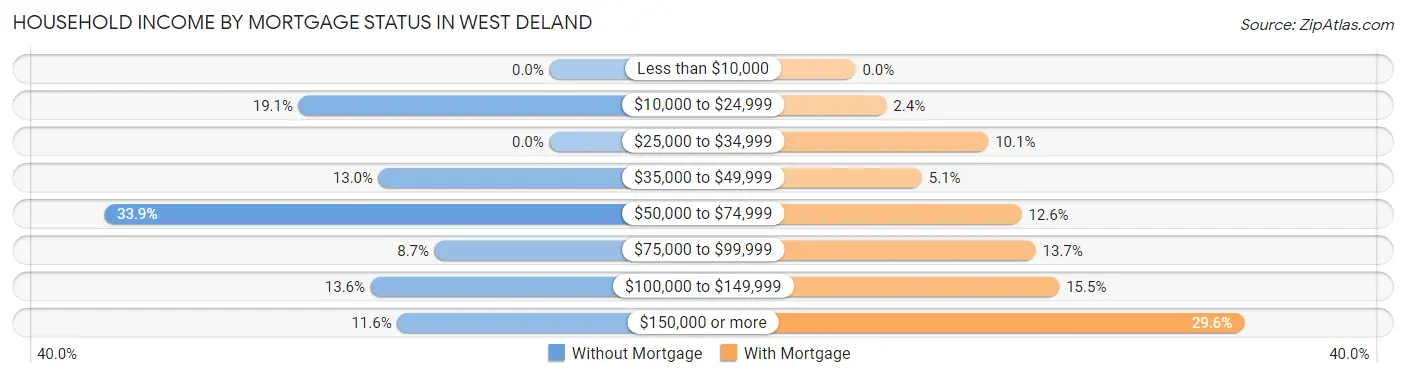
| Household Income | Without Mortgage | With Mortgage |
| Less than $10,000 | 0 (0.0%) | 0 (0.0%) |
| $10,000 to $24,999 | 94 (19.1%) | 13 (2.4%) |
| $25,000 to $34,999 | 0 (0.0%) | 56 (10.1%) |
| $35,000 to $49,999 | 64 (13.0%) | 28 (5.1%) |
| $50,000 to $74,999 | 167 (33.9%) | 70 (12.6%) |
| $75,000 to $99,999 | 43 (8.7%) | 76 (13.7%) |
| $100,000 to $149,999 | 67 (13.6%) | 86 (15.5%) |
| $150,000 or more | 57 (11.6%) | 164 (29.6%) |
| Total | 492 (100.0%) | 554 (100.0%) |
Property Value to Household Income Ratio in West DeLand
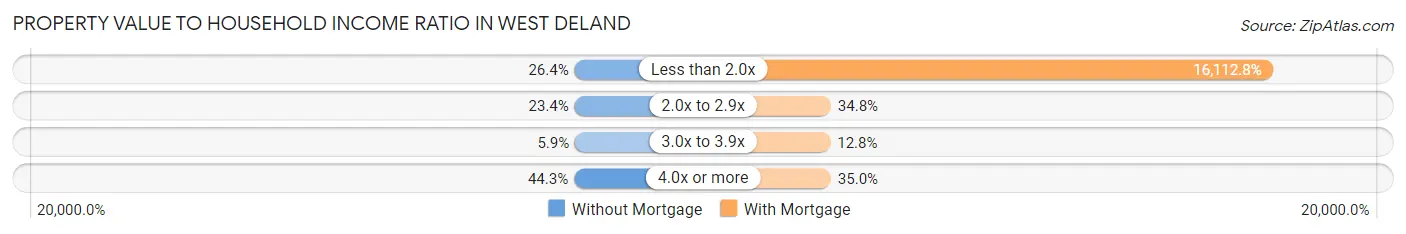
| Value-to-Income Ratio | Without Mortgage | With Mortgage |
| Less than 2.0x | 130 (26.4%) | 89,265 (16,112.8%) |
| 2.0x to 2.9x | 115 (23.4%) | 193 (34.8%) |
| 3.0x to 3.9x | 29 (5.9%) | 71 (12.8%) |
| 4.0x or more | 218 (44.3%) | 194 (35.0%) |
| Total | 492 (100.0%) | 554 (100.0%) |
Real Estate Taxes by Mortgage Status in West DeLand
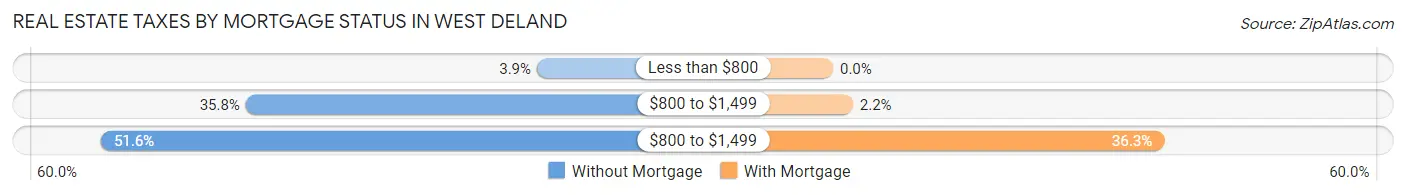
| Property Taxes | Without Mortgage | With Mortgage |
| Less than $800 | 19 (3.9%) | 0 (0.0%) |
| $800 to $1,499 | 176 (35.8%) | 12 (2.2%) |
| $800 to $1,499 | 254 (51.6%) | 201 (36.3%) |
| Total | 492 (100.0%) | 554 (100.0%) |
Health & Disability in West DeLand
Health Insurance Coverage by Age in West DeLand
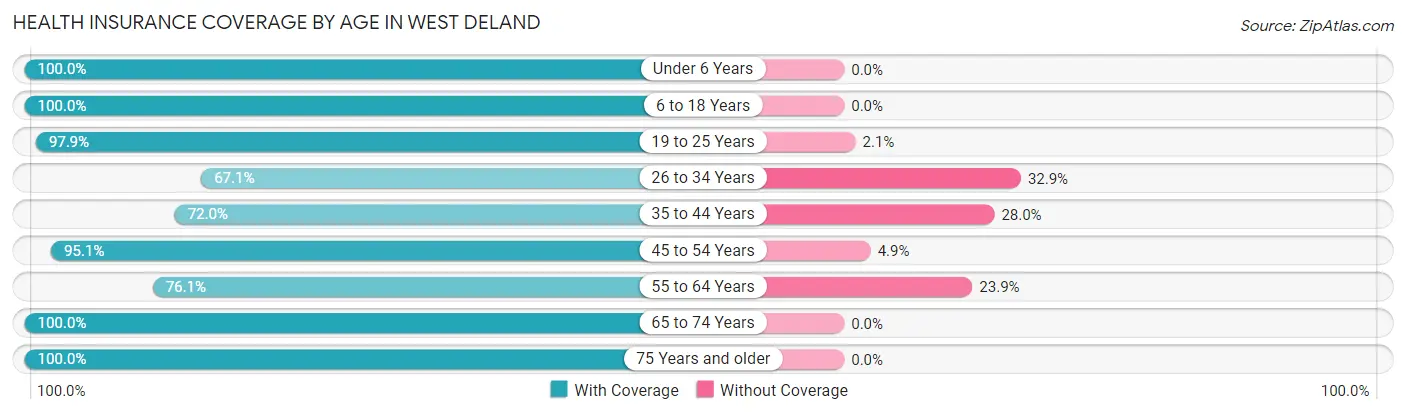
| Age Bracket | With Coverage | Without Coverage |
| Under 6 Years | 81 (100.0%) | 0 (0.0%) |
| 6 to 18 Years | 693 (100.0%) | 0 (0.0%) |
| 19 to 25 Years | 324 (97.9%) | 7 (2.1%) |
| 26 to 34 Years | 342 (67.1%) | 168 (32.9%) |
| 35 to 44 Years | 252 (72.0%) | 98 (28.0%) |
| 45 to 54 Years | 347 (95.1%) | 18 (4.9%) |
| 55 to 64 Years | 411 (76.1%) | 129 (23.9%) |
| 65 to 74 Years | 389 (100.0%) | 0 (0.0%) |
| 75 Years and older | 308 (100.0%) | 0 (0.0%) |
| Total | 3,147 (88.2%) | 420 (11.8%) |
Health Insurance Coverage by Citizenship Status in West DeLand
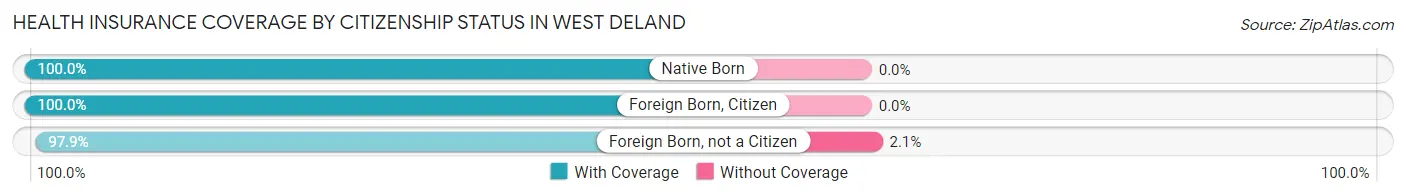
| Citizenship Status | With Coverage | Without Coverage |
| Native Born | 81 (100.0%) | 0 (0.0%) |
| Foreign Born, Citizen | 693 (100.0%) | 0 (0.0%) |
| Foreign Born, not a Citizen | 324 (97.9%) | 7 (2.1%) |
Health Insurance Coverage by Household Income in West DeLand
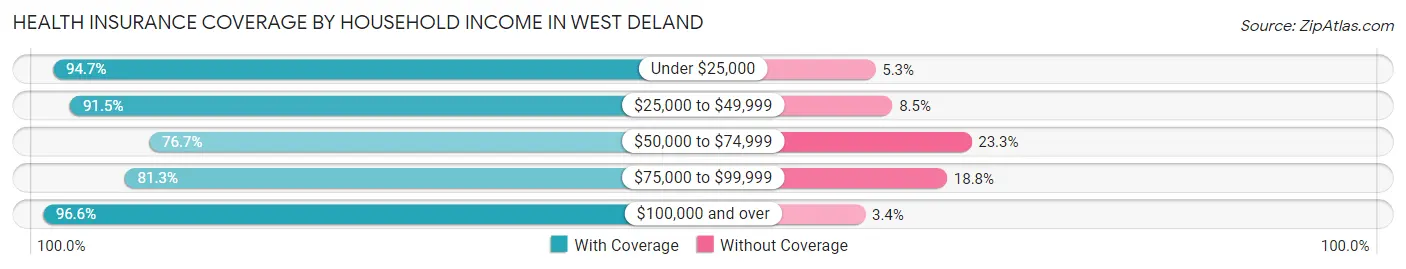
| Household Income | With Coverage | Without Coverage |
| Under $25,000 | 319 (94.7%) | 18 (5.3%) |
| $25,000 to $49,999 | 398 (91.5%) | 37 (8.5%) |
| $50,000 to $74,999 | 871 (76.7%) | 265 (23.3%) |
| $75,000 to $99,999 | 221 (81.2%) | 51 (18.8%) |
| $100,000 and over | 1,329 (96.6%) | 47 (3.4%) |
Public vs Private Health Insurance Coverage by Age in West DeLand
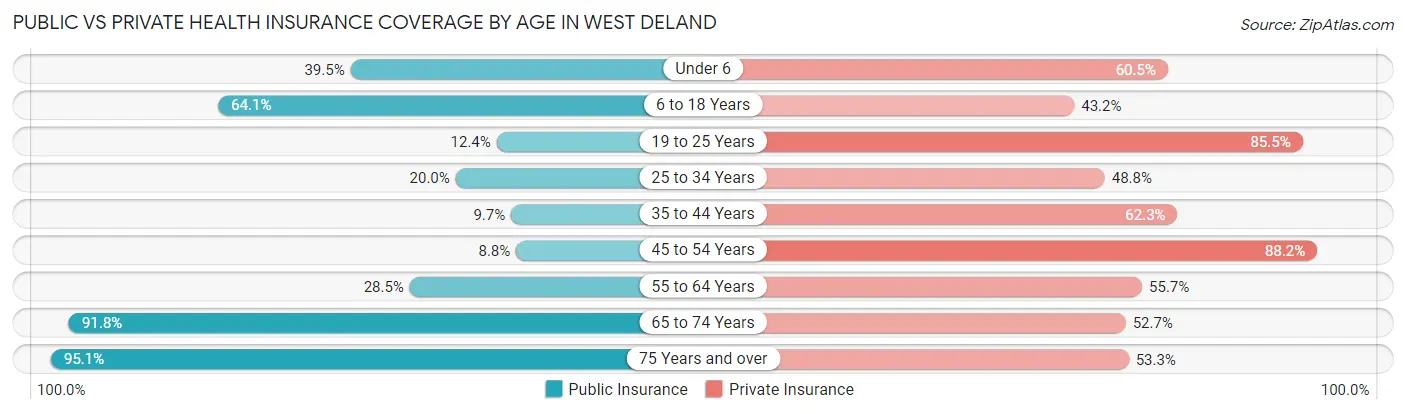
| Age Bracket | Public Insurance | Private Insurance |
| Under 6 | 32 (39.5%) | 49 (60.5%) |
| 6 to 18 Years | 444 (64.1%) | 299 (43.1%) |
| 19 to 25 Years | 41 (12.4%) | 283 (85.5%) |
| 25 to 34 Years | 102 (20.0%) | 249 (48.8%) |
| 35 to 44 Years | 34 (9.7%) | 218 (62.3%) |
| 45 to 54 Years | 32 (8.8%) | 322 (88.2%) |
| 55 to 64 Years | 154 (28.5%) | 301 (55.7%) |
| 65 to 74 Years | 357 (91.8%) | 205 (52.7%) |
| 75 Years and over | 293 (95.1%) | 164 (53.2%) |
| Total | 1,489 (41.7%) | 2,090 (58.6%) |
Disability Status by Sex by Age in West DeLand
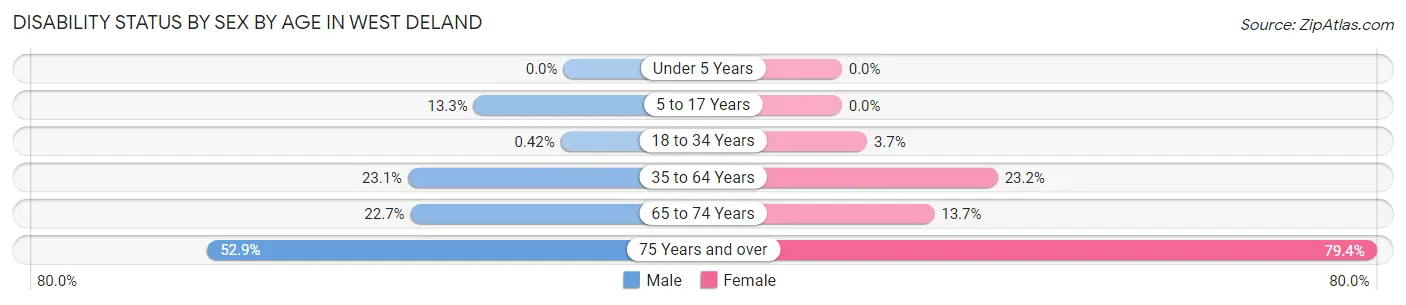
| Age Bracket | Male | Female |
| Under 5 Years | 0 (0.0%) | 0 (0.0%) |
| 5 to 17 Years | 50 (13.3%) | 0 (0.0%) |
| 18 to 34 Years | 2 (0.4%) | 17 (3.7%) |
| 35 to 64 Years | 162 (23.1%) | 128 (23.2%) |
| 65 to 74 Years | 47 (22.7%) | 25 (13.7%) |
| 75 Years and over | 55 (52.9%) | 162 (79.4%) |
Disability Class by Sex by Age in West DeLand
Disability Class: Hearing Difficulty
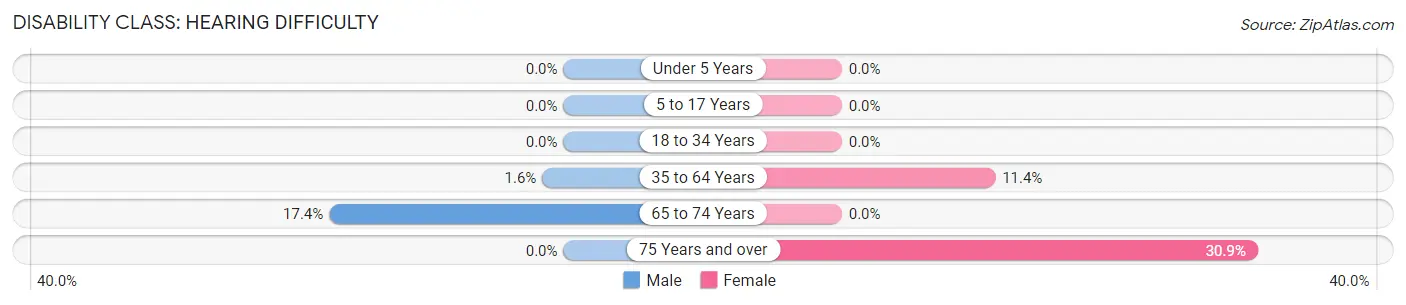
| Age Bracket | Male | Female |
| Under 5 Years | 0 (0.0%) | 0 (0.0%) |
| 5 to 17 Years | 0 (0.0%) | 0 (0.0%) |
| 18 to 34 Years | 0 (0.0%) | 0 (0.0%) |
| 35 to 64 Years | 11 (1.6%) | 63 (11.4%) |
| 65 to 74 Years | 36 (17.4%) | 0 (0.0%) |
| 75 Years and over | 0 (0.0%) | 63 (30.9%) |
Disability Class: Vision Difficulty
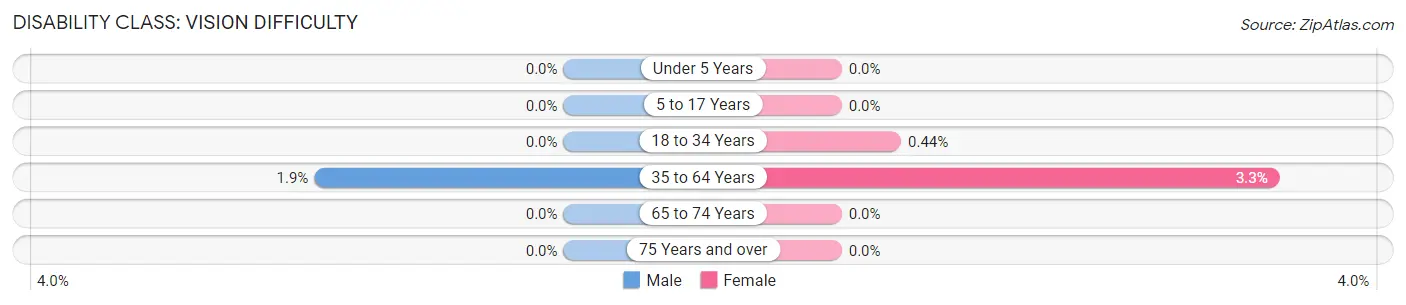
| Age Bracket | Male | Female |
| Under 5 Years | 0 (0.0%) | 0 (0.0%) |
| 5 to 17 Years | 0 (0.0%) | 0 (0.0%) |
| 18 to 34 Years | 0 (0.0%) | 2 (0.4%) |
| 35 to 64 Years | 13 (1.8%) | 18 (3.3%) |
| 65 to 74 Years | 0 (0.0%) | 0 (0.0%) |
| 75 Years and over | 0 (0.0%) | 0 (0.0%) |
Disability Class: Cognitive Difficulty
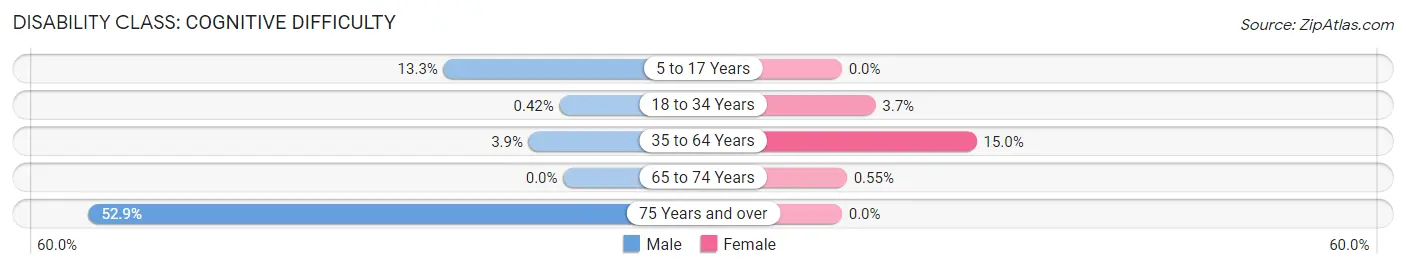
| Age Bracket | Male | Female |
| 5 to 17 Years | 50 (13.3%) | 0 (0.0%) |
| 18 to 34 Years | 2 (0.4%) | 17 (3.7%) |
| 35 to 64 Years | 27 (3.8%) | 83 (15.0%) |
| 65 to 74 Years | 0 (0.0%) | 1 (0.5%) |
| 75 Years and over | 55 (52.9%) | 0 (0.0%) |
Disability Class: Ambulatory Difficulty
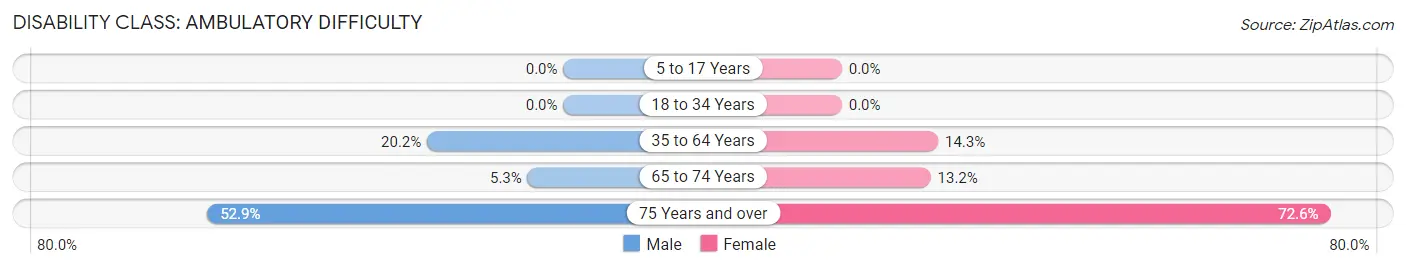
| Age Bracket | Male | Female |
| 5 to 17 Years | 0 (0.0%) | 0 (0.0%) |
| 18 to 34 Years | 0 (0.0%) | 0 (0.0%) |
| 35 to 64 Years | 142 (20.2%) | 79 (14.3%) |
| 65 to 74 Years | 11 (5.3%) | 24 (13.2%) |
| 75 Years and over | 55 (52.9%) | 148 (72.6%) |
Disability Class: Self-Care Difficulty
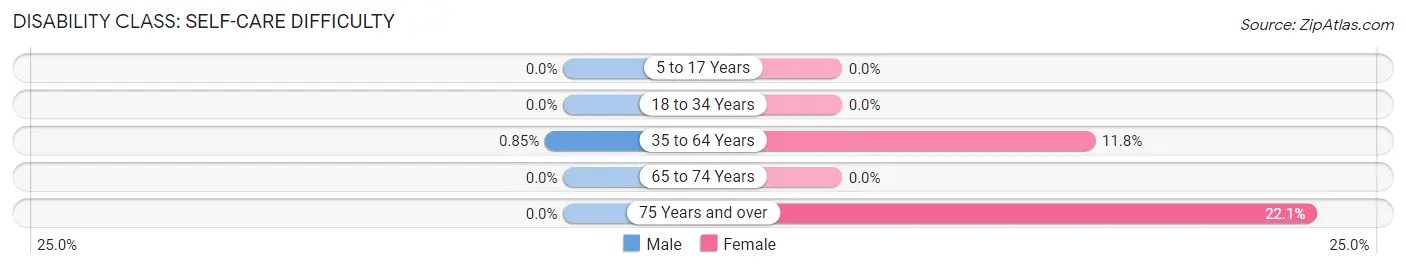
| Age Bracket | Male | Female |
| 5 to 17 Years | 0 (0.0%) | 0 (0.0%) |
| 18 to 34 Years | 0 (0.0%) | 0 (0.0%) |
| 35 to 64 Years | 6 (0.9%) | 65 (11.7%) |
| 65 to 74 Years | 0 (0.0%) | 0 (0.0%) |
| 75 Years and over | 0 (0.0%) | 45 (22.1%) |
Technology Access in West DeLand
Computing Device Access in West DeLand
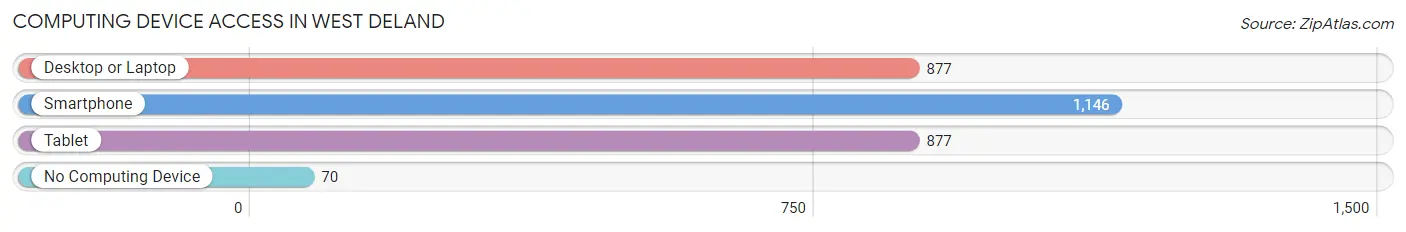
| Device Type | # Households | % Households |
| Desktop or Laptop | 877 | 67.7% |
| Smartphone | 1,146 | 88.4% |
| Tablet | 877 | 67.7% |
| No Computing Device | 70 | 5.4% |
| Total | 1,296 | 100.0% |
Internet Access in West DeLand
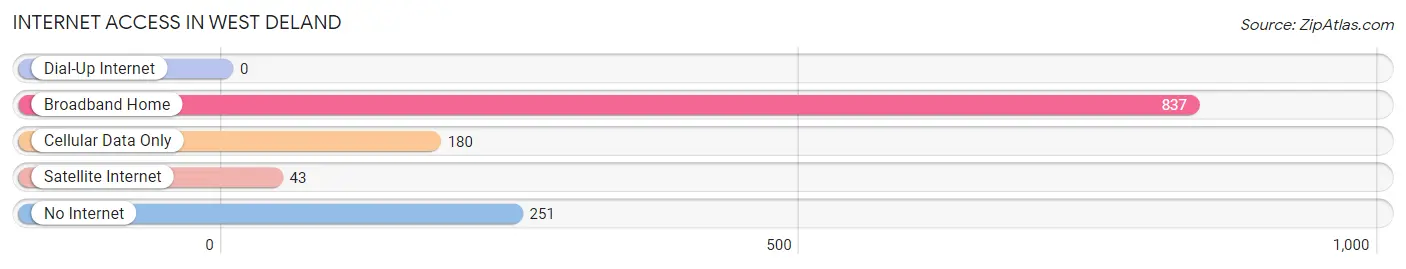
| Internet Type | # Households | % Households |
| Dial-Up Internet | 0 | 0.0% |
| Broadband Home | 837 | 64.6% |
| Cellular Data Only | 180 | 13.9% |
| Satellite Internet | 43 | 3.3% |
| No Internet | 251 | 19.4% |
| Total | 1,296 | 100.0% |
West DeLand Summary
West Deland, FL is a small city located in Volusia County, Florida. It is situated on the western side of the St. Johns River, about 20 miles north of Daytona Beach. The city has a population of approximately 8,000 people and covers an area of about 4.5 square miles.
History
West Deland was founded in 1882 by a group of settlers from the nearby town of Deland. The settlers were looking for a place to settle and start a new life. The area was originally known as West Deland, but the name was changed to West Deland in 1887. The city was incorporated in 1891 and has remained a small, rural community ever since.
Geography
West Deland is located in the northern part of Volusia County, Florida. It is situated on the western side of the St. Johns River, about 20 miles north of Daytona Beach. The city has a total area of 4.5 square miles, all of which is land. The terrain is mostly flat, with some rolling hills in the northern part of the city. The climate is humid subtropical, with hot, humid summers and mild winters.
Economy
West Deland’s economy is largely based on agriculture and tourism. The city is home to several farms, which produce a variety of crops, including citrus fruits, vegetables, and hay. The city also has a thriving tourism industry, with many visitors coming to enjoy the area’s natural beauty and outdoor activities.
Demographics
As of the 2010 census, West Deland had a population of 8,000 people. The racial makeup of the city was 79.2% White, 14.2% African American, 0.7% Native American, 0.7% Asian, 0.1% Pacific Islander, and 4.8% from other races. The median household income was $37,917, and the median family income was $45,917. The per capita income was $19,917.
West Deland is a small, rural city with a rich history and a diverse population. The city’s economy is largely based on agriculture and tourism, and the city is home to many farms and outdoor activities. The city has a population of 8,000 people, with a diverse racial makeup and a median household income of $37,917. West Deland is a great place to live and work, and it is a great place to visit.
Common Questions
What is Per Capita Income in West DeLand?
Per Capita income in West DeLand is $29,975.
What is the Median Family Income in West DeLand?
Median Family Income in West DeLand is $69,828.
What is the Median Household income in West DeLand?
Median Household Income in West DeLand is $66,768.
What is Income or Wage Gap in West DeLand?
Income or Wage Gap in West DeLand is 19.4%.
Women in West DeLand earn 80.6 cents for every dollar earned by a man.
What is Inequality or Gini Index in West DeLand?
Inequality or Gini Index in West DeLand is 0.40.
What is the Total Population of West DeLand?
Total Population of West DeLand is 3,574.
What is the Total Male Population of West DeLand?
Total Male Population of West DeLand is 1,865.
What is the Total Female Population of West DeLand?
Total Female Population of West DeLand is 1,709.
What is the Ratio of Males per 100 Females in West DeLand?
There are 109.13 Males per 100 Females in West DeLand.
What is the Ratio of Females per 100 Males in West DeLand?
There are 91.64 Females per 100 Males in West DeLand.
What is the Median Population Age in West DeLand?
Median Population Age in West DeLand is 40.1 Years.
What is the Average Family Size in West DeLand
Average Family Size in West DeLand is 3.4 People.
What is the Average Household Size in West DeLand
Average Household Size in West DeLand is 2.7 People.
How Large is the Labor Force in West DeLand?
There are 1,784 People in the Labor Forcein in West DeLand.
What is the Percentage of People in the Labor Force in West DeLand?
60.0% of People are in the Labor Force in West DeLand.
What is the Unemployment Rate in West DeLand?
Unemployment Rate in West DeLand is 8.4%.