Springfield, FL Map & Demographics
Springfield Map
Springfield Overview
$25,345
PER CAPITA INCOME
$60,376
AVG FAMILY INCOME
$52,188
AVG HOUSEHOLD INCOME
32.6%
WAGE / INCOME GAP [ % ]
67.4¢/ $1
WAGE / INCOME GAP [ $ ]
$15,285
FAMILY INCOME DEFICIT
0.35
INEQUALITY / GINI INDEX
8,295
TOTAL POPULATION
4,314
MALE POPULATION
3,981
FEMALE POPULATION
108.36
MALES / 100 FEMALES
92.28
FEMALES / 100 MALES
42.2
MEDIAN AGE
3.0
AVG FAMILY SIZE
2.3
AVG HOUSEHOLD SIZE
4,014
LABOR FORCE [ PEOPLE ]
56.2%
PERCENT IN LABOR FORCE
1.2%
UNEMPLOYMENT RATE
Income in Springfield
Income Overview in Springfield
Per Capita Income in Springfield is $25,345, while median incomes of families and households are $60,376 and $52,188 respectively.
| Characteristic | Number | Measure |
| Per Capita Income | 8,295 | $25,345 |
| Median Family Income | 2,085 | $60,376 |
| Mean Family Income | 2,085 | $66,077 |
| Median Household Income | 3,490 | $52,188 |
| Mean Household Income | 3,490 | $60,649 |
| Income Deficit | 2,085 | $15,285 |
| Wage / Income Gap (%) | 8,295 | 32.64% |
| Wage / Income Gap ($) | 8,295 | 67.36¢ per $1 |
| Gini / Inequality Index | 8,295 | 0.35 |
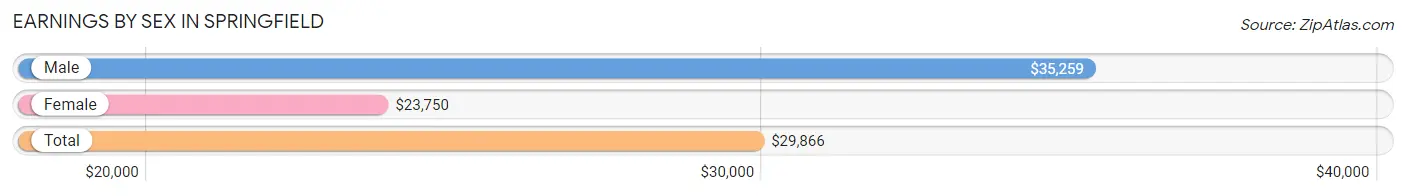
Earnings by Sex in Springfield
Average Earnings in Springfield are $29,866, $35,259 for men and $23,750 for women, a difference of 32.6%.
| Sex | Number | Average Earnings |
| Male | 1,947 (46.2%) | $35,259 |
| Female | 2,265 (53.8%) | $23,750 |
| Total | 4,212 (100.0%) | $29,866 |
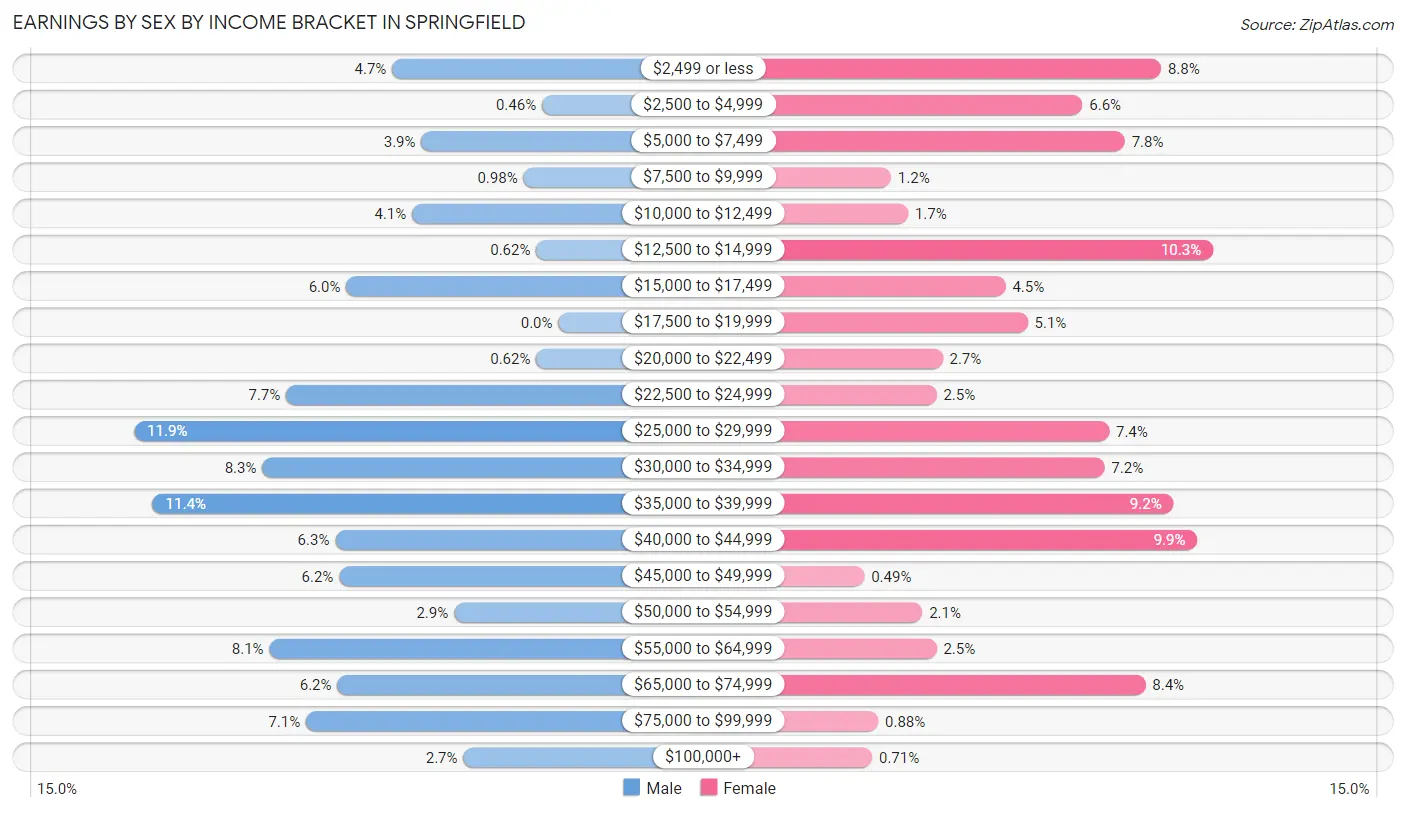
Earnings by Sex by Income Bracket in Springfield
The most common earnings brackets in Springfield are $25,000 to $29,999 for men (232 | 11.9%) and $12,500 to $14,999 for women (233 | 10.3%).
| Income | Male | Female |
| $2,499 or less | 91 (4.7%) | 200 (8.8%) |
| $2,500 to $4,999 | 9 (0.5%) | 150 (6.6%) |
| $5,000 to $7,499 | 75 (3.8%) | 177 (7.8%) |
| $7,500 to $9,999 | 19 (1.0%) | 28 (1.2%) |
| $10,000 to $12,499 | 80 (4.1%) | 39 (1.7%) |
| $12,500 to $14,999 | 12 (0.6%) | 233 (10.3%) |
| $15,000 to $17,499 | 116 (6.0%) | 101 (4.5%) |
| $17,500 to $19,999 | 0 (0.0%) | 115 (5.1%) |
| $20,000 to $22,499 | 12 (0.6%) | 61 (2.7%) |
| $22,500 to $24,999 | 149 (7.6%) | 57 (2.5%) |
| $25,000 to $29,999 | 232 (11.9%) | 167 (7.4%) |
| $30,000 to $34,999 | 162 (8.3%) | 164 (7.2%) |
| $35,000 to $39,999 | 222 (11.4%) | 208 (9.2%) |
| $40,000 to $44,999 | 122 (6.3%) | 223 (9.9%) |
| $45,000 to $49,999 | 120 (6.2%) | 11 (0.5%) |
| $50,000 to $54,999 | 57 (2.9%) | 48 (2.1%) |
| $55,000 to $64,999 | 158 (8.1%) | 57 (2.5%) |
| $65,000 to $74,999 | 121 (6.2%) | 190 (8.4%) |
| $75,000 to $99,999 | 138 (7.1%) | 20 (0.9%) |
| $100,000+ | 52 (2.7%) | 16 (0.7%) |
| Total | 1,947 (100.0%) | 2,265 (100.0%) |
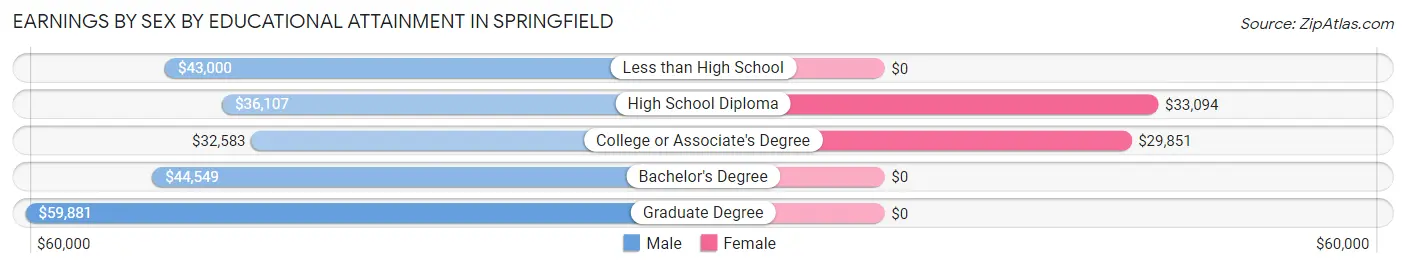
Earnings by Sex by Educational Attainment in Springfield
Average earnings in Springfield are $36,989 for men and $30,385 for women, a difference of 17.8%. Men with an educational attainment of graduate degree enjoy the highest average annual earnings of $59,881, while those with college or associate's degree education earn the least with $32,583. Women with an educational attainment of high school diploma earn the most with the average annual earnings of $33,094, while those with college or associate's degree education have the smallest earnings of $29,851.
| Educational Attainment | Male Income | Female Income |
| Less than High School | $43,000 | $0 |
| High School Diploma | $36,107 | $33,094 |
| College or Associate's Degree | $32,583 | $29,851 |
| Bachelor's Degree | $44,549 | $0 |
| Graduate Degree | $59,881 | $0 |
| Total | $36,989 | $30,385 |
Family Income in Springfield
Family Income Brackets in Springfield
According to the Springfield family income data, there are 548 families falling into the $50,000 to $74,999 income range, which is the most common income bracket and makes up 26.3% of all families. Conversely, the $150,000 to $199,999 income bracket is the least frequent group with only 25 families (1.2%) belonging to this category.
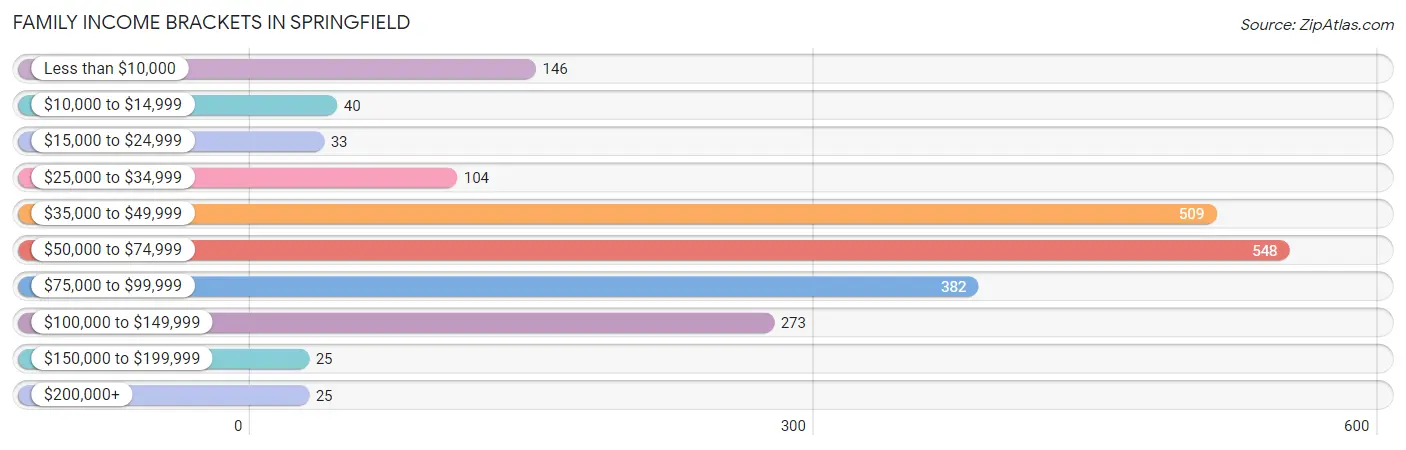
| Income Bracket | # Families | % Families |
| Less than $10,000 | 146 | 7.0% |
| $10,000 to $14,999 | 40 | 1.9% |
| $15,000 to $24,999 | 33 | 1.6% |
| $25,000 to $34,999 | 104 | 5.0% |
| $35,000 to $49,999 | 509 | 24.4% |
| $50,000 to $74,999 | 548 | 26.3% |
| $75,000 to $99,999 | 382 | 18.3% |
| $100,000 to $149,999 | 273 | 13.1% |
| $150,000 to $199,999 | 25 | 1.2% |
| $200,000+ | 25 | 1.2% |
Family Income by Famaliy Size in Springfield
6-person families (56 | 2.7%) account for the highest median family income in Springfield with $130,833 per family, while 2-person families (919 | 44.1%) have the highest median income of $30,045 per family member.
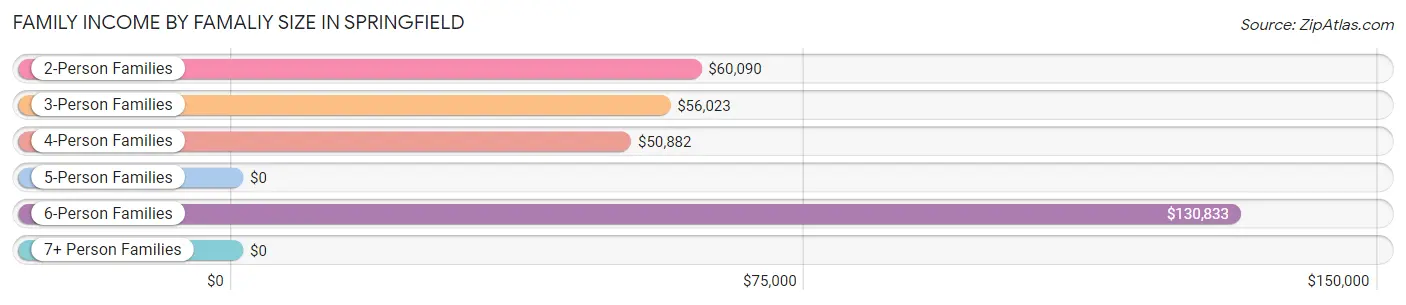
| Income Bracket | # Families | Median Income |
| 2-Person Families | 919 (44.1%) | $60,090 |
| 3-Person Families | 697 (33.4%) | $56,023 |
| 4-Person Families | 264 (12.7%) | $50,882 |
| 5-Person Families | 73 (3.5%) | $0 |
| 6-Person Families | 56 (2.7%) | $130,833 |
| 7+ Person Families | 76 (3.6%) | $0 |
| Total | 2,085 (100.0%) | $60,376 |
Family Income by Number of Earners in Springfield
The median family income in Springfield is $60,376, with families comprising 3+ earners (124) having the highest median family income of $114,167, while families with no earners (391) have the lowest median family income of $49,613, accounting for 5.9% and 18.8% of families, respectively.
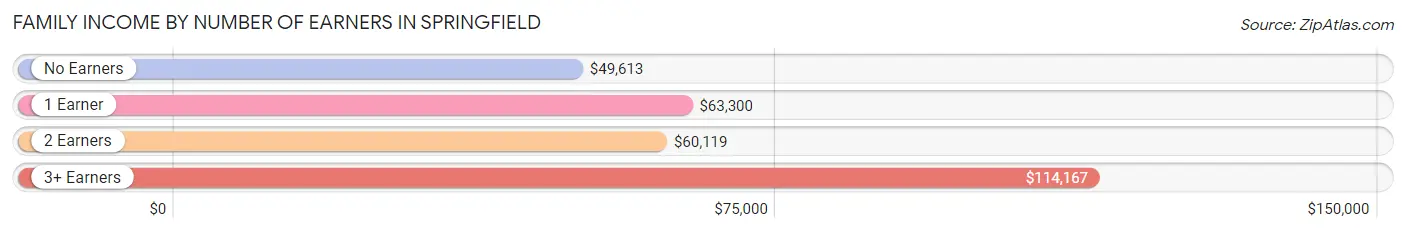
| Number of Earners | # Families | Median Income |
| No Earners | 391 (18.8%) | $49,613 |
| 1 Earner | 678 (32.5%) | $63,300 |
| 2 Earners | 892 (42.8%) | $60,119 |
| 3+ Earners | 124 (5.9%) | $114,167 |
| Total | 2,085 (100.0%) | $60,376 |
Household Income in Springfield
Household Income Brackets in Springfield
With 970 households falling in the category, the $35,000 to $49,999 income range is the most frequent in Springfield, accounting for 27.8% of all households. In contrast, only 38 households (1.1%) fall into the $200,000+ income bracket, making it the least populous group.
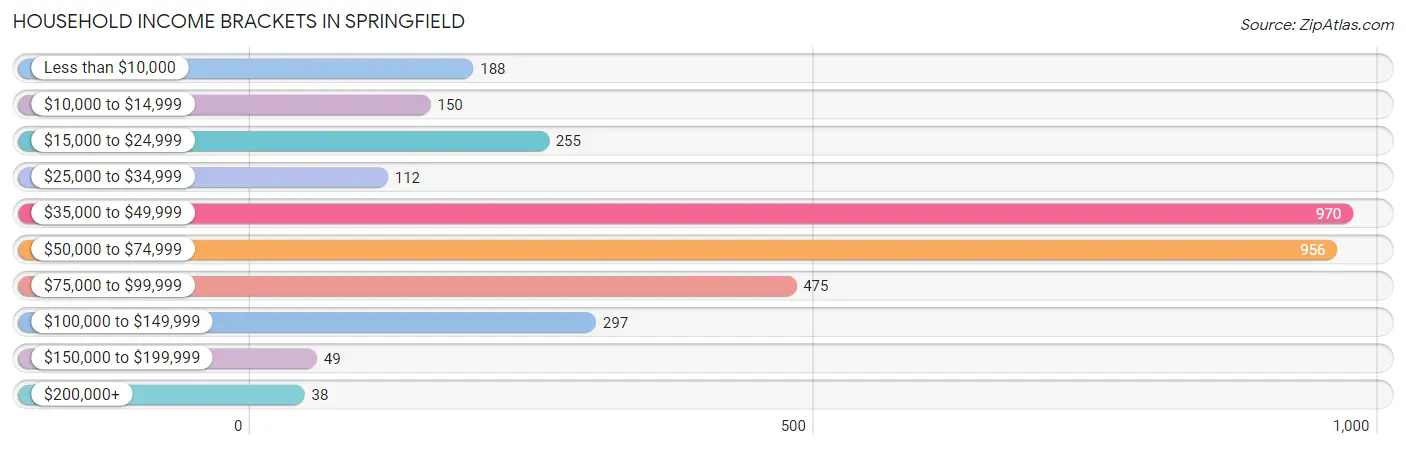
| Income Bracket | # Households | % Households |
| Less than $10,000 | 188 | 5.4% |
| $10,000 to $14,999 | 150 | 4.3% |
| $15,000 to $24,999 | 255 | 7.3% |
| $25,000 to $34,999 | 112 | 3.2% |
| $35,000 to $49,999 | 970 | 27.8% |
| $50,000 to $74,999 | 956 | 27.4% |
| $75,000 to $99,999 | 475 | 13.6% |
| $100,000 to $149,999 | 297 | 8.5% |
| $150,000 to $199,999 | 49 | 1.4% |
| $200,000+ | 38 | 1.1% |
Household Income by Householder Age in Springfield
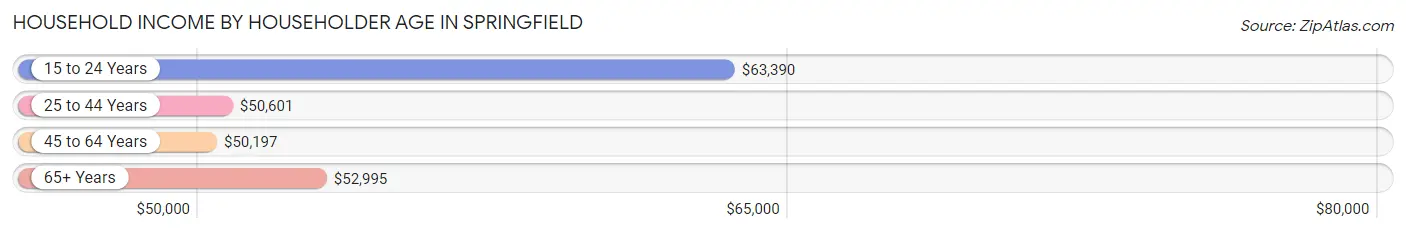
The median household income in Springfield is $52,188, with the highest median household income of $63,390 found in the 15 to 24 years age bracket for the primary householder. A total of 176 households (5.0%) fall into this category. Meanwhile, the 45 to 64 years age bracket for the primary householder has the lowest median household income of $50,197, with 1,307 households (37.4%) in this group.
| Income Bracket | # Households | Median Income |
| 15 to 24 Years | 176 (5.0%) | $63,390 |
| 25 to 44 Years | 1,023 (29.3%) | $50,601 |
| 45 to 64 Years | 1,307 (37.4%) | $50,197 |
| 65+ Years | 984 (28.2%) | $52,995 |
| Total | 3,490 (100.0%) | $52,188 |
Poverty in Springfield
Income Below Poverty by Sex and Age in Springfield
With 13.9% poverty level for males and 16.1% for females among the residents of Springfield, under 5 year old males and 18 to 24 year old females are the most vulnerable to poverty, with 101 males (37.0%) and 209 females (41.5%) in their respective age groups living below the poverty level.
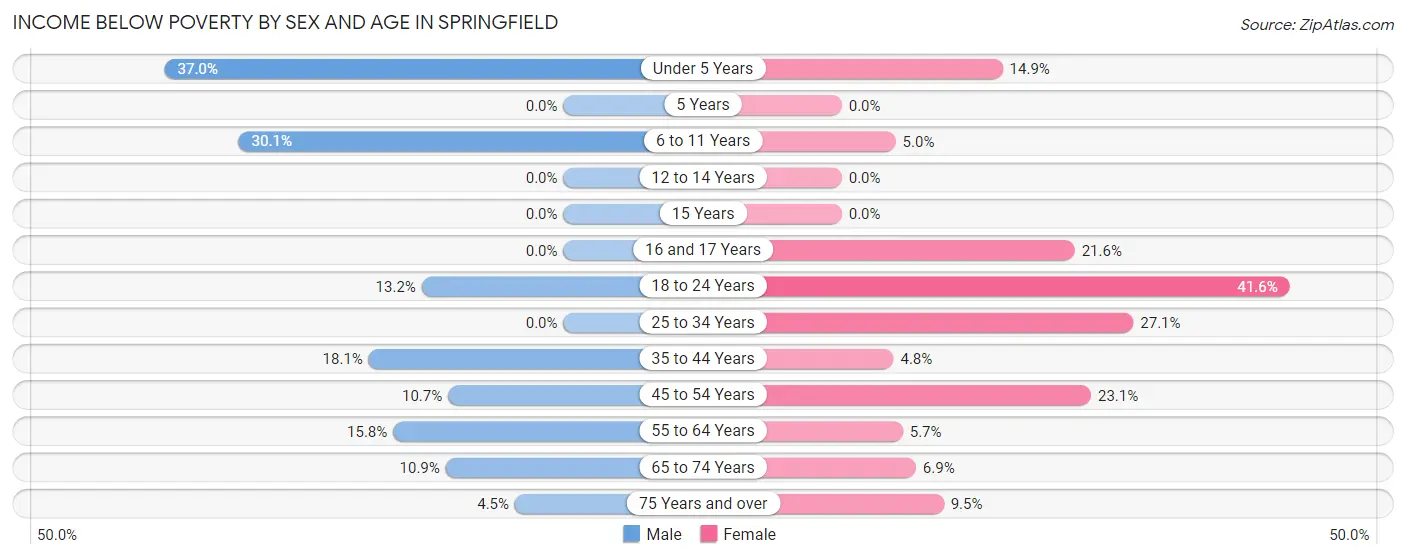
| Age Bracket | Male | Female |
| Under 5 Years | 101 (37.0%) | 33 (14.9%) |
| 5 Years | 0 (0.0%) | 0 (0.0%) |
| 6 to 11 Years | 94 (30.1%) | 3 (5.0%) |
| 12 to 14 Years | 0 (0.0%) | 0 (0.0%) |
| 15 Years | 0 (0.0%) | 0 (0.0%) |
| 16 and 17 Years | 0 (0.0%) | 16 (21.6%) |
| 18 to 24 Years | 63 (13.2%) | 209 (41.5%) |
| 25 to 34 Years | 0 (0.0%) | 148 (27.1%) |
| 35 to 44 Years | 131 (18.1%) | 16 (4.8%) |
| 45 to 54 Years | 49 (10.7%) | 105 (23.1%) |
| 55 to 64 Years | 82 (15.8%) | 42 (5.7%) |
| 65 to 74 Years | 47 (10.9%) | 40 (6.9%) |
| 75 Years and over | 18 (4.5%) | 28 (9.5%) |
| Total | 585 (13.9%) | 640 (16.1%) |
Income Above Poverty by Sex and Age in Springfield
According to the poverty statistics in Springfield, males aged 12 to 14 years and females aged 5 years are the age groups that are most secure financially, with 100.0% of males and 100.0% of females in these age groups living above the poverty line.
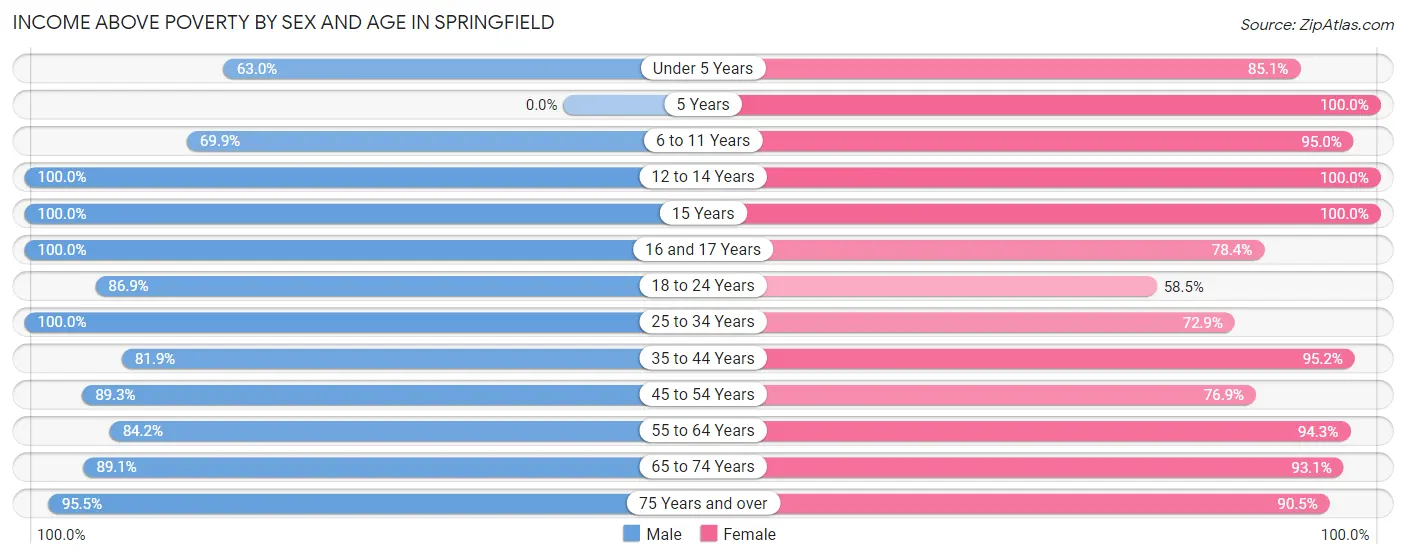
| Age Bracket | Male | Female |
| Under 5 Years | 172 (63.0%) | 188 (85.1%) |
| 5 Years | 0 (0.0%) | 12 (100.0%) |
| 6 to 11 Years | 218 (69.9%) | 57 (95.0%) |
| 12 to 14 Years | 64 (100.0%) | 128 (100.0%) |
| 15 Years | 52 (100.0%) | 30 (100.0%) |
| 16 and 17 Years | 22 (100.0%) | 58 (78.4%) |
| 18 to 24 Years | 416 (86.9%) | 294 (58.5%) |
| 25 to 34 Years | 464 (100.0%) | 399 (72.9%) |
| 35 to 44 Years | 594 (81.9%) | 317 (95.2%) |
| 45 to 54 Years | 409 (89.3%) | 349 (76.9%) |
| 55 to 64 Years | 437 (84.2%) | 700 (94.3%) |
| 65 to 74 Years | 383 (89.1%) | 541 (93.1%) |
| 75 Years and over | 382 (95.5%) | 268 (90.5%) |
| Total | 3,613 (86.1%) | 3,341 (83.9%) |
Income Below Poverty Among Married-Couple Families in Springfield
The poverty statistics for married-couple families in Springfield show that 2.5% or 31 of the total 1,223 families live below the poverty line. Families with no children have the highest poverty rate of 3.6%, comprising of 29 families. On the other hand, families with 3 or 4 children have the lowest poverty rate of 0.0%, which includes 0 families.
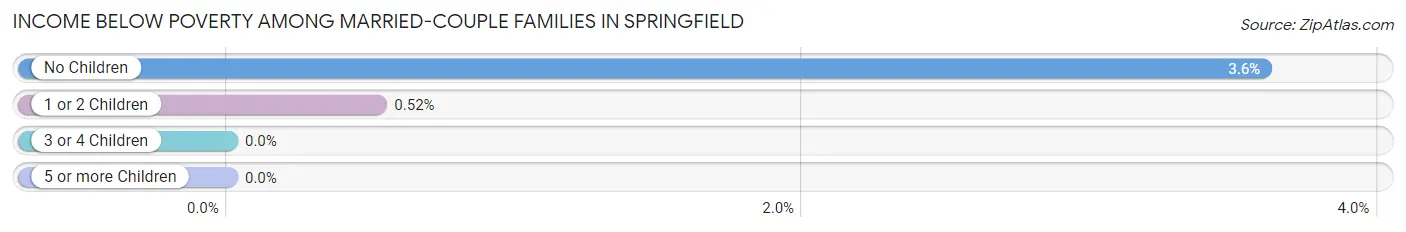
| Children | Above Poverty | Below Poverty |
| No Children | 777 (96.4%) | 29 (3.6%) |
| 1 or 2 Children | 380 (99.5%) | 2 (0.5%) |
| 3 or 4 Children | 18 (100.0%) | 0 (0.0%) |
| 5 or more Children | 17 (100.0%) | 0 (0.0%) |
| Total | 1,192 (97.5%) | 31 (2.5%) |
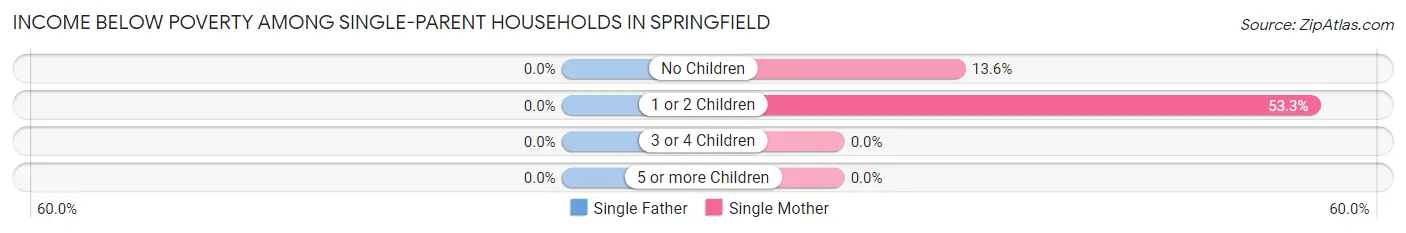
Income Below Poverty Among Single-Parent Households in Springfield
| Children | Single Father | Single Mother |
| No Children | 0 (0.0%) | 48 (13.6%) |
| 1 or 2 Children | 0 (0.0%) | 114 (53.3%) |
| 3 or 4 Children | 0 (0.0%) | 0 (0.0%) |
| 5 or more Children | 0 (0.0%) | 0 (0.0%) |
| Total | 0 (0.0%) | 162 (25.4%) |
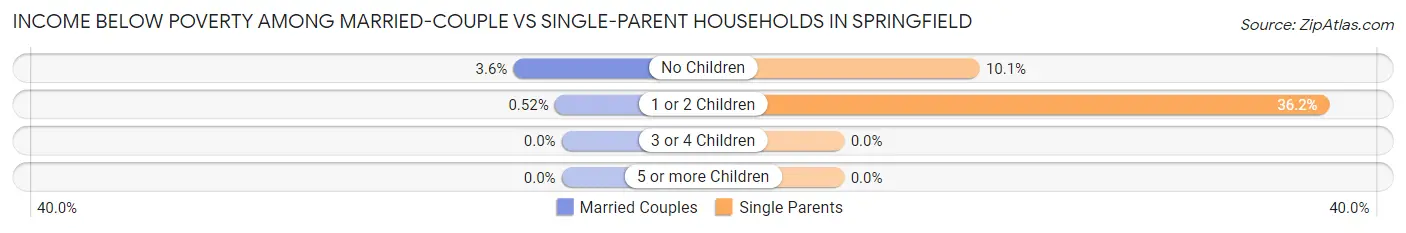
Income Below Poverty Among Married-Couple vs Single-Parent Households in Springfield
The poverty data for Springfield shows that 31 of the married-couple family households (2.5%) and 162 of the single-parent households (18.8%) are living below the poverty level. Within the married-couple family households, those with no children have the highest poverty rate, with 29 households (3.6%) falling below the poverty line. Among the single-parent households, those with 1 or 2 children have the highest poverty rate, with 114 household (36.2%) living below poverty.
| Children | Married-Couple Families | Single-Parent Households |
| No Children | 29 (3.6%) | 48 (10.1%) |
| 1 or 2 Children | 2 (0.5%) | 114 (36.2%) |
| 3 or 4 Children | 0 (0.0%) | 0 (0.0%) |
| 5 or more Children | 0 (0.0%) | 0 (0.0%) |
| Total | 31 (2.5%) | 162 (18.8%) |
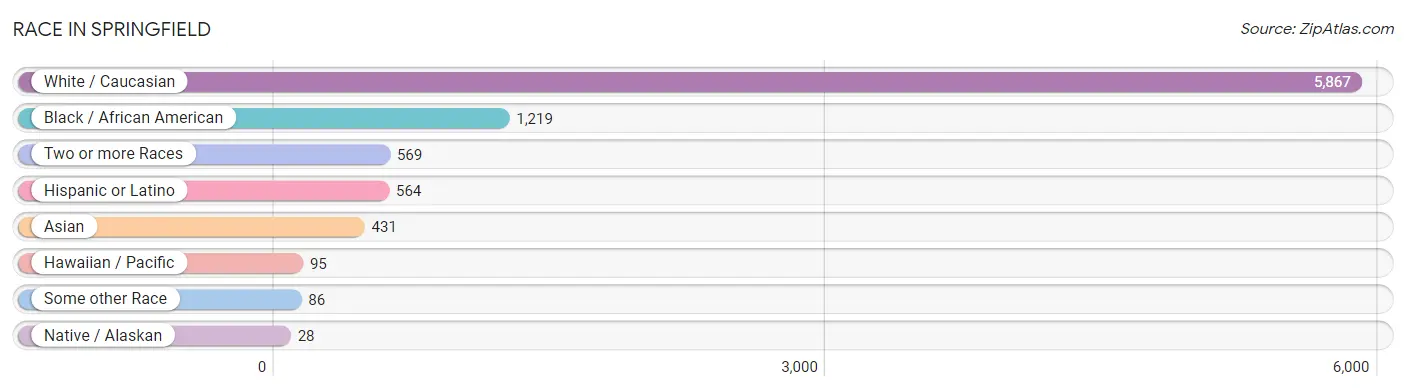
Race in Springfield
The most populous races in Springfield are White / Caucasian (5,867 | 70.7%), Black / African American (1,219 | 14.7%), and Two or more Races (569 | 6.9%).
| Race | # Population | % Population |
| Asian | 431 | 5.2% |
| Black / African American | 1,219 | 14.7% |
| Hawaiian / Pacific | 95 | 1.1% |
| Hispanic or Latino | 564 | 6.8% |
| Native / Alaskan | 28 | 0.3% |
| White / Caucasian | 5,867 | 70.7% |
| Two or more Races | 569 | 6.9% |
| Some other Race | 86 | 1.0% |
| Total | 8,295 | 100.0% |
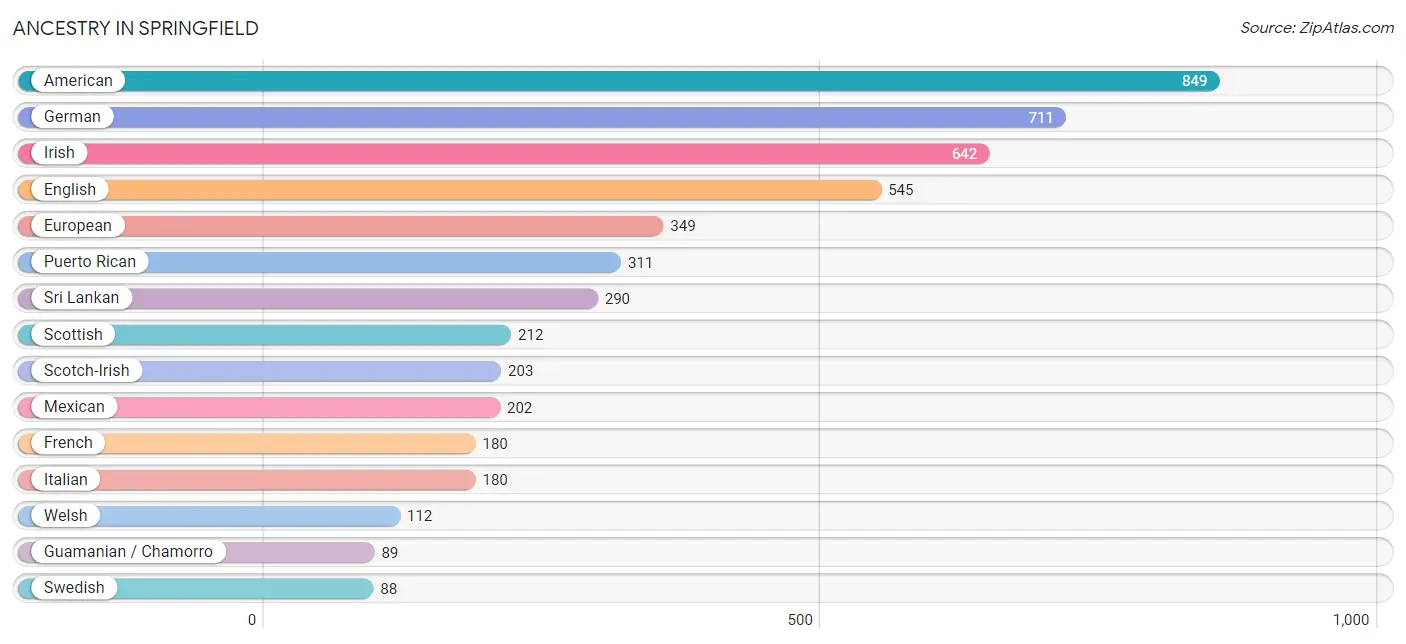
Ancestry in Springfield
The most populous ancestries reported in Springfield are American (849 | 10.2%), German (711 | 8.6%), Irish (642 | 7.7%), English (545 | 6.6%), and European (349 | 4.2%), together accounting for 37.3% of all Springfield residents.
| Ancestry | # Population | % Population |
| African | 25 | 0.3% |
| American | 849 | 10.2% |
| Austrian | 15 | 0.2% |
| Bhutanese | 61 | 0.7% |
| Blackfeet | 16 | 0.2% |
| British | 18 | 0.2% |
| Burmese | 19 | 0.2% |
| Canadian | 19 | 0.2% |
| Central American | 7 | 0.1% |
| Cherokee | 68 | 0.8% |
| Colombian | 26 | 0.3% |
| Creek | 28 | 0.3% |
| Cuban | 15 | 0.2% |
| Dutch | 85 | 1.0% |
| English | 545 | 6.6% |
| European | 349 | 4.2% |
| Filipino | 15 | 0.2% |
| Finnish | 8 | 0.1% |
| French | 180 | 2.2% |
| French Canadian | 6 | 0.1% |
| German | 711 | 8.6% |
| Greek | 29 | 0.4% |
| Guamanian / Chamorro | 89 | 1.1% |
| Guatemalan | 7 | 0.1% |
| Haitian | 2 | 0.0% |
| Irish | 642 | 7.7% |
| Italian | 180 | 2.2% |
| Jamaican | 45 | 0.5% |
| Korean | 46 | 0.5% |
| Lithuanian | 25 | 0.3% |
| Mexican | 202 | 2.4% |
| Norwegian | 57 | 0.7% |
| Pakistani | 73 | 0.9% |
| Polish | 33 | 0.4% |
| Portuguese | 24 | 0.3% |
| Puerto Rican | 311 | 3.7% |
| Russian | 37 | 0.4% |
| Scotch-Irish | 203 | 2.5% |
| Scottish | 212 | 2.6% |
| Slovak | 21 | 0.3% |
| South American | 26 | 0.3% |
| Spaniard | 2 | 0.0% |
| Sri Lankan | 290 | 3.5% |
| Subsaharan African | 25 | 0.3% |
| Swedish | 88 | 1.1% |
| Swiss | 10 | 0.1% |
| Thai | 15 | 0.2% |
| Welsh | 112 | 1.3% | View All 48 Rows |
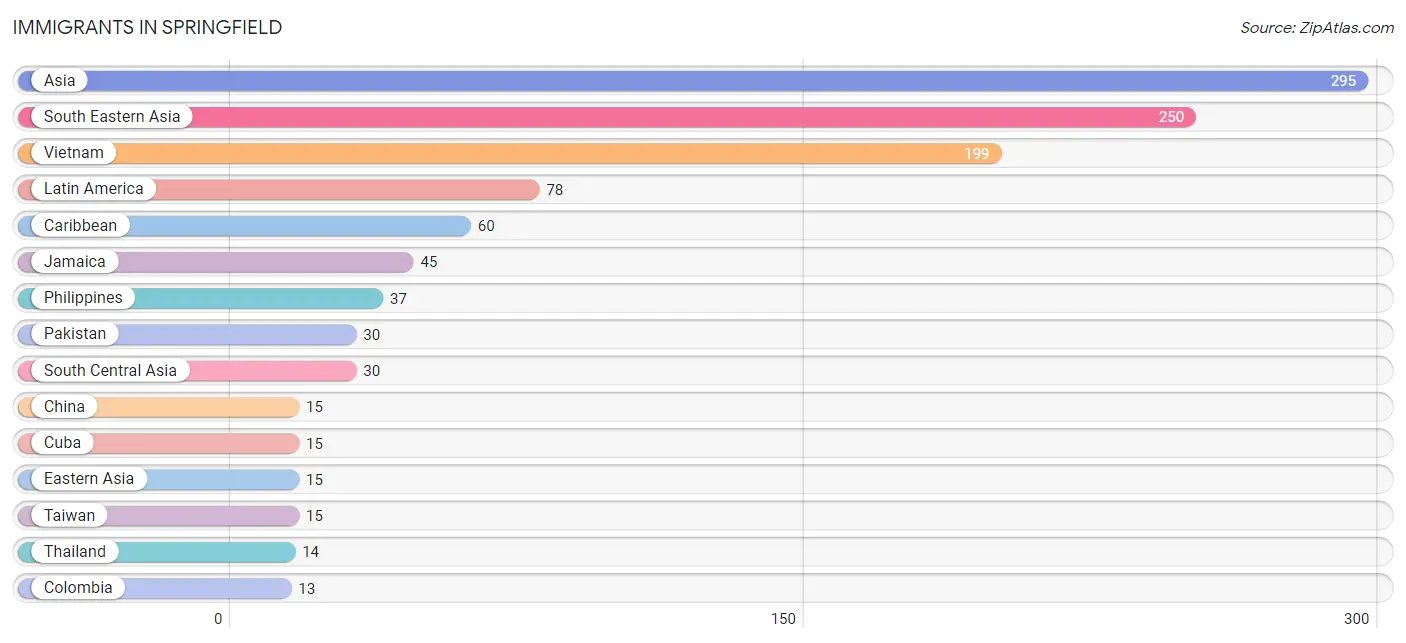
Immigrants in Springfield
The most numerous immigrant groups reported in Springfield came from Asia (295 | 3.6%), South Eastern Asia (250 | 3.0%), Vietnam (199 | 2.4%), Latin America (78 | 0.9%), and Caribbean (60 | 0.7%), together accounting for 10.6% of all Springfield residents.
| Immigration Origin | # Population | % Population |
| Asia | 295 | 3.6% |
| Caribbean | 60 | 0.7% |
| Central America | 5 | 0.1% |
| China | 15 | 0.2% |
| Colombia | 13 | 0.2% |
| Cuba | 15 | 0.2% |
| Eastern Asia | 15 | 0.2% |
| England | 7 | 0.1% |
| Europe | 7 | 0.1% |
| Jamaica | 45 | 0.5% |
| Latin America | 78 | 0.9% |
| Mexico | 5 | 0.1% |
| Northern Europe | 7 | 0.1% |
| Pakistan | 30 | 0.4% |
| Philippines | 37 | 0.4% |
| South America | 13 | 0.2% |
| South Central Asia | 30 | 0.4% |
| South Eastern Asia | 250 | 3.0% |
| Taiwan | 15 | 0.2% |
| Thailand | 14 | 0.2% |
| Vietnam | 199 | 2.4% | View All 21 Rows |
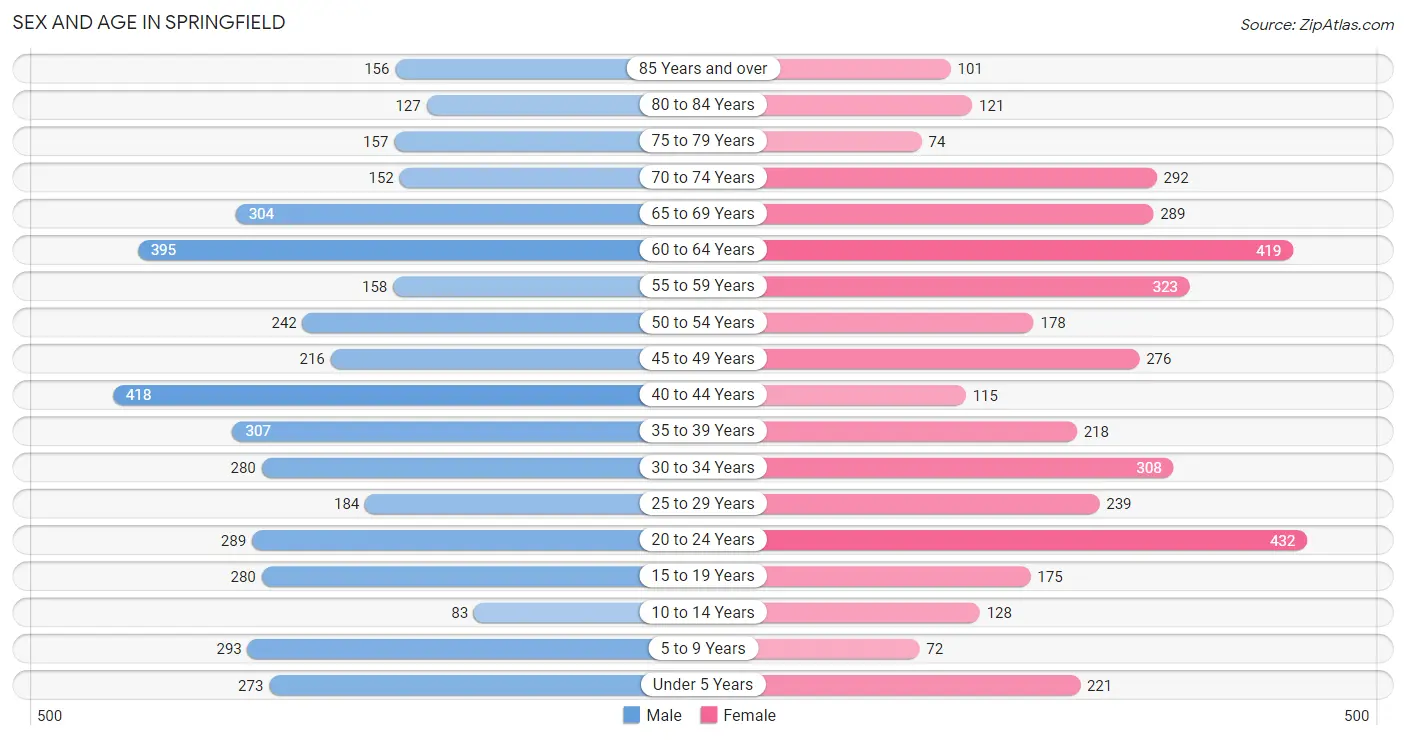
Sex and Age in Springfield
Sex and Age in Springfield
The most populous age groups in Springfield are 40 to 44 Years (418 | 9.7%) for men and 20 to 24 Years (432 | 10.8%) for women.
| Age Bracket | Male | Female |
| Under 5 Years | 273 (6.3%) | 221 (5.6%) |
| 5 to 9 Years | 293 (6.8%) | 72 (1.8%) |
| 10 to 14 Years | 83 (1.9%) | 128 (3.2%) |
| 15 to 19 Years | 280 (6.5%) | 175 (4.4%) |
| 20 to 24 Years | 289 (6.7%) | 432 (10.8%) |
| 25 to 29 Years | 184 (4.3%) | 239 (6.0%) |
| 30 to 34 Years | 280 (6.5%) | 308 (7.7%) |
| 35 to 39 Years | 307 (7.1%) | 218 (5.5%) |
| 40 to 44 Years | 418 (9.7%) | 115 (2.9%) |
| 45 to 49 Years | 216 (5.0%) | 276 (6.9%) |
| 50 to 54 Years | 242 (5.6%) | 178 (4.5%) |
| 55 to 59 Years | 158 (3.7%) | 323 (8.1%) |
| 60 to 64 Years | 395 (9.2%) | 419 (10.5%) |
| 65 to 69 Years | 304 (7.0%) | 289 (7.3%) |
| 70 to 74 Years | 152 (3.5%) | 292 (7.3%) |
| 75 to 79 Years | 157 (3.6%) | 74 (1.9%) |
| 80 to 84 Years | 127 (2.9%) | 121 (3.0%) |
| 85 Years and over | 156 (3.6%) | 101 (2.5%) |
| Total | 4,314 (100.0%) | 3,981 (100.0%) |
Families and Households in Springfield
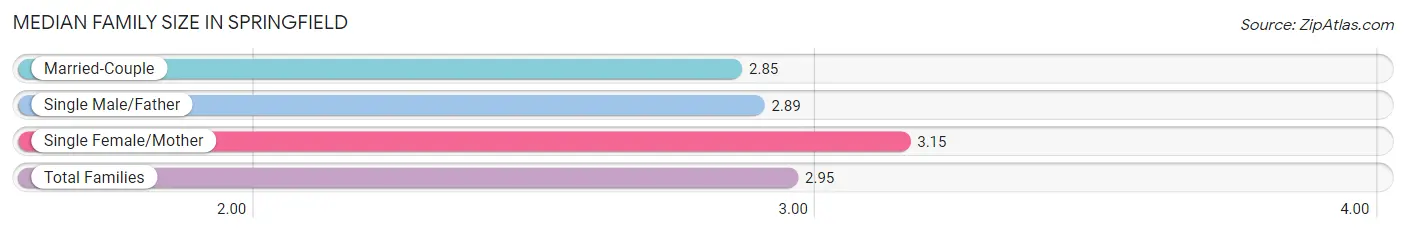
Median Family Size in Springfield
The median family size in Springfield is 2.95 persons per family, with single female/mother families (639 | 30.6%) accounting for the largest median family size of 3.15 persons per family. On the other hand, married-couple families (1,223 | 58.7%) represent the smallest median family size with 2.85 persons per family.
| Family Type | # Families | Family Size |
| Married-Couple | 1,223 (58.7%) | 2.85 |
| Single Male/Father | 223 (10.7%) | 2.89 |
| Single Female/Mother | 639 (30.6%) | 3.15 |
| Total Families | 2,085 (100.0%) | 2.95 |
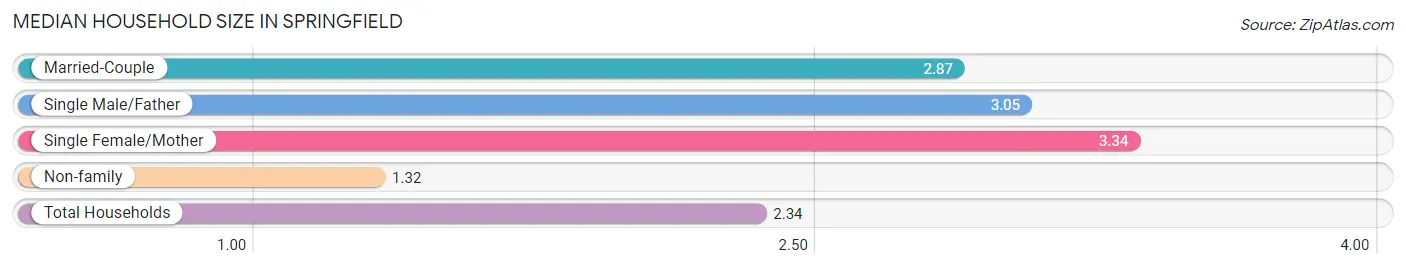
Median Household Size in Springfield
The median household size in Springfield is 2.34 persons per household, with single female/mother households (639 | 18.3%) accounting for the largest median household size of 3.34 persons per household. non-family households (1,405 | 40.3%) represent the smallest median household size with 1.32 persons per household.
| Household Type | # Households | Household Size |
| Married-Couple | 1,223 (35.0%) | 2.87 |
| Single Male/Father | 223 (6.4%) | 3.05 |
| Single Female/Mother | 639 (18.3%) | 3.34 |
| Non-family | 1,405 (40.3%) | 1.32 |
| Total Households | 3,490 (100.0%) | 2.34 |
Household Size by Marriage Status in Springfield
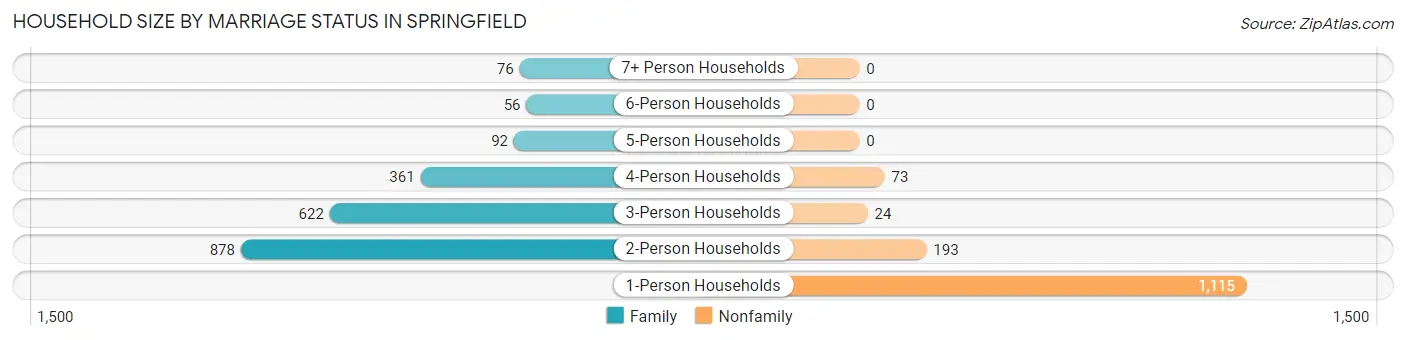
Out of a total of 3,490 households in Springfield, 2,085 (59.7%) are family households, while 1,405 (40.3%) are nonfamily households. The most numerous type of family households are 2-person households, comprising 878, and the most common type of nonfamily households are 1-person households, comprising 1,115.
| Household Size | Family Households | Nonfamily Households |
| 1-Person Households | - | 1,115 (32.0%) |
| 2-Person Households | 878 (25.2%) | 193 (5.5%) |
| 3-Person Households | 622 (17.8%) | 24 (0.7%) |
| 4-Person Households | 361 (10.3%) | 73 (2.1%) |
| 5-Person Households | 92 (2.6%) | 0 (0.0%) |
| 6-Person Households | 56 (1.6%) | 0 (0.0%) |
| 7+ Person Households | 76 (2.2%) | 0 (0.0%) |
| Total | 2,085 (59.7%) | 1,405 (40.3%) |
Female Fertility in Springfield
Fertility by Age in Springfield
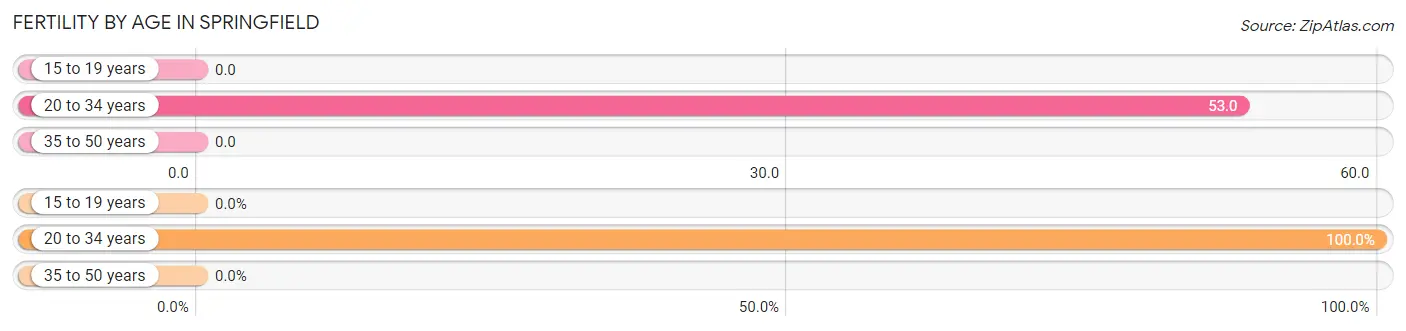
Average fertility rate in Springfield is 28.0 births per 1,000 women. Women in the age bracket of 20 to 34 years have the highest fertility rate with 53.0 births per 1,000 women. Women in the age bracket of 20 to 34 years acount for 100.0% of all women with births.
| Age Bracket | Women with Births | Births / 1,000 Women |
| 15 to 19 years | 0 (0.0%) | 0.0 |
| 20 to 34 years | 52 (100.0%) | 53.0 |
| 35 to 50 years | 0 (0.0%) | 0.0 |
| Total | 52 (100.0%) | 28.0 |
Fertility by Age by Marriage Status in Springfield
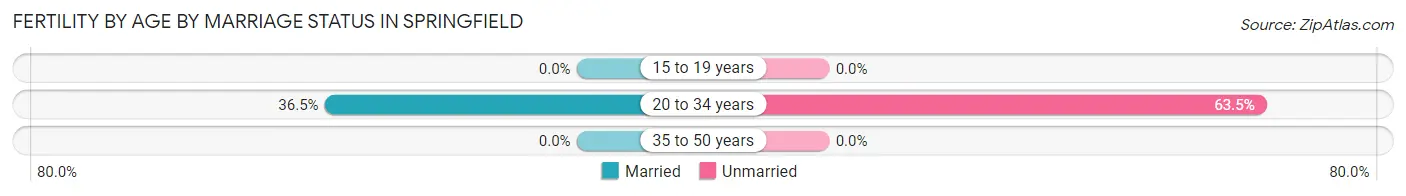
36.5% of women with births (52) in Springfield are married. The highest percentage of unmarried women with births falls into 20 to 34 years age bracket with 63.5% of them unmarried at the time of birth, while the lowest percentage of unmarried women with births belong to 20 to 34 years age bracket with 63.5% of them unmarried.
| Age Bracket | Married | Unmarried |
| 15 to 19 years | 0 (0.0%) | 0 (0.0%) |
| 20 to 34 years | 19 (36.5%) | 33 (63.5%) |
| 35 to 50 years | 0 (0.0%) | 0 (0.0%) |
| Total | 19 (36.5%) | 33 (63.5%) |
Fertility by Education in Springfield
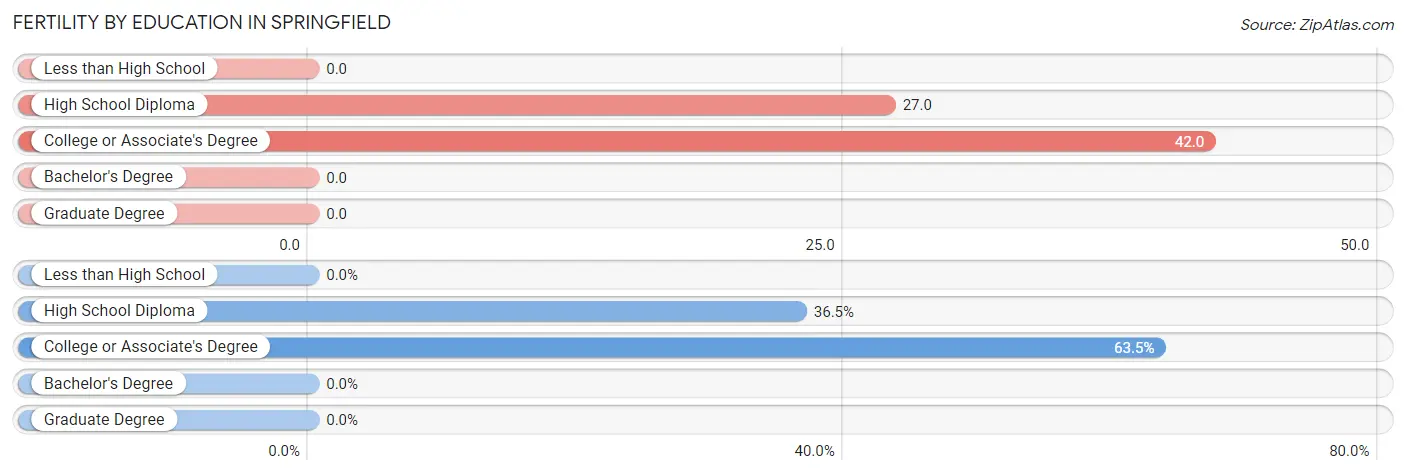
| Educational Attainment | Women with Births | Births / 1,000 Women |
| Less than High School | 0 (0.0%) | 0.0 |
| High School Diploma | 19 (36.5%) | 27.0 |
| College or Associate's Degree | 33 (63.5%) | 42.0 |
| Bachelor's Degree | 0 (0.0%) | 0.0 |
| Graduate Degree | 0 (0.0%) | 0.0 |
| Total | 52 (100.0%) | 28.0 |
Fertility by Education by Marriage Status in Springfield
63.5% of women with births in Springfield are unmarried. Women with the educational attainment of high school diploma are most likely to be married with 100.0% of them married at childbirth, while women with the educational attainment of college or associate's degree are least likely to be married with 100.0% of them unmarried at childbirth.
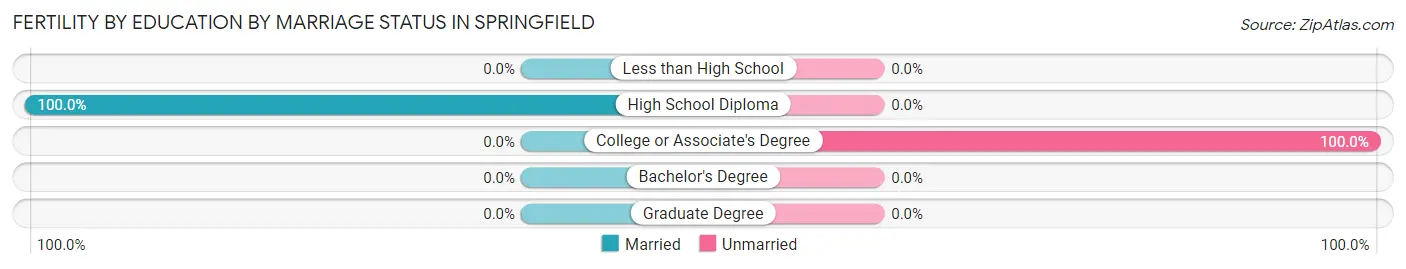
| Educational Attainment | Married | Unmarried |
| Less than High School | 0 (0.0%) | 0 (0.0%) |
| High School Diploma | 19 (100.0%) | 0 (0.0%) |
| College or Associate's Degree | 0 (0.0%) | 33 (100.0%) |
| Bachelor's Degree | 0 (0.0%) | 0 (0.0%) |
| Graduate Degree | 0 (0.0%) | 0 (0.0%) |
| Total | 19 (36.5%) | 33 (63.5%) |
Employment Characteristics in Springfield
Employment by Class of Employer in Springfield
Among the 3,894 employed individuals in Springfield, private company employees (2,672 | 68.6%), local government employees (312 | 8.0%), and federal government employees (254 | 6.5%) make up the most common classes of employment.
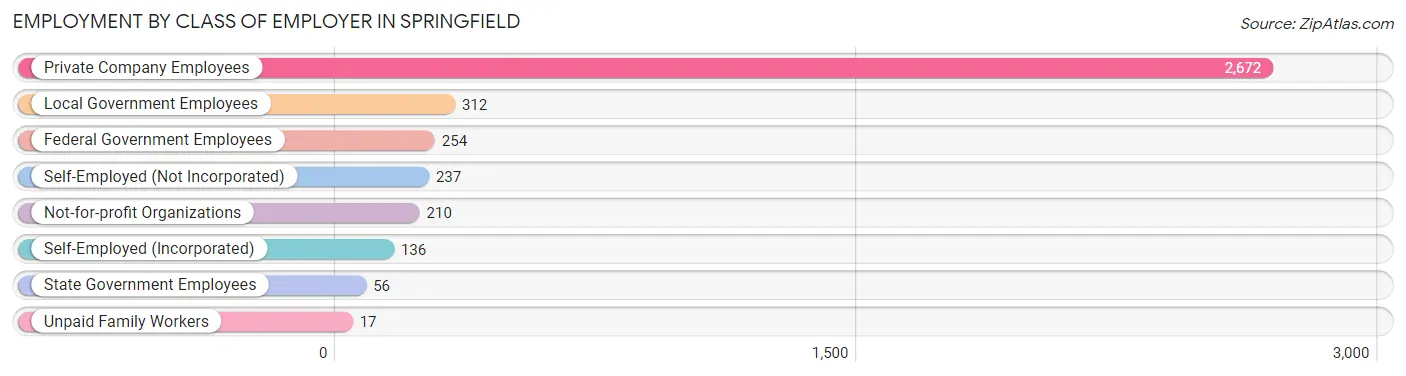
| Employer Class | # Employees | % Employees |
| Private Company Employees | 2,672 | 68.6% |
| Self-Employed (Incorporated) | 136 | 3.5% |
| Self-Employed (Not Incorporated) | 237 | 6.1% |
| Not-for-profit Organizations | 210 | 5.4% |
| Local Government Employees | 312 | 8.0% |
| State Government Employees | 56 | 1.4% |
| Federal Government Employees | 254 | 6.5% |
| Unpaid Family Workers | 17 | 0.4% |
| Total | 3,894 | 100.0% |
Employment Status by Age in Springfield
According to the labor force statistics for Springfield, out of the total population over 16 years of age (7,143), 56.2% or 4,014 individuals are in the labor force, with 1.2% or 48 of them unemployed. The age group with the highest labor force participation rate is 20 to 24 years, with 90.6% or 653 individuals in the labor force. Within the labor force, the 75 years and over age range has the highest percentage of unemployed individuals, with 60.0% or 9 of them being unemployed.
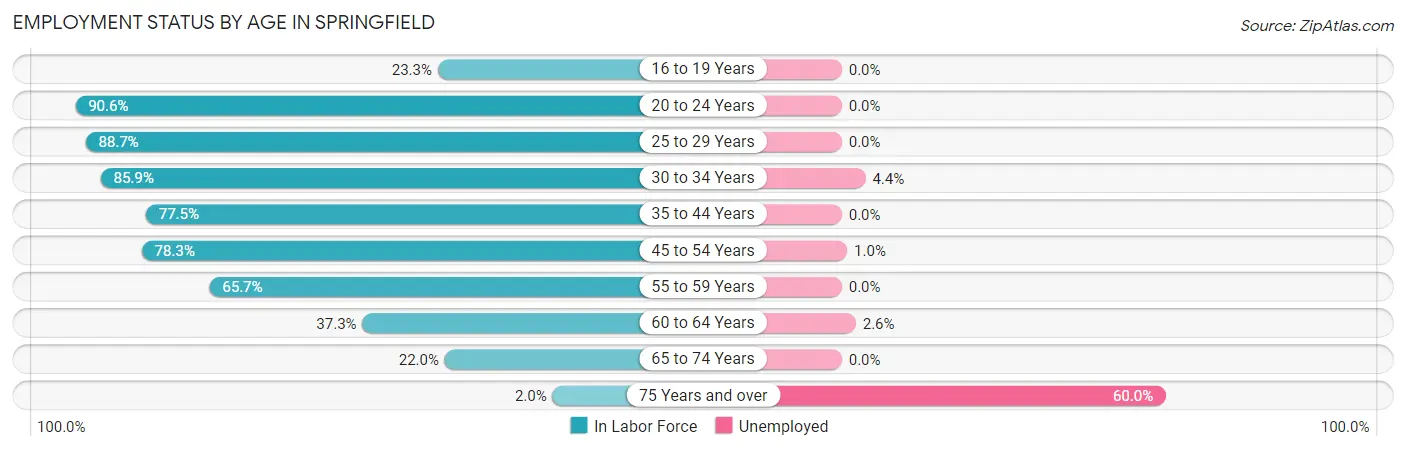
| Age Bracket | In Labor Force | Unemployed |
| 16 to 19 Years | 87 (23.3%) | 0 (0.0%) |
| 20 to 24 Years | 653 (90.6%) | 0 (0.0%) |
| 25 to 29 Years | 375 (88.7%) | 0 (0.0%) |
| 30 to 34 Years | 505 (85.9%) | 22 (4.4%) |
| 35 to 44 Years | 820 (77.5%) | 0 (0.0%) |
| 45 to 54 Years | 714 (78.3%) | 7 (1.0%) |
| 55 to 59 Years | 316 (65.7%) | 0 (0.0%) |
| 60 to 64 Years | 304 (37.3%) | 8 (2.6%) |
| 65 to 74 Years | 228 (22.0%) | 0 (0.0%) |
| 75 Years and over | 15 (2.0%) | 9 (60.0%) |
| Total | 4,014 (56.2%) | 48 (1.2%) |
Employment Status by Educational Attainment in Springfield
According to labor force statistics for Springfield, 71.0% of individuals (3,036) out of the total population between 25 and 64 years of age (4,276) are in the labor force, with 1.2% or 36 of them being unemployed. The group with the highest labor force participation rate are those with the educational attainment of college / associate degree, with 77.8% or 1,032 individuals in the labor force. Within the labor force, individuals with less than high school education have the highest percentage of unemployment, with 3.9% or 8 of them being unemployed.
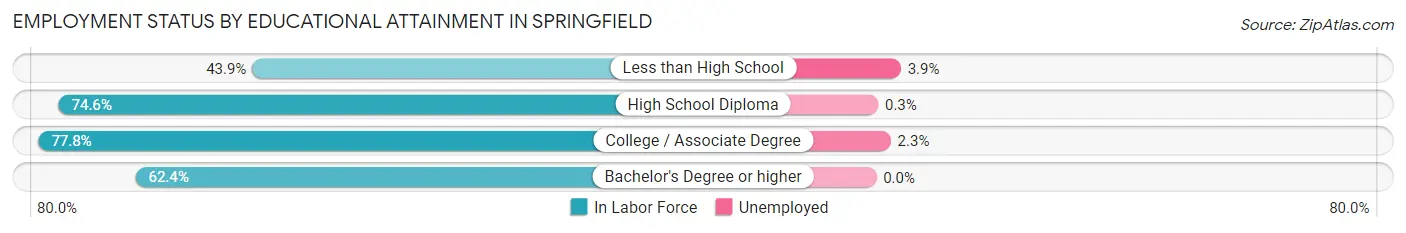
| Educational Attainment | In Labor Force | Unemployed |
| Less than High School | 205 (43.9%) | 18 (3.9%) |
| High School Diploma | 1,522 (74.6%) | 6 (0.3%) |
| College / Associate Degree | 1,032 (77.8%) | 31 (2.3%) |
| Bachelor's Degree or higher | 276 (62.4%) | 0 (0.0%) |
| Total | 3,036 (71.0%) | 51 (1.2%) |
Employment Occupations by Sex in Springfield
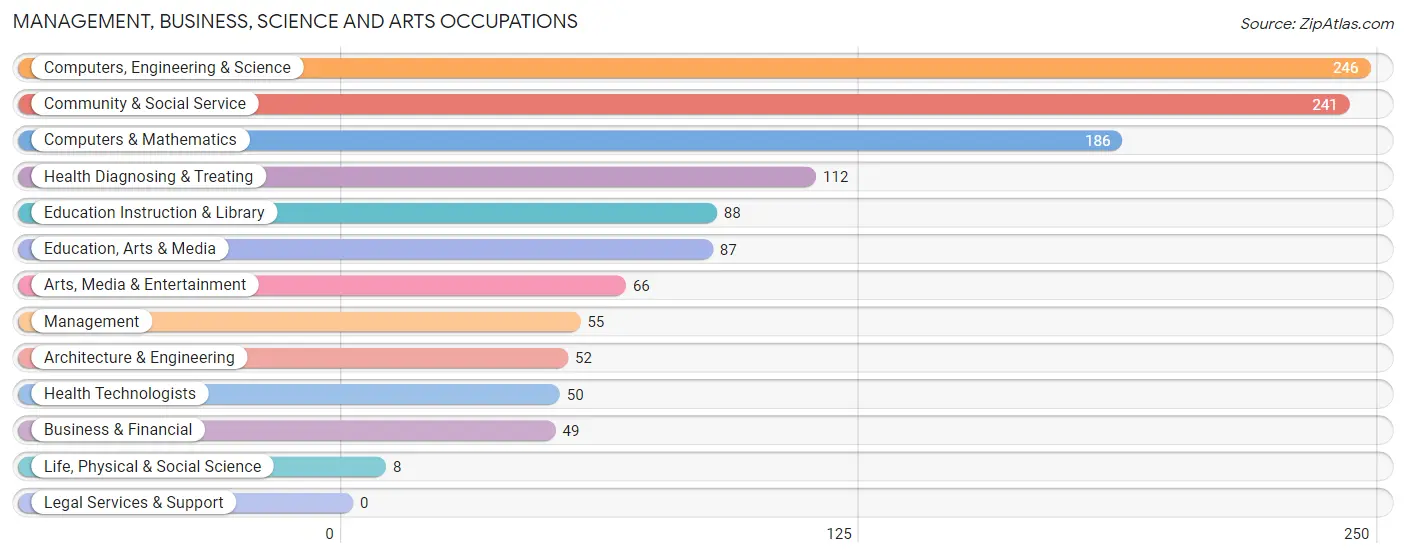
Management, Business, Science and Arts Occupations
The most common Management, Business, Science and Arts occupations in Springfield are Computers, Engineering & Science (246 | 6.4%), Community & Social Service (241 | 6.2%), Computers & Mathematics (186 | 4.8%), Health Diagnosing & Treating (112 | 2.9%), and Education Instruction & Library (88 | 2.3%).
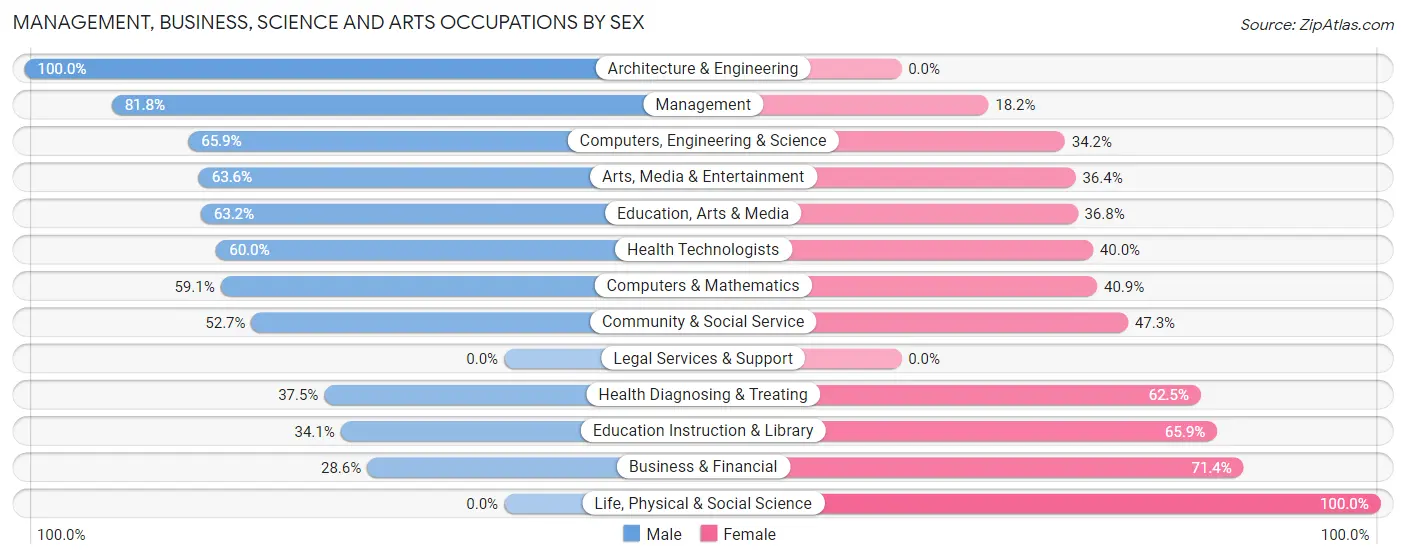
Management, Business, Science and Arts Occupations by Sex
Within the Management, Business, Science and Arts occupations in Springfield, the most male-oriented occupations are Architecture & Engineering (100.0%), Management (81.8%), and Computers, Engineering & Science (65.8%), while the most female-oriented occupations are Life, Physical & Social Science (100.0%), Business & Financial (71.4%), and Education Instruction & Library (65.9%).
| Occupation | Male | Female |
| Management | 45 (81.8%) | 10 (18.2%) |
| Business & Financial | 14 (28.6%) | 35 (71.4%) |
| Computers, Engineering & Science | 162 (65.8%) | 84 (34.2%) |
| Computers & Mathematics | 110 (59.1%) | 76 (40.9%) |
| Architecture & Engineering | 52 (100.0%) | 0 (0.0%) |
| Life, Physical & Social Science | 0 (0.0%) | 8 (100.0%) |
| Community & Social Service | 127 (52.7%) | 114 (47.3%) |
| Education, Arts & Media | 55 (63.2%) | 32 (36.8%) |
| Legal Services & Support | 0 (0.0%) | 0 (0.0%) |
| Education Instruction & Library | 30 (34.1%) | 58 (65.9%) |
| Arts, Media & Entertainment | 42 (63.6%) | 24 (36.4%) |
| Health Diagnosing & Treating | 42 (37.5%) | 70 (62.5%) |
| Health Technologists | 30 (60.0%) | 20 (40.0%) |
| Total (Category) | 390 (55.5%) | 313 (44.5%) |
| Total (Overall) | 1,747 (45.2%) | 2,121 (54.8%) |
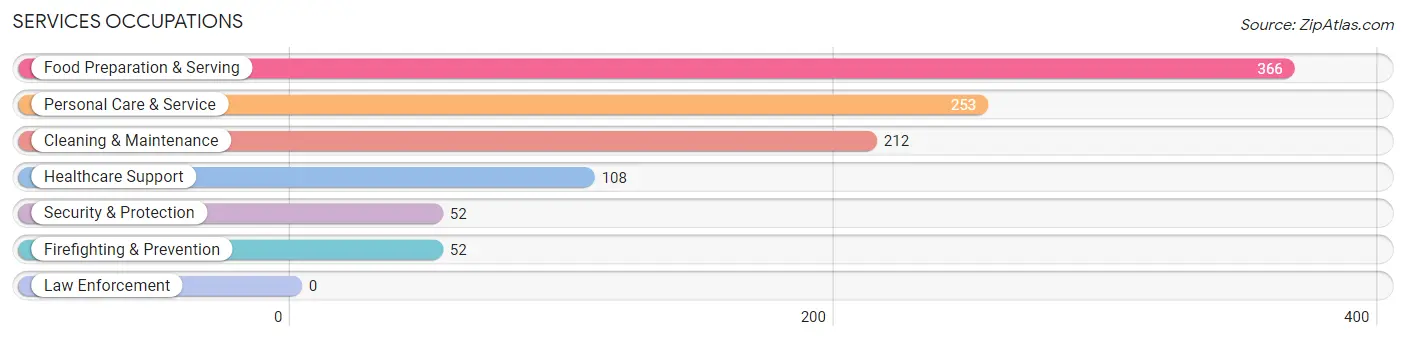
Services Occupations
The most common Services occupations in Springfield are Food Preparation & Serving (366 | 9.5%), Personal Care & Service (253 | 6.5%), Cleaning & Maintenance (212 | 5.5%), Healthcare Support (108 | 2.8%), and Security & Protection (52 | 1.3%).
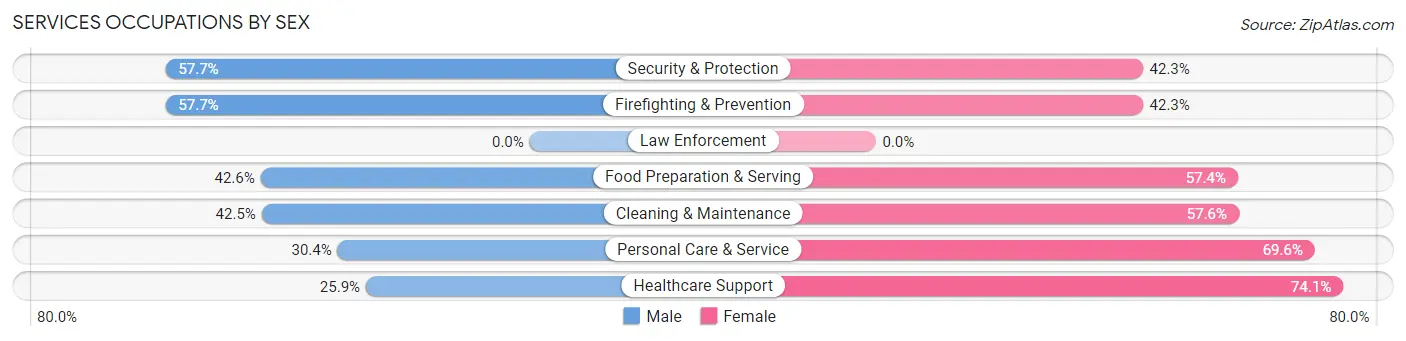
Services Occupations by Sex
Within the Services occupations in Springfield, the most male-oriented occupations are Security & Protection (57.7%), Firefighting & Prevention (57.7%), and Food Preparation & Serving (42.6%), while the most female-oriented occupations are Healthcare Support (74.1%), Personal Care & Service (69.6%), and Cleaning & Maintenance (57.6%).
| Occupation | Male | Female |
| Healthcare Support | 28 (25.9%) | 80 (74.1%) |
| Security & Protection | 30 (57.7%) | 22 (42.3%) |
| Firefighting & Prevention | 30 (57.7%) | 22 (42.3%) |
| Law Enforcement | 0 (0.0%) | 0 (0.0%) |
| Food Preparation & Serving | 156 (42.6%) | 210 (57.4%) |
| Cleaning & Maintenance | 90 (42.4%) | 122 (57.6%) |
| Personal Care & Service | 77 (30.4%) | 176 (69.6%) |
| Total (Category) | 381 (38.5%) | 610 (61.6%) |
| Total (Overall) | 1,747 (45.2%) | 2,121 (54.8%) |
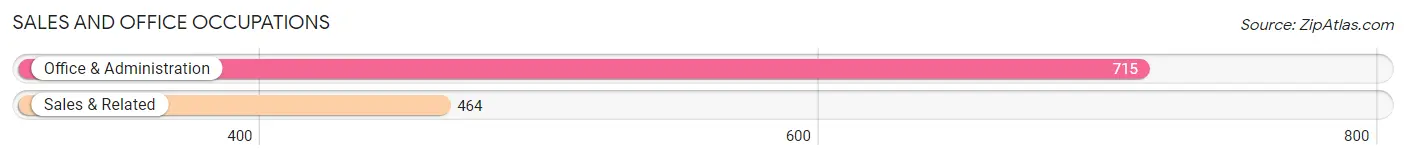
Sales and Office Occupations
The most common Sales and Office occupations in Springfield are Office & Administration (715 | 18.5%), and Sales & Related (464 | 12.0%).
Sales and Office Occupations by Sex
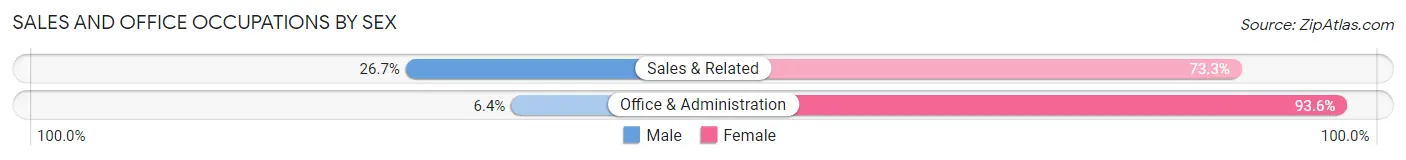
| Occupation | Male | Female |
| Sales & Related | 124 (26.7%) | 340 (73.3%) |
| Office & Administration | 46 (6.4%) | 669 (93.6%) |
| Total (Category) | 170 (14.4%) | 1,009 (85.6%) |
| Total (Overall) | 1,747 (45.2%) | 2,121 (54.8%) |
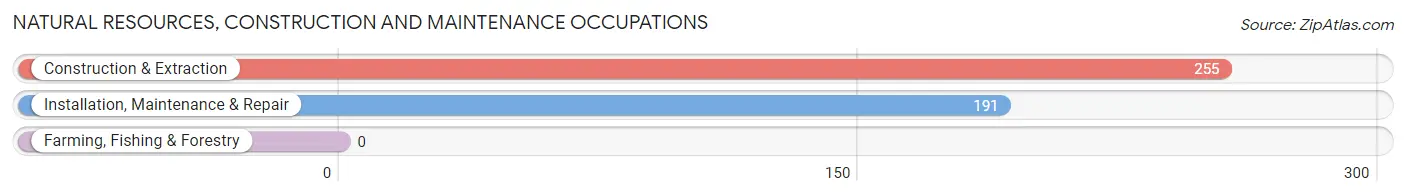
Natural Resources, Construction and Maintenance Occupations
The most common Natural Resources, Construction and Maintenance occupations in Springfield are Construction & Extraction (255 | 6.6%), and Installation, Maintenance & Repair (191 | 4.9%).
Natural Resources, Construction and Maintenance Occupations by Sex
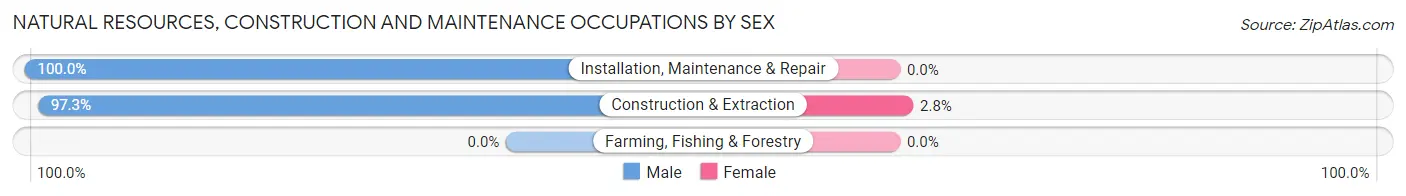
| Occupation | Male | Female |
| Farming, Fishing & Forestry | 0 (0.0%) | 0 (0.0%) |
| Construction & Extraction | 248 (97.3%) | 7 (2.8%) |
| Installation, Maintenance & Repair | 191 (100.0%) | 0 (0.0%) |
| Total (Category) | 439 (98.4%) | 7 (1.6%) |
| Total (Overall) | 1,747 (45.2%) | 2,121 (54.8%) |
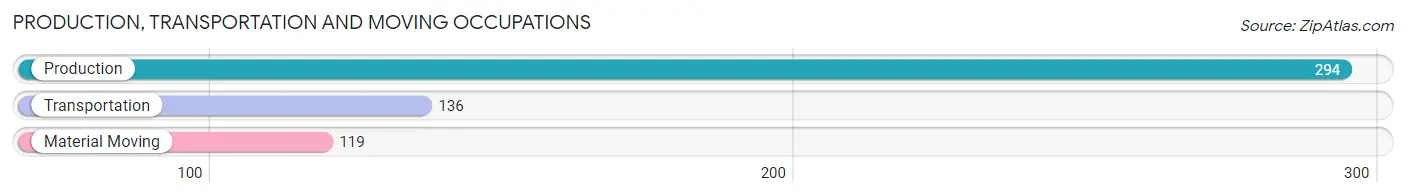
Production, Transportation and Moving Occupations
The most common Production, Transportation and Moving occupations in Springfield are Production (294 | 7.6%), Transportation (136 | 3.5%), and Material Moving (119 | 3.1%).
Production, Transportation and Moving Occupations by Sex
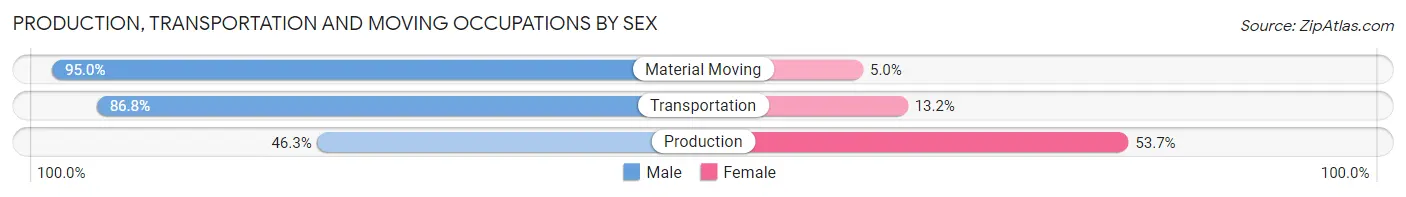
| Occupation | Male | Female |
| Production | 136 (46.3%) | 158 (53.7%) |
| Transportation | 118 (86.8%) | 18 (13.2%) |
| Material Moving | 113 (95.0%) | 6 (5.0%) |
| Total (Category) | 367 (66.8%) | 182 (33.2%) |
| Total (Overall) | 1,747 (45.2%) | 2,121 (54.8%) |
Employment Industries by Sex in Springfield
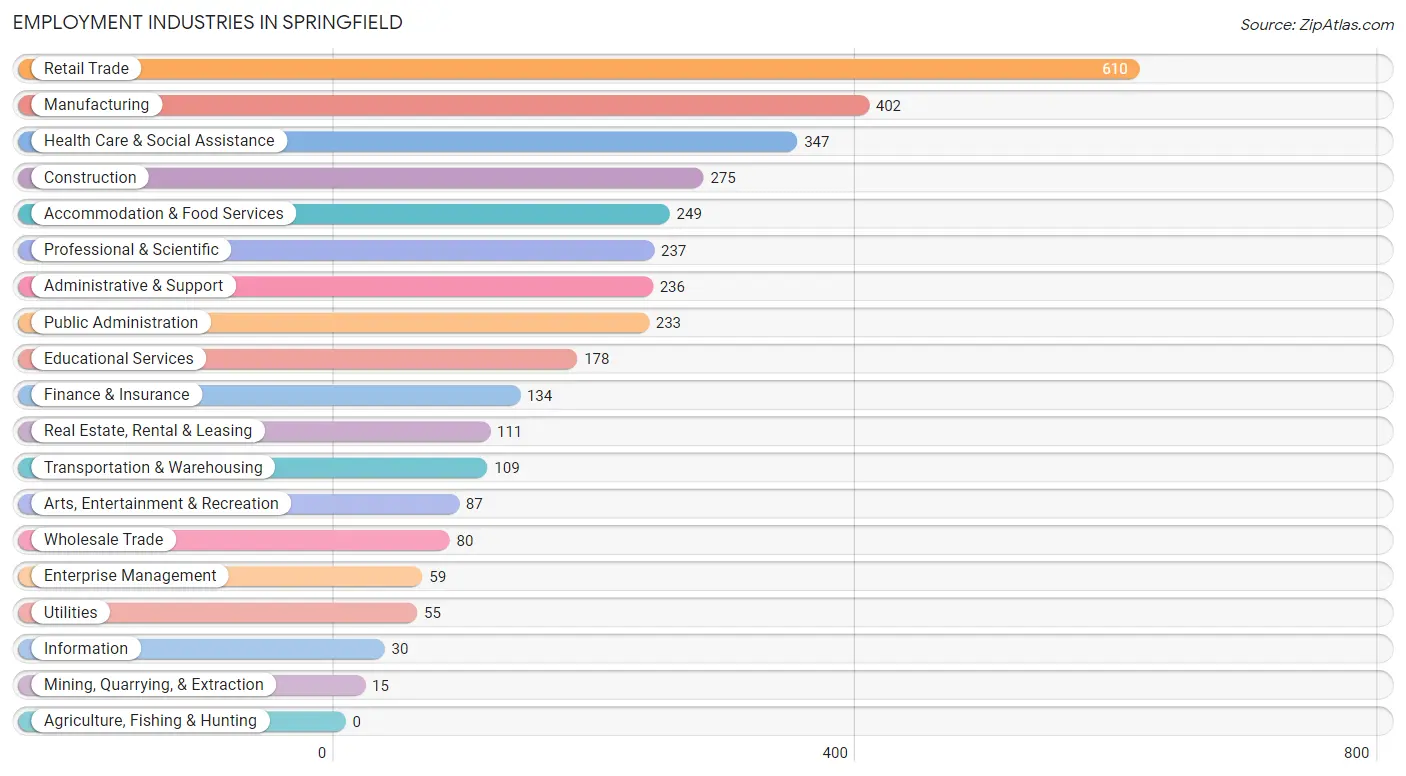
Employment Industries in Springfield
The major employment industries in Springfield include Retail Trade (610 | 15.8%), Manufacturing (402 | 10.4%), Health Care & Social Assistance (347 | 9.0%), Construction (275 | 7.1%), and Accommodation & Food Services (249 | 6.4%).
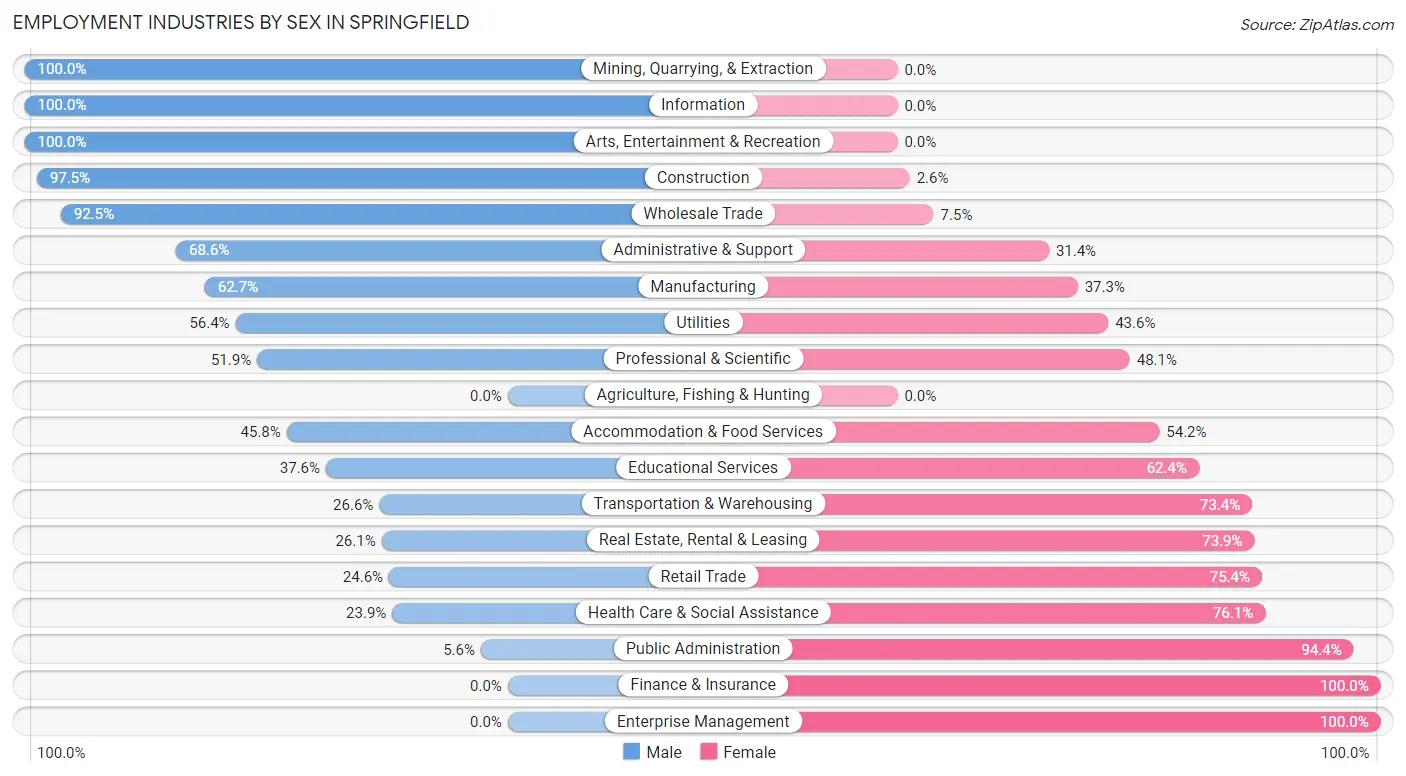
Employment Industries by Sex in Springfield
The Springfield industries that see more men than women are Mining, Quarrying, & Extraction (100.0%), Information (100.0%), and Arts, Entertainment & Recreation (100.0%), whereas the industries that tend to have a higher number of women are Finance & Insurance (100.0%), Enterprise Management (100.0%), and Public Administration (94.4%).
| Industry | Male | Female |
| Agriculture, Fishing & Hunting | 0 (0.0%) | 0 (0.0%) |
| Mining, Quarrying, & Extraction | 15 (100.0%) | 0 (0.0%) |
| Construction | 268 (97.5%) | 7 (2.5%) |
| Manufacturing | 252 (62.7%) | 150 (37.3%) |
| Wholesale Trade | 74 (92.5%) | 6 (7.5%) |
| Retail Trade | 150 (24.6%) | 460 (75.4%) |
| Transportation & Warehousing | 29 (26.6%) | 80 (73.4%) |
| Utilities | 31 (56.4%) | 24 (43.6%) |
| Information | 30 (100.0%) | 0 (0.0%) |
| Finance & Insurance | 0 (0.0%) | 134 (100.0%) |
| Real Estate, Rental & Leasing | 29 (26.1%) | 82 (73.9%) |
| Professional & Scientific | 123 (51.9%) | 114 (48.1%) |
| Enterprise Management | 0 (0.0%) | 59 (100.0%) |
| Administrative & Support | 162 (68.6%) | 74 (31.4%) |
| Educational Services | 67 (37.6%) | 111 (62.4%) |
| Health Care & Social Assistance | 83 (23.9%) | 264 (76.1%) |
| Arts, Entertainment & Recreation | 87 (100.0%) | 0 (0.0%) |
| Accommodation & Food Services | 114 (45.8%) | 135 (54.2%) |
| Public Administration | 13 (5.6%) | 220 (94.4%) |
| Total | 1,747 (45.2%) | 2,121 (54.8%) |
Education in Springfield
School Enrollment in Springfield
The most common levels of schooling among the 1,512 students in Springfield are college / undergraduate (402 | 26.6%), high school (363 | 24.0%), and elementary school (360 | 23.8%).
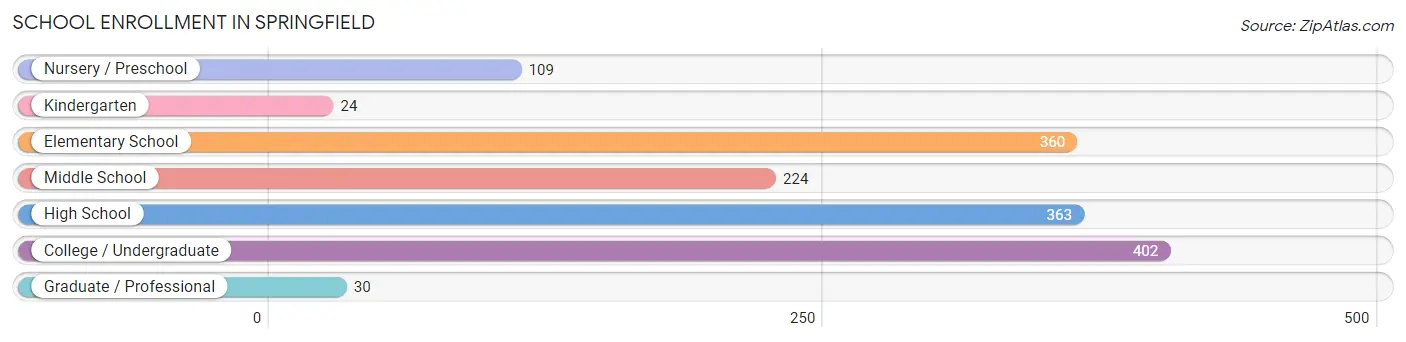
| School Level | # Students | % Students |
| Nursery / Preschool | 109 | 7.2% |
| Kindergarten | 24 | 1.6% |
| Elementary School | 360 | 23.8% |
| Middle School | 224 | 14.8% |
| High School | 363 | 24.0% |
| College / Undergraduate | 402 | 26.6% |
| Graduate / Professional | 30 | 2.0% |
| Total | 1,512 | 100.0% |
School Enrollment by Age by Funding Source in Springfield
Out of a total of 1,512 students who are enrolled in schools in Springfield, 304 (20.1%) attend a private institution, while the remaining 1,208 (79.9%) are enrolled in public schools. The age group of 35 years and over has the highest likelihood of being enrolled in private schools, with 41 (55.4% in the age bracket) enrolled. Conversely, the age group of 20 to 24 year olds has the lowest likelihood of being enrolled in a private school, with 120 (100.0% in the age bracket) attending a public institution.
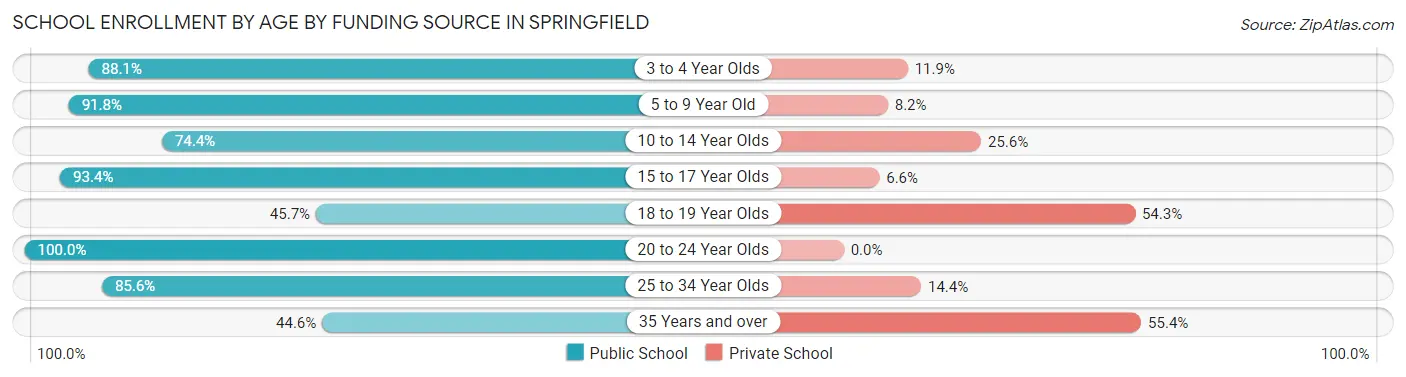
| Age Bracket | Public School | Private School |
| 3 to 4 Year Olds | 96 (88.1%) | 13 (11.9%) |
| 5 to 9 Year Old | 335 (91.8%) | 30 (8.2%) |
| 10 to 14 Year Olds | 157 (74.4%) | 54 (25.6%) |
| 15 to 17 Year Olds | 169 (93.4%) | 12 (6.6%) |
| 18 to 19 Year Olds | 102 (45.7%) | 121 (54.3%) |
| 20 to 24 Year Olds | 120 (100.0%) | 0 (0.0%) |
| 25 to 34 Year Olds | 196 (85.6%) | 33 (14.4%) |
| 35 Years and over | 33 (44.6%) | 41 (55.4%) |
| Total | 1,208 (79.9%) | 304 (20.1%) |
Educational Attainment by Field of Study in Springfield
Business (138 | 21.6%), education (83 | 13.0%), communications (70 | 10.9%), psychology (64 | 10.0%), and visual & performing arts (62 | 9.7%) are the most common fields of study among 640 individuals in Springfield who have obtained a bachelor's degree or higher.
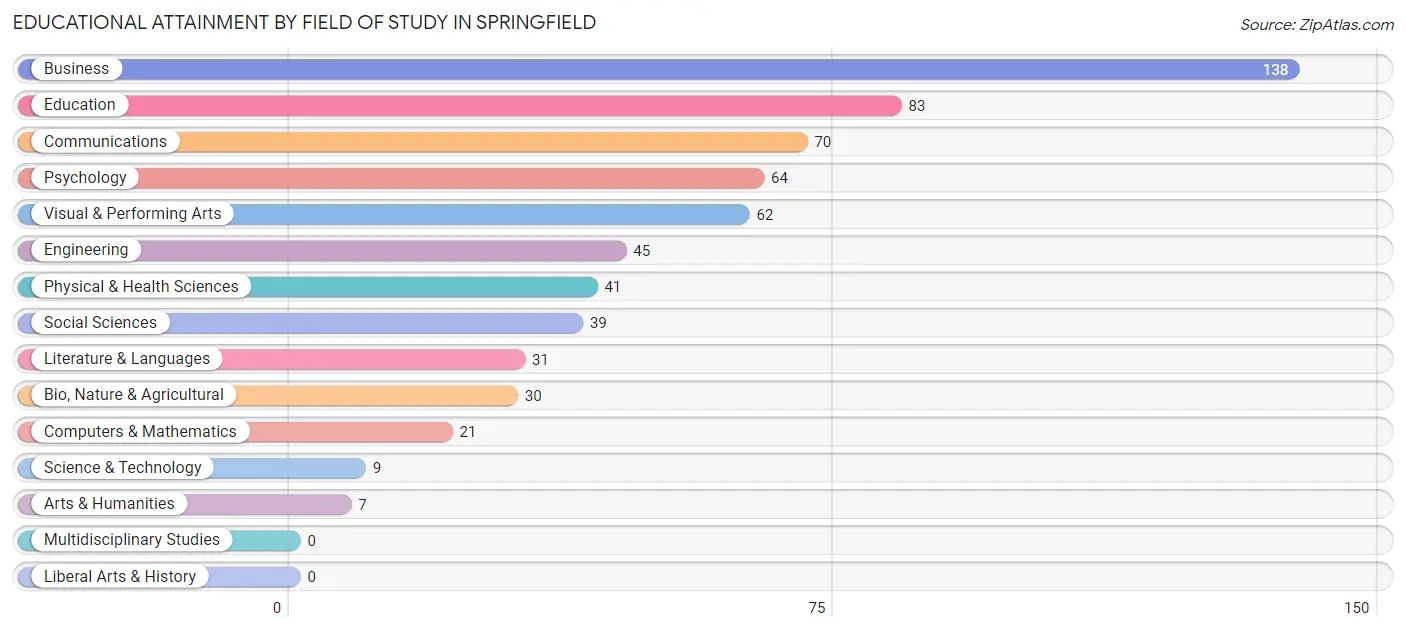
| Field of Study | # Graduates | % Graduates |
| Computers & Mathematics | 21 | 3.3% |
| Bio, Nature & Agricultural | 30 | 4.7% |
| Physical & Health Sciences | 41 | 6.4% |
| Psychology | 64 | 10.0% |
| Social Sciences | 39 | 6.1% |
| Engineering | 45 | 7.0% |
| Multidisciplinary Studies | 0 | 0.0% |
| Science & Technology | 9 | 1.4% |
| Business | 138 | 21.6% |
| Education | 83 | 13.0% |
| Literature & Languages | 31 | 4.8% |
| Liberal Arts & History | 0 | 0.0% |
| Visual & Performing Arts | 62 | 9.7% |
| Communications | 70 | 10.9% |
| Arts & Humanities | 7 | 1.1% |
| Total | 640 | 100.0% |
Transportation & Commute in Springfield
Vehicle Availability by Sex in Springfield
The most prevalent vehicle ownership categories in Springfield are males with 2 vehicles (660, accounting for 36.2%) and females with 2 vehicles (779, making up 32.0%).
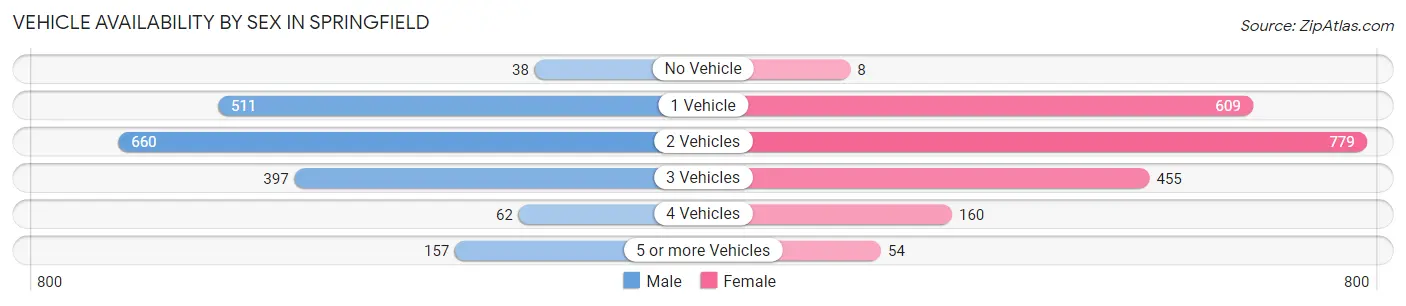
| Vehicles Available | Male | Female |
| No Vehicle | 38 (2.1%) | 8 (0.4%) |
| 1 Vehicle | 511 (28.0%) | 609 (29.5%) |
| 2 Vehicles | 660 (36.2%) | 779 (37.7%) |
| 3 Vehicles | 397 (21.7%) | 455 (22.0%) |
| 4 Vehicles | 62 (3.4%) | 160 (7.7%) |
| 5 or more Vehicles | 157 (8.6%) | 54 (2.6%) |
| Total | 1,825 (100.0%) | 2,065 (100.0%) |
Commute Time in Springfield
The most frequently occuring commute durations in Springfield are 15 to 19 minutes (753 commuters, 20.3%), 10 to 14 minutes (659 commuters, 17.7%), and 20 to 24 minutes (547 commuters, 14.7%).
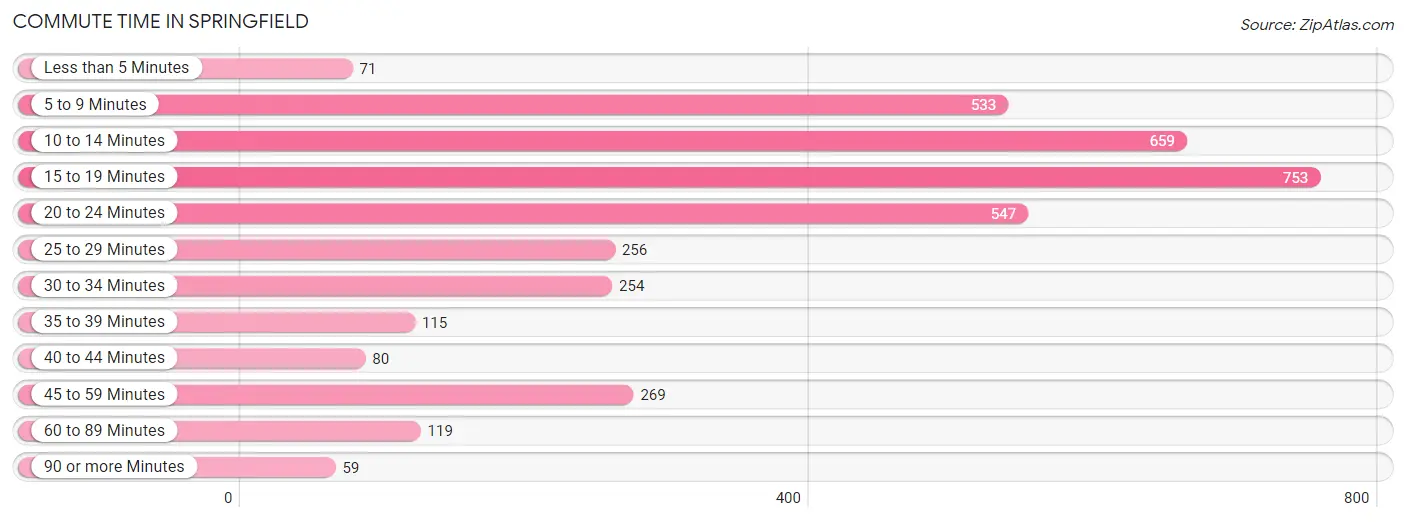
| Commute Time | # Commuters | % Commuters |
| Less than 5 Minutes | 71 | 1.9% |
| 5 to 9 Minutes | 533 | 14.3% |
| 10 to 14 Minutes | 659 | 17.7% |
| 15 to 19 Minutes | 753 | 20.3% |
| 20 to 24 Minutes | 547 | 14.7% |
| 25 to 29 Minutes | 256 | 6.9% |
| 30 to 34 Minutes | 254 | 6.8% |
| 35 to 39 Minutes | 115 | 3.1% |
| 40 to 44 Minutes | 80 | 2.1% |
| 45 to 59 Minutes | 269 | 7.2% |
| 60 to 89 Minutes | 119 | 3.2% |
| 90 or more Minutes | 59 | 1.6% |
Commute Time by Sex in Springfield
The most common commute times in Springfield are 15 to 19 minutes (510 commuters, 30.2%) for males and 10 to 14 minutes (532 commuters, 26.3%) for females.
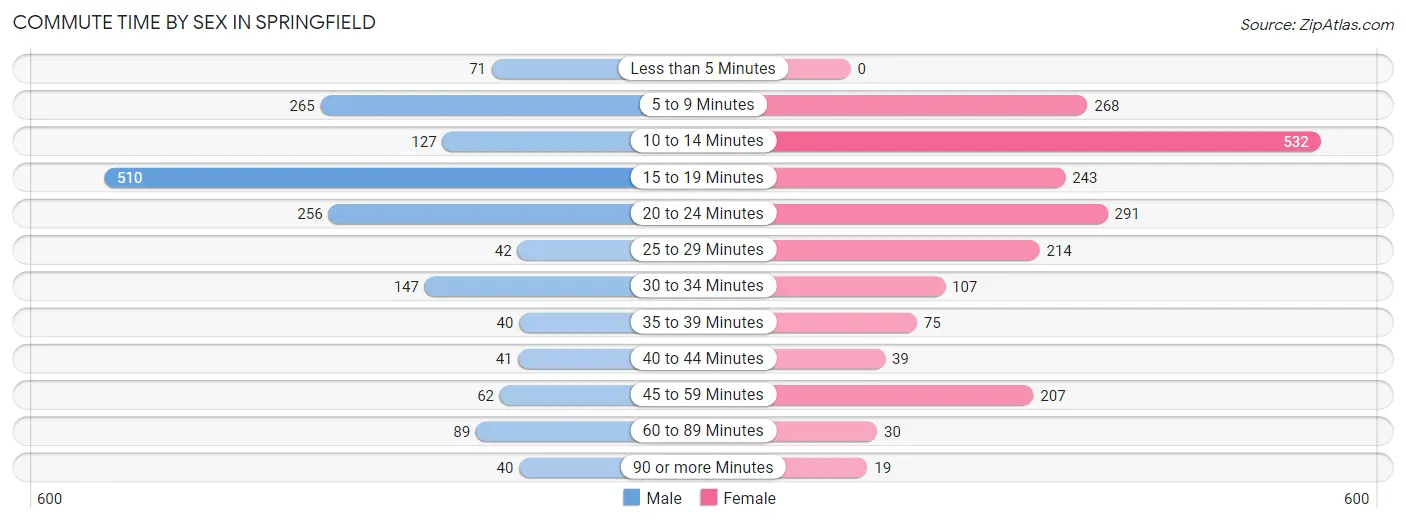
| Commute Time | Male | Female |
| Less than 5 Minutes | 71 (4.2%) | 0 (0.0%) |
| 5 to 9 Minutes | 265 (15.7%) | 268 (13.2%) |
| 10 to 14 Minutes | 127 (7.5%) | 532 (26.3%) |
| 15 to 19 Minutes | 510 (30.2%) | 243 (12.0%) |
| 20 to 24 Minutes | 256 (15.1%) | 291 (14.4%) |
| 25 to 29 Minutes | 42 (2.5%) | 214 (10.6%) |
| 30 to 34 Minutes | 147 (8.7%) | 107 (5.3%) |
| 35 to 39 Minutes | 40 (2.4%) | 75 (3.7%) |
| 40 to 44 Minutes | 41 (2.4%) | 39 (1.9%) |
| 45 to 59 Minutes | 62 (3.7%) | 207 (10.2%) |
| 60 to 89 Minutes | 89 (5.3%) | 30 (1.5%) |
| 90 or more Minutes | 40 (2.4%) | 19 (0.9%) |
Time of Departure to Work by Sex in Springfield
The most frequent times of departure to work in Springfield are 6:30 AM to 6:59 AM (270, 16.0%) for males and 9:00 AM to 9:59 AM (288, 14.2%) for females.
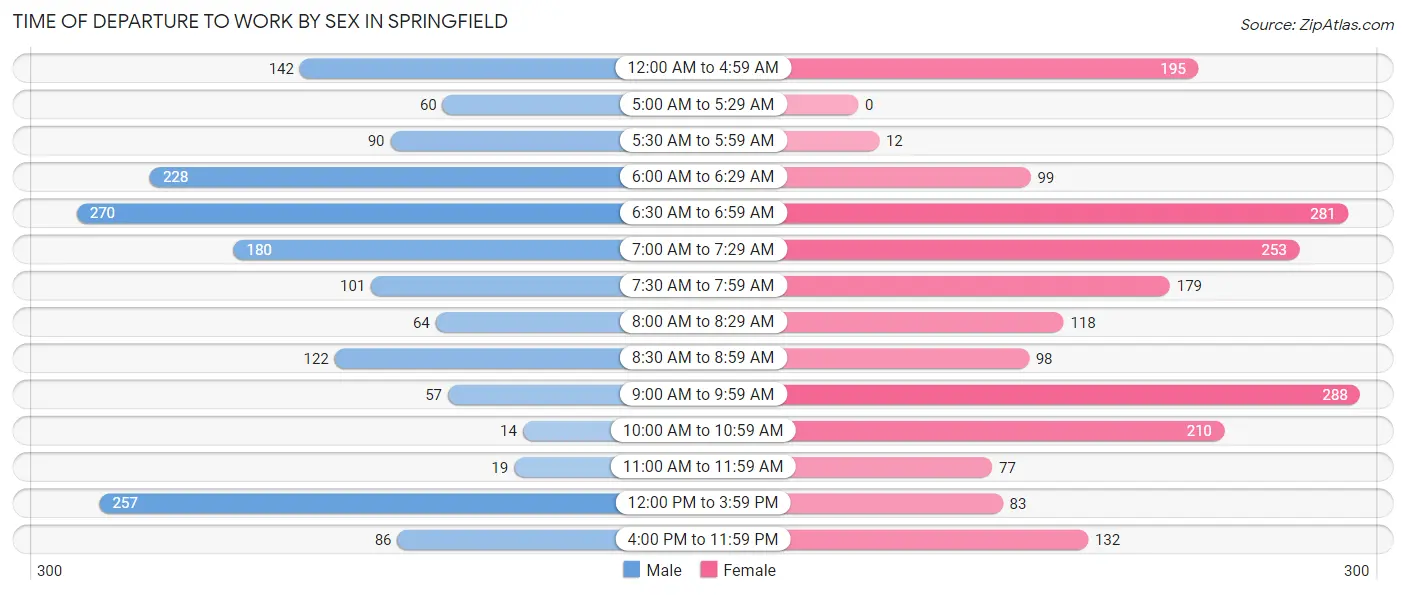
| Time of Departure | Male | Female |
| 12:00 AM to 4:59 AM | 142 (8.4%) | 195 (9.6%) |
| 5:00 AM to 5:29 AM | 60 (3.5%) | 0 (0.0%) |
| 5:30 AM to 5:59 AM | 90 (5.3%) | 12 (0.6%) |
| 6:00 AM to 6:29 AM | 228 (13.5%) | 99 (4.9%) |
| 6:30 AM to 6:59 AM | 270 (16.0%) | 281 (13.9%) |
| 7:00 AM to 7:29 AM | 180 (10.6%) | 253 (12.5%) |
| 7:30 AM to 7:59 AM | 101 (6.0%) | 179 (8.8%) |
| 8:00 AM to 8:29 AM | 64 (3.8%) | 118 (5.8%) |
| 8:30 AM to 8:59 AM | 122 (7.2%) | 98 (4.8%) |
| 9:00 AM to 9:59 AM | 57 (3.4%) | 288 (14.2%) |
| 10:00 AM to 10:59 AM | 14 (0.8%) | 210 (10.4%) |
| 11:00 AM to 11:59 AM | 19 (1.1%) | 77 (3.8%) |
| 12:00 PM to 3:59 PM | 257 (15.2%) | 83 (4.1%) |
| 4:00 PM to 11:59 PM | 86 (5.1%) | 132 (6.5%) |
| Total | 1,690 (100.0%) | 2,025 (100.0%) |
Housing Occupancy in Springfield
Occupancy by Ownership in Springfield
Of the total 3,490 dwellings in Springfield, owner-occupied units account for 2,368 (67.8%), while renter-occupied units make up 1,122 (32.2%).
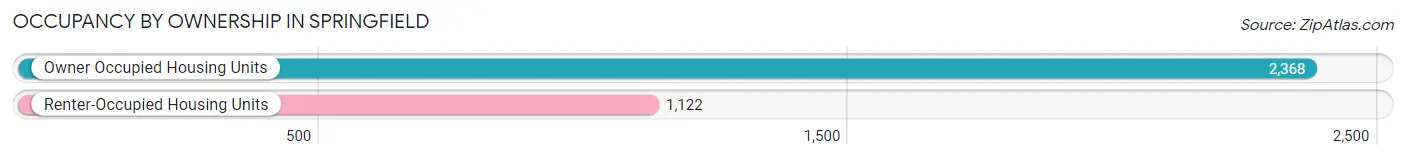
| Occupancy | # Housing Units | % Housing Units |
| Owner Occupied Housing Units | 2,368 | 67.8% |
| Renter-Occupied Housing Units | 1,122 | 32.2% |
| Total Occupied Housing Units | 3,490 | 100.0% |
Occupancy by Household Size in Springfield
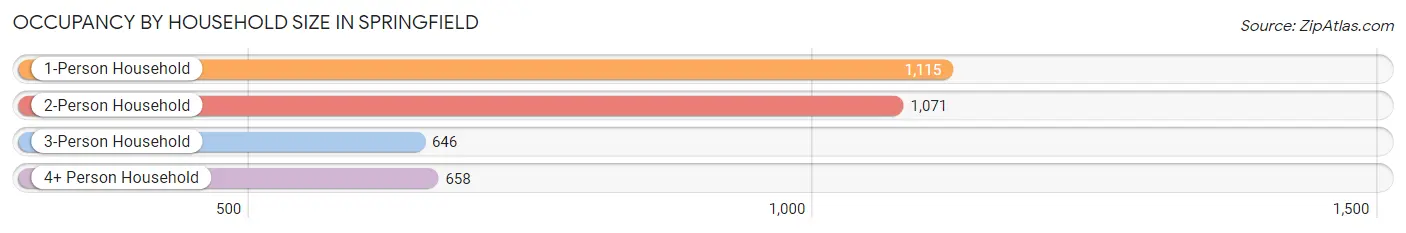
| Household Size | # Housing Units | % Housing Units |
| 1-Person Household | 1,115 | 32.0% |
| 2-Person Household | 1,071 | 30.7% |
| 3-Person Household | 646 | 18.5% |
| 4+ Person Household | 658 | 18.9% |
| Total Housing Units | 3,490 | 100.0% |
Occupancy by Ownership by Household Size in Springfield
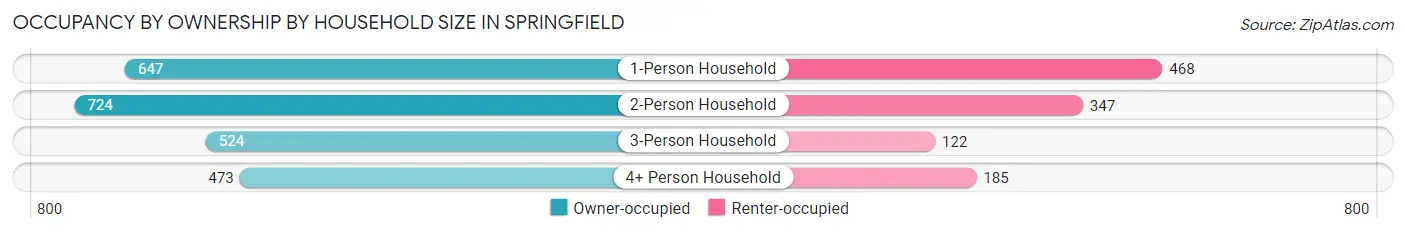
| Household Size | Owner-occupied | Renter-occupied |
| 1-Person Household | 647 (58.0%) | 468 (42.0%) |
| 2-Person Household | 724 (67.6%) | 347 (32.4%) |
| 3-Person Household | 524 (81.1%) | 122 (18.9%) |
| 4+ Person Household | 473 (71.9%) | 185 (28.1%) |
| Total Housing Units | 2,368 (67.8%) | 1,122 (32.2%) |
Occupancy by Educational Attainment in Springfield
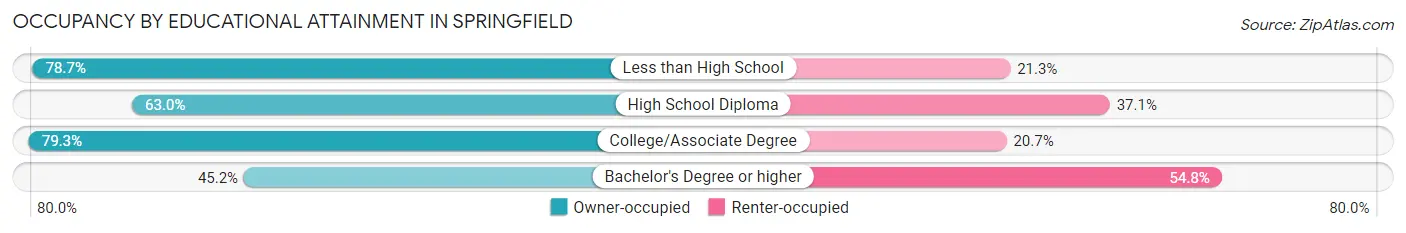
| Household Size | Owner-occupied | Renter-occupied |
| Less than High School | 274 (78.7%) | 74 (21.3%) |
| High School Diploma | 943 (62.9%) | 555 (37.0%) |
| College/Associate Degree | 948 (79.3%) | 247 (20.7%) |
| Bachelor's Degree or higher | 203 (45.2%) | 246 (54.8%) |
Occupancy by Age of Householder in Springfield
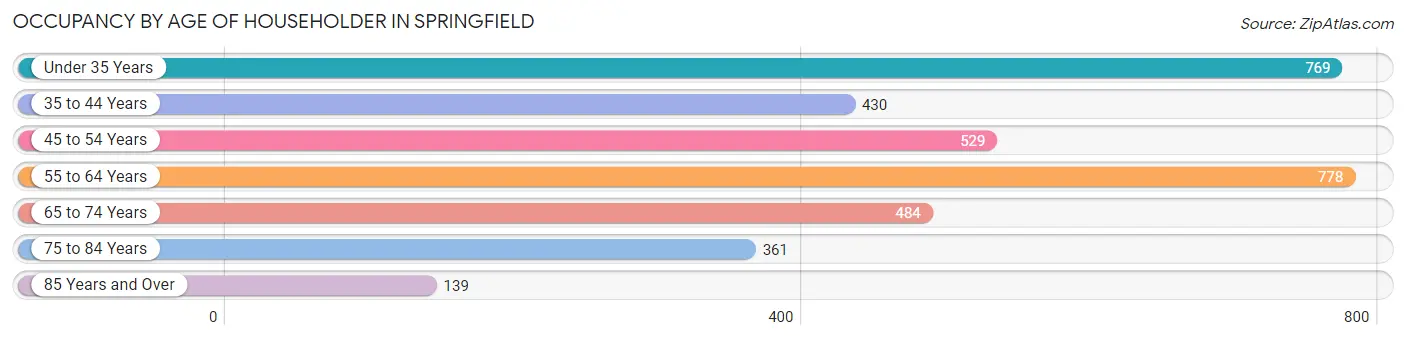
| Age Bracket | # Households | % Households |
| Under 35 Years | 769 | 22.0% |
| 35 to 44 Years | 430 | 12.3% |
| 45 to 54 Years | 529 | 15.2% |
| 55 to 64 Years | 778 | 22.3% |
| 65 to 74 Years | 484 | 13.9% |
| 75 to 84 Years | 361 | 10.3% |
| 85 Years and Over | 139 | 4.0% |
| Total | 3,490 | 100.0% |
Housing Finances in Springfield
Median Income by Occupancy in Springfield
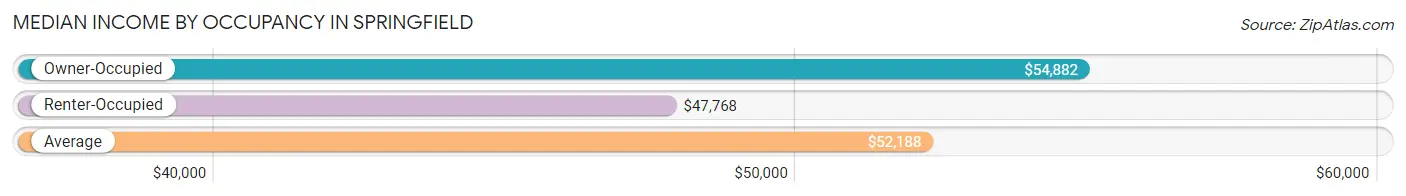
| Occupancy Type | # Households | Median Income |
| Owner-Occupied | 2,368 (67.8%) | $54,882 |
| Renter-Occupied | 1,122 (32.2%) | $47,768 |
| Average | 3,490 (100.0%) | $52,188 |
Occupancy by Householder Income Bracket in Springfield
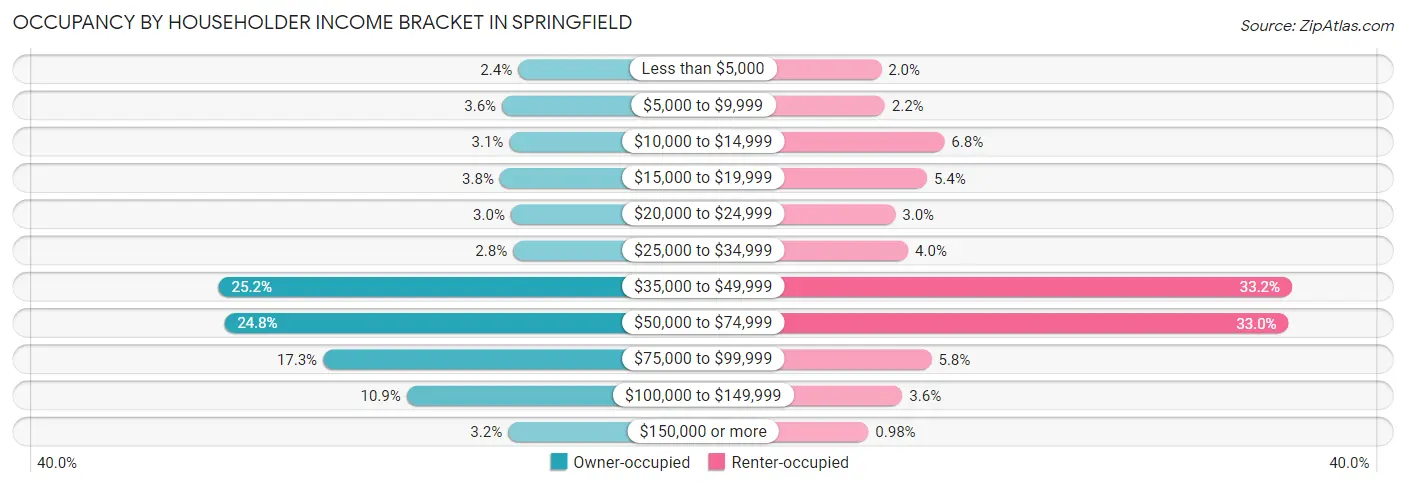
| Income Bracket | Owner-occupied | Renter-occupied |
| Less than $5,000 | 57 (2.4%) | 22 (2.0%) |
| $5,000 to $9,999 | 86 (3.6%) | 25 (2.2%) |
| $10,000 to $14,999 | 73 (3.1%) | 76 (6.8%) |
| $15,000 to $19,999 | 90 (3.8%) | 61 (5.4%) |
| $20,000 to $24,999 | 70 (3.0%) | 34 (3.0%) |
| $25,000 to $34,999 | 66 (2.8%) | 45 (4.0%) |
| $35,000 to $49,999 | 597 (25.2%) | 373 (33.2%) |
| $50,000 to $74,999 | 587 (24.8%) | 370 (33.0%) |
| $75,000 to $99,999 | 409 (17.3%) | 65 (5.8%) |
| $100,000 to $149,999 | 258 (10.9%) | 40 (3.6%) |
| $150,000 or more | 75 (3.2%) | 11 (1.0%) |
| Total | 2,368 (100.0%) | 1,122 (100.0%) |
Monthly Housing Cost Tiers in Springfield
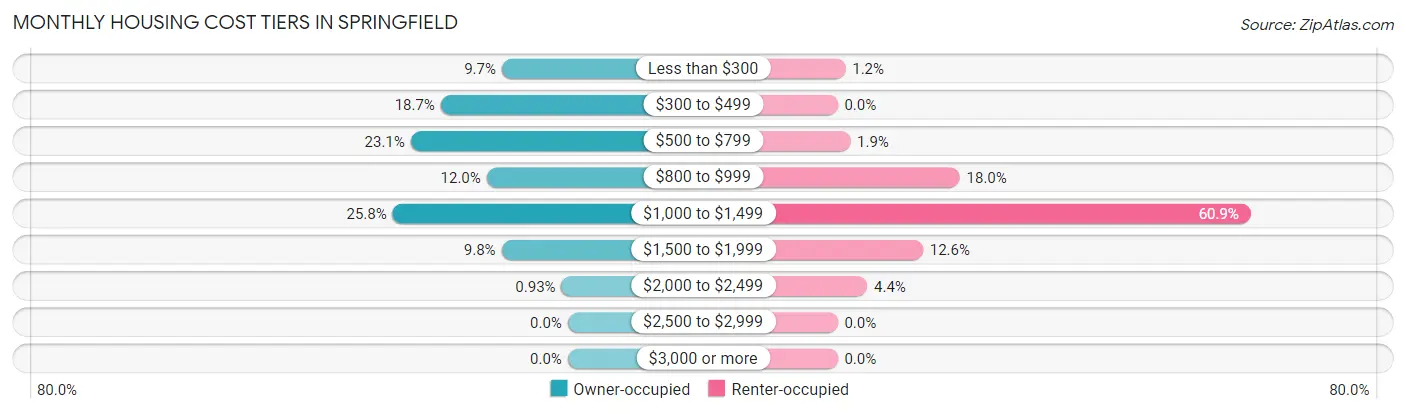
| Monthly Cost | Owner-occupied | Renter-occupied |
| Less than $300 | 230 (9.7%) | 13 (1.2%) |
| $300 to $499 | 443 (18.7%) | 0 (0.0%) |
| $500 to $799 | 548 (23.1%) | 21 (1.9%) |
| $800 to $999 | 283 (11.9%) | 202 (18.0%) |
| $1,000 to $1,499 | 611 (25.8%) | 683 (60.9%) |
| $1,500 to $1,999 | 231 (9.8%) | 141 (12.6%) |
| $2,000 to $2,499 | 22 (0.9%) | 49 (4.4%) |
| $2,500 to $2,999 | 0 (0.0%) | 0 (0.0%) |
| $3,000 or more | 0 (0.0%) | 0 (0.0%) |
| Total | 2,368 (100.0%) | 1,122 (100.0%) |
Physical Housing Characteristics in Springfield
Housing Structures in Springfield
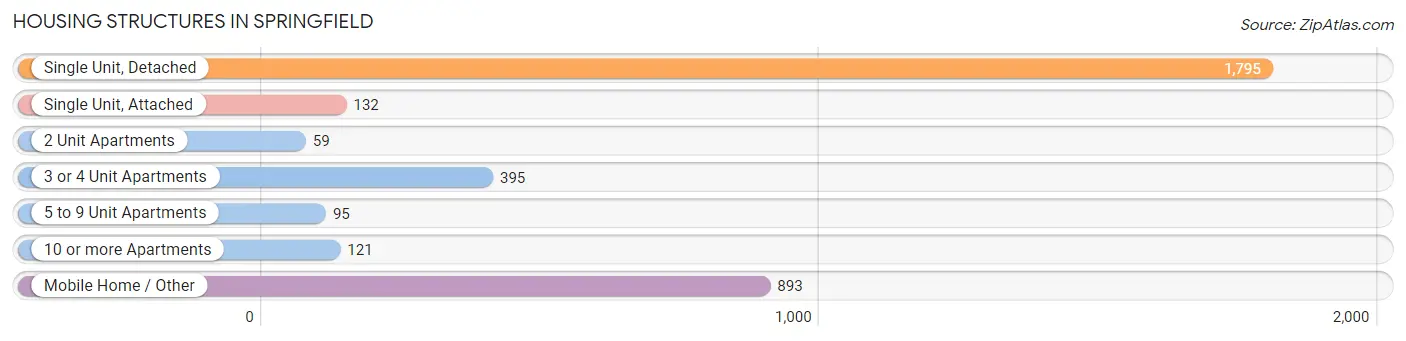
| Structure Type | # Housing Units | % Housing Units |
| Single Unit, Detached | 1,795 | 51.4% |
| Single Unit, Attached | 132 | 3.8% |
| 2 Unit Apartments | 59 | 1.7% |
| 3 or 4 Unit Apartments | 395 | 11.3% |
| 5 to 9 Unit Apartments | 95 | 2.7% |
| 10 or more Apartments | 121 | 3.5% |
| Mobile Home / Other | 893 | 25.6% |
| Total | 3,490 | 100.0% |
Housing Structures by Occupancy in Springfield
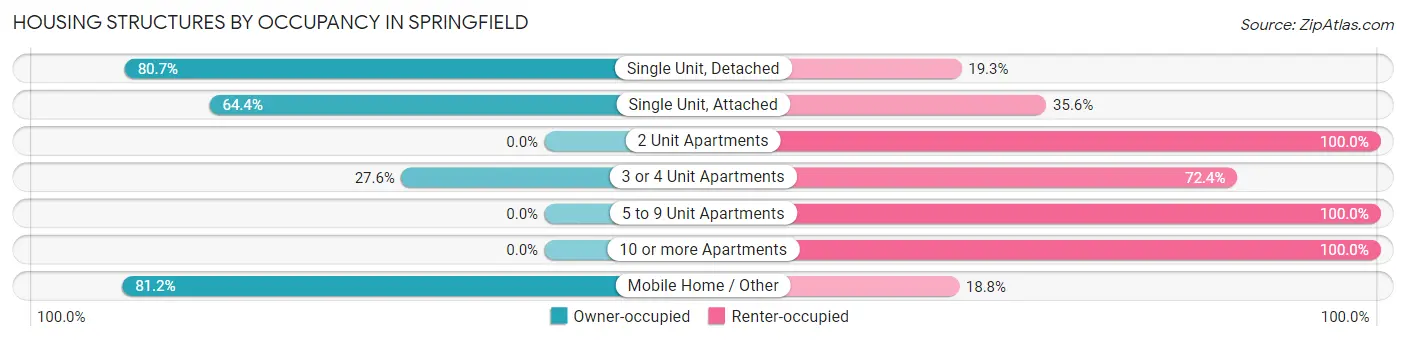
| Structure Type | Owner-occupied | Renter-occupied |
| Single Unit, Detached | 1,449 (80.7%) | 346 (19.3%) |
| Single Unit, Attached | 85 (64.4%) | 47 (35.6%) |
| 2 Unit Apartments | 0 (0.0%) | 59 (100.0%) |
| 3 or 4 Unit Apartments | 109 (27.6%) | 286 (72.4%) |
| 5 to 9 Unit Apartments | 0 (0.0%) | 95 (100.0%) |
| 10 or more Apartments | 0 (0.0%) | 121 (100.0%) |
| Mobile Home / Other | 725 (81.2%) | 168 (18.8%) |
| Total | 2,368 (67.8%) | 1,122 (32.2%) |
Housing Structures by Number of Rooms in Springfield
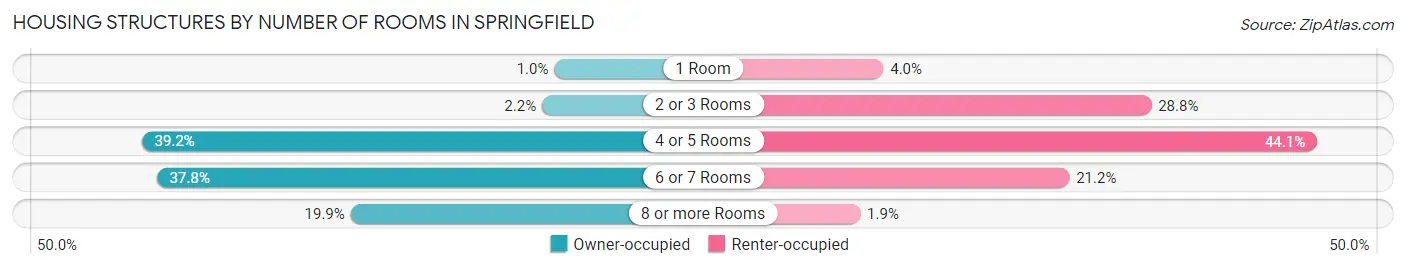
| Number of Rooms | Owner-occupied | Renter-occupied |
| 1 Room | 24 (1.0%) | 45 (4.0%) |
| 2 or 3 Rooms | 51 (2.1%) | 323 (28.8%) |
| 4 or 5 Rooms | 928 (39.2%) | 495 (44.1%) |
| 6 or 7 Rooms | 895 (37.8%) | 238 (21.2%) |
| 8 or more Rooms | 470 (19.9%) | 21 (1.9%) |
| Total | 2,368 (100.0%) | 1,122 (100.0%) |
Housing Structure by Heating Type in Springfield
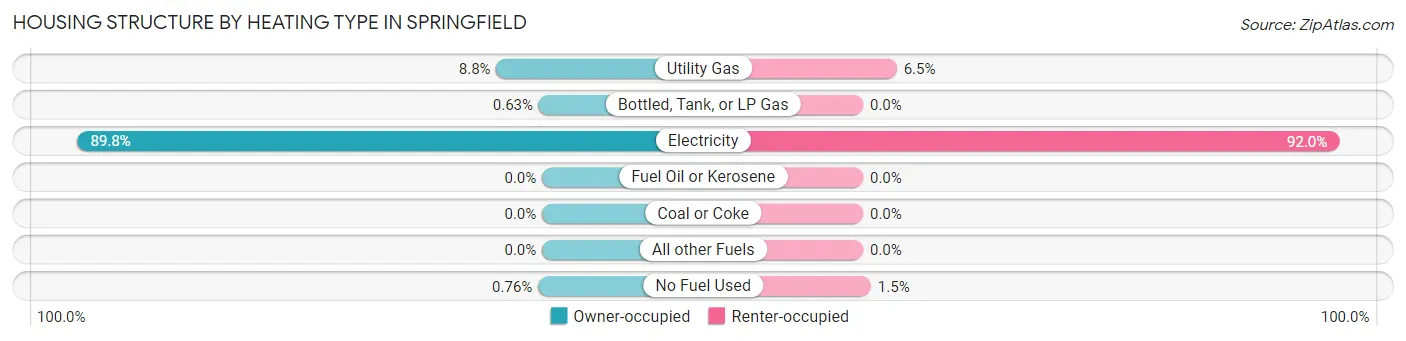
| Heating Type | Owner-occupied | Renter-occupied |
| Utility Gas | 209 (8.8%) | 73 (6.5%) |
| Bottled, Tank, or LP Gas | 15 (0.6%) | 0 (0.0%) |
| Electricity | 2,126 (89.8%) | 1,032 (92.0%) |
| Fuel Oil or Kerosene | 0 (0.0%) | 0 (0.0%) |
| Coal or Coke | 0 (0.0%) | 0 (0.0%) |
| All other Fuels | 0 (0.0%) | 0 (0.0%) |
| No Fuel Used | 18 (0.8%) | 17 (1.5%) |
| Total | 2,368 (100.0%) | 1,122 (100.0%) |
Household Vehicle Usage in Springfield
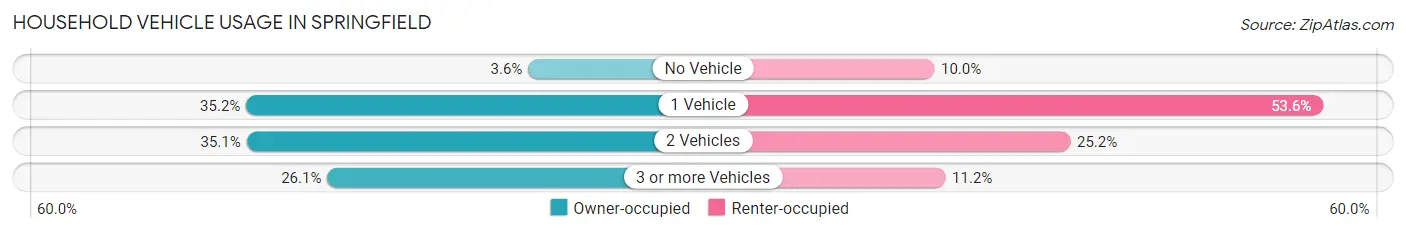
| Vehicles per Household | Owner-occupied | Renter-occupied |
| No Vehicle | 85 (3.6%) | 112 (10.0%) |
| 1 Vehicle | 833 (35.2%) | 601 (53.6%) |
| 2 Vehicles | 832 (35.1%) | 283 (25.2%) |
| 3 or more Vehicles | 618 (26.1%) | 126 (11.2%) |
| Total | 2,368 (100.0%) | 1,122 (100.0%) |
Real Estate & Mortgages in Springfield
Real Estate and Mortgage Overview in Springfield
| Characteristic | Without Mortgage | With Mortgage |
| Housing Units | 1,222 | 1,146 |
| Median Property Value | $123,700 | $156,200 |
| Median Household Income | $55,660 | $7 |
| Monthly Housing Costs | $473 | $0 |
| Real Estate Taxes | $737 | $278 |
Property Value by Mortgage Status in Springfield
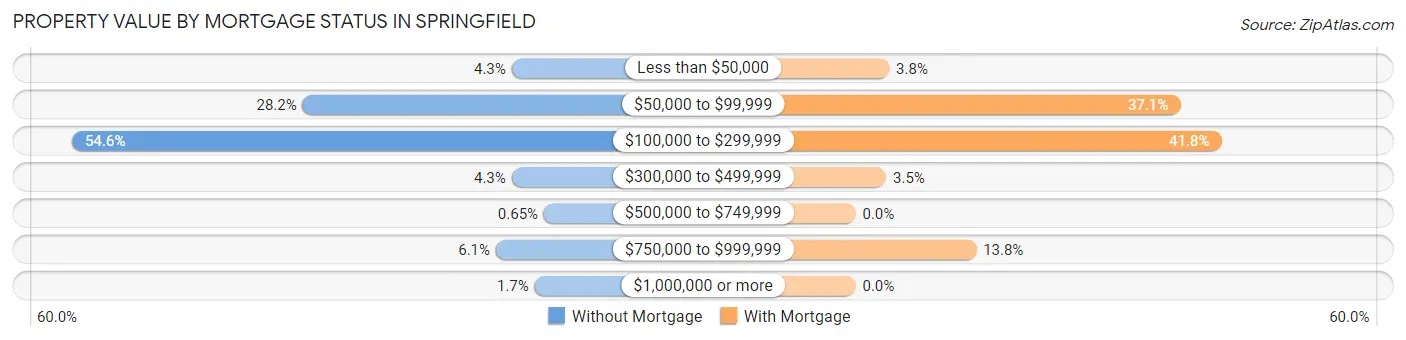
| Property Value | Without Mortgage | With Mortgage |
| Less than $50,000 | 53 (4.3%) | 44 (3.8%) |
| $50,000 to $99,999 | 345 (28.2%) | 425 (37.1%) |
| $100,000 to $299,999 | 667 (54.6%) | 479 (41.8%) |
| $300,000 to $499,999 | 53 (4.3%) | 40 (3.5%) |
| $500,000 to $749,999 | 8 (0.6%) | 0 (0.0%) |
| $750,000 to $999,999 | 75 (6.1%) | 158 (13.8%) |
| $1,000,000 or more | 21 (1.7%) | 0 (0.0%) |
| Total | 1,222 (100.0%) | 1,146 (100.0%) |
Household Income by Mortgage Status in Springfield
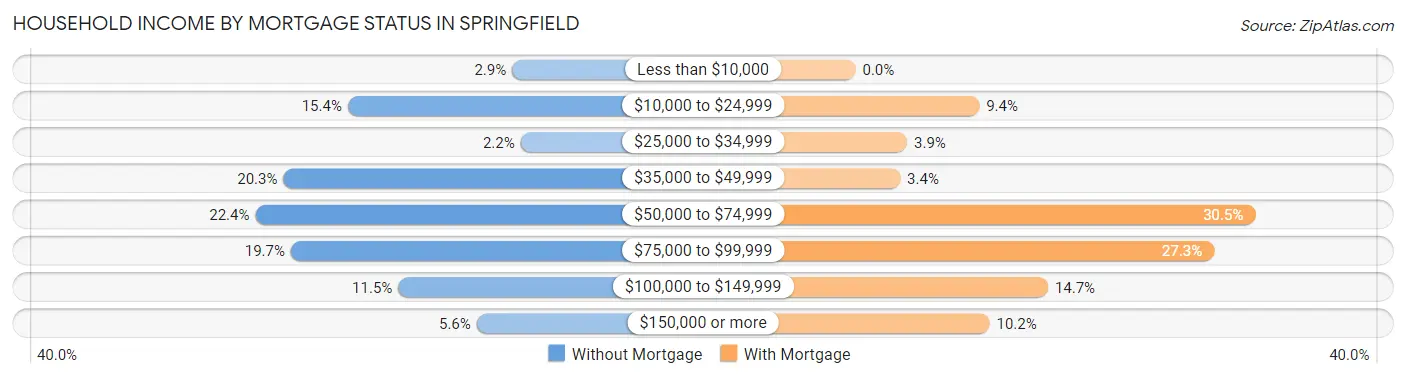
| Household Income | Without Mortgage | With Mortgage |
| Less than $10,000 | 35 (2.9%) | 0 (0.0%) |
| $10,000 to $24,999 | 188 (15.4%) | 108 (9.4%) |
| $25,000 to $34,999 | 27 (2.2%) | 45 (3.9%) |
| $35,000 to $49,999 | 248 (20.3%) | 39 (3.4%) |
| $50,000 to $74,999 | 274 (22.4%) | 349 (30.4%) |
| $75,000 to $99,999 | 241 (19.7%) | 313 (27.3%) |
| $100,000 to $149,999 | 141 (11.5%) | 168 (14.7%) |
| $150,000 or more | 68 (5.6%) | 117 (10.2%) |
| Total | 1,222 (100.0%) | 1,146 (100.0%) |
Property Value to Household Income Ratio in Springfield
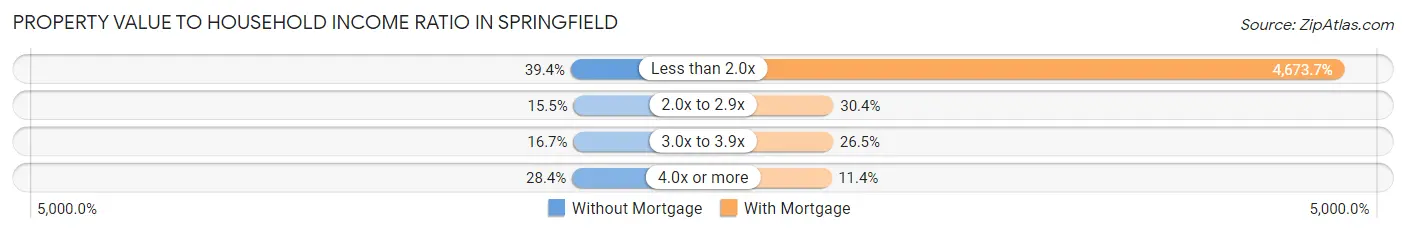
| Value-to-Income Ratio | Without Mortgage | With Mortgage |
| Less than 2.0x | 482 (39.4%) | 53,561 (4,673.7%) |
| 2.0x to 2.9x | 189 (15.5%) | 348 (30.4%) |
| 3.0x to 3.9x | 204 (16.7%) | 304 (26.5%) |
| 4.0x or more | 347 (28.4%) | 131 (11.4%) |
| Total | 1,222 (100.0%) | 1,146 (100.0%) |
Real Estate Taxes by Mortgage Status in Springfield
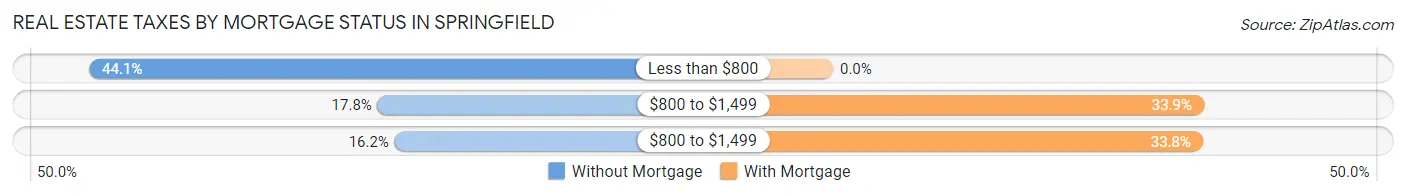
| Property Taxes | Without Mortgage | With Mortgage |
| Less than $800 | 539 (44.1%) | 0 (0.0%) |
| $800 to $1,499 | 217 (17.8%) | 388 (33.9%) |
| $800 to $1,499 | 198 (16.2%) | 387 (33.8%) |
| Total | 1,222 (100.0%) | 1,146 (100.0%) |
Health & Disability in Springfield
Health Insurance Coverage by Age in Springfield
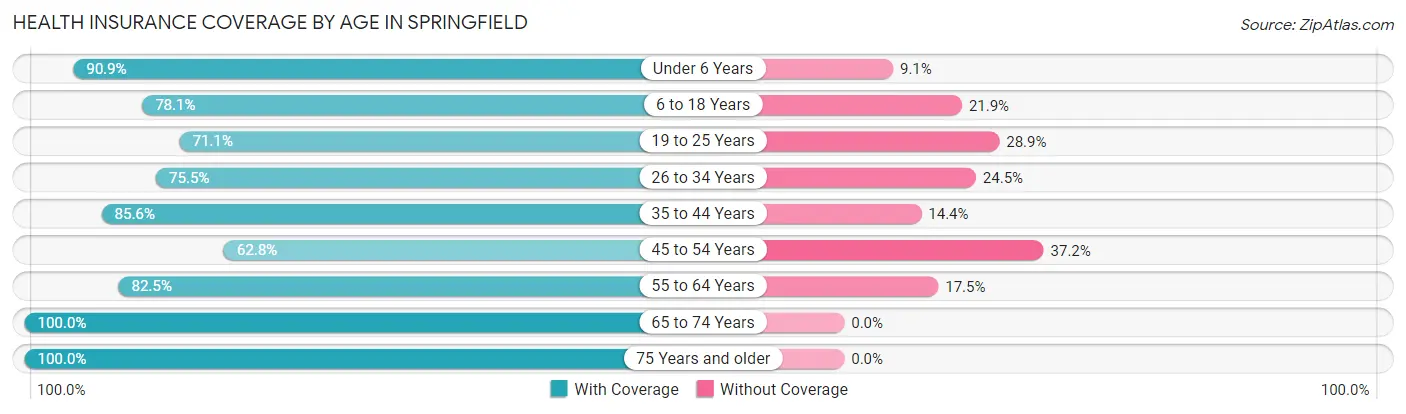
| Age Bracket | With Coverage | Without Coverage |
| Under 6 Years | 460 (90.9%) | 46 (9.1%) |
| 6 to 18 Years | 726 (78.1%) | 204 (21.9%) |
| 19 to 25 Years | 593 (71.1%) | 241 (28.9%) |
| 26 to 34 Years | 655 (75.5%) | 213 (24.5%) |
| 35 to 44 Years | 906 (85.6%) | 152 (14.4%) |
| 45 to 54 Years | 573 (62.8%) | 339 (37.2%) |
| 55 to 64 Years | 1,040 (82.5%) | 221 (17.5%) |
| 65 to 74 Years | 1,011 (100.0%) | 0 (0.0%) |
| 75 Years and older | 696 (100.0%) | 0 (0.0%) |
| Total | 6,660 (82.5%) | 1,416 (17.5%) |
Health Insurance Coverage by Citizenship Status in Springfield
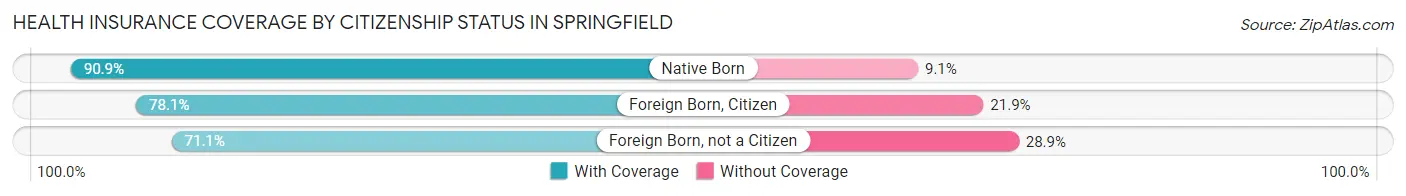
| Citizenship Status | With Coverage | Without Coverage |
| Native Born | 460 (90.9%) | 46 (9.1%) |
| Foreign Born, Citizen | 726 (78.1%) | 204 (21.9%) |
| Foreign Born, not a Citizen | 593 (71.1%) | 241 (28.9%) |
Health Insurance Coverage by Household Income in Springfield
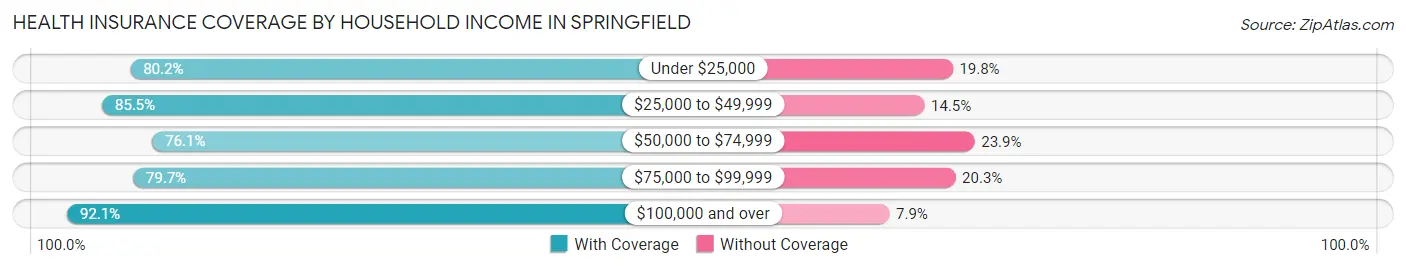
| Household Income | With Coverage | Without Coverage |
| Under $25,000 | 920 (80.2%) | 227 (19.8%) |
| $25,000 to $49,999 | 1,736 (85.5%) | 294 (14.5%) |
| $50,000 to $74,999 | 1,580 (76.1%) | 496 (23.9%) |
| $75,000 to $99,999 | 1,119 (79.7%) | 285 (20.3%) |
| $100,000 and over | 1,300 (92.1%) | 112 (7.9%) |
Public vs Private Health Insurance Coverage by Age in Springfield
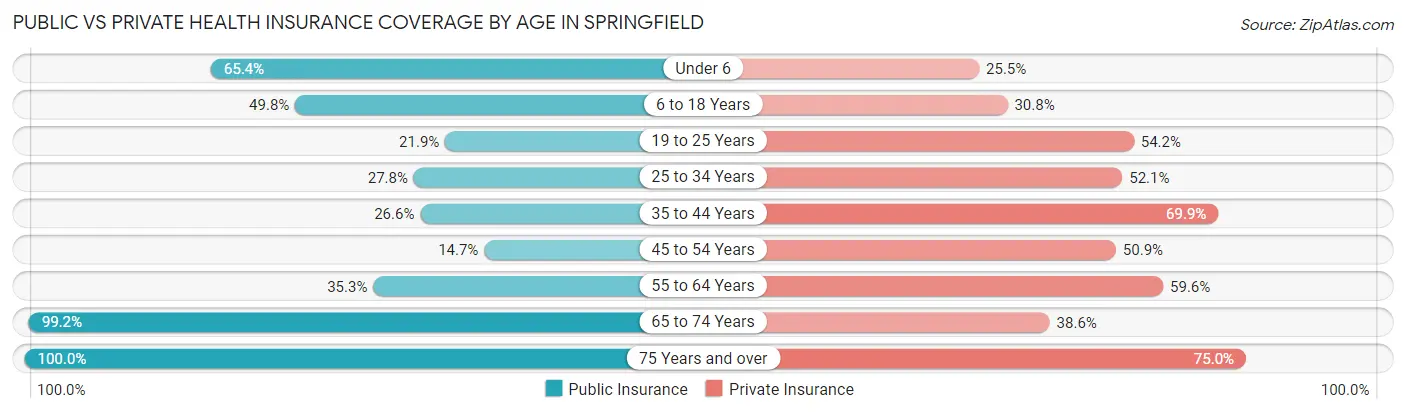
| Age Bracket | Public Insurance | Private Insurance |
| Under 6 | 331 (65.4%) | 129 (25.5%) |
| 6 to 18 Years | 463 (49.8%) | 286 (30.7%) |
| 19 to 25 Years | 183 (21.9%) | 452 (54.2%) |
| 25 to 34 Years | 241 (27.8%) | 452 (52.1%) |
| 35 to 44 Years | 281 (26.6%) | 739 (69.9%) |
| 45 to 54 Years | 134 (14.7%) | 464 (50.9%) |
| 55 to 64 Years | 445 (35.3%) | 752 (59.6%) |
| 65 to 74 Years | 1,003 (99.2%) | 390 (38.6%) |
| 75 Years and over | 696 (100.0%) | 522 (75.0%) |
| Total | 3,777 (46.8%) | 4,186 (51.8%) |
Disability Status by Sex by Age in Springfield
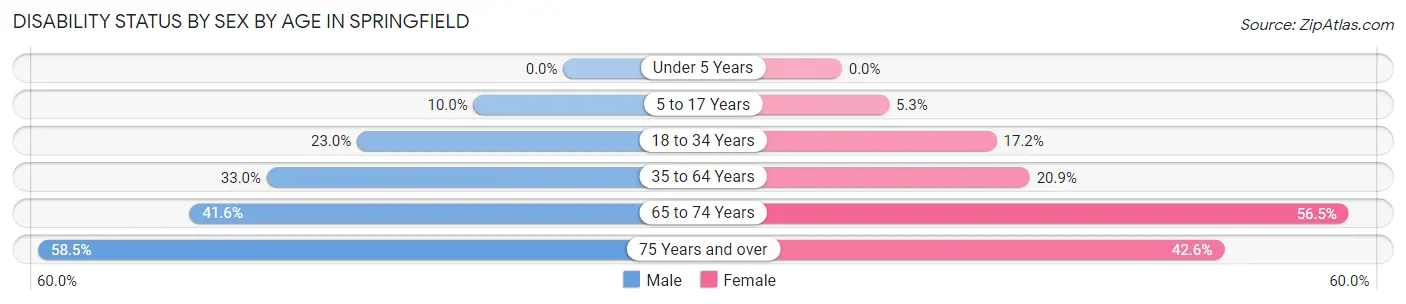
| Age Bracket | Male | Female |
| Under 5 Years | 0 (0.0%) | 0 (0.0%) |
| 5 to 17 Years | 45 (10.0%) | 16 (5.3%) |
| 18 to 34 Years | 193 (23.0%) | 181 (17.2%) |
| 35 to 64 Years | 562 (33.0%) | 320 (20.9%) |
| 65 to 74 Years | 179 (41.6%) | 328 (56.5%) |
| 75 Years and over | 234 (58.5%) | 126 (42.6%) |
Disability Class by Sex by Age in Springfield
Disability Class: Hearing Difficulty
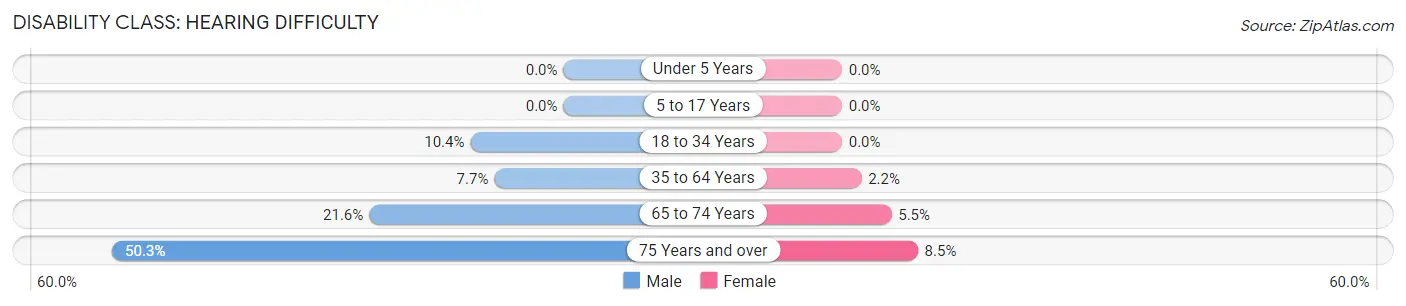
| Age Bracket | Male | Female |
| Under 5 Years | 0 (0.0%) | 0 (0.0%) |
| 5 to 17 Years | 0 (0.0%) | 0 (0.0%) |
| 18 to 34 Years | 87 (10.4%) | 0 (0.0%) |
| 35 to 64 Years | 131 (7.7%) | 33 (2.2%) |
| 65 to 74 Years | 93 (21.6%) | 32 (5.5%) |
| 75 Years and over | 201 (50.2%) | 25 (8.5%) |
Disability Class: Vision Difficulty
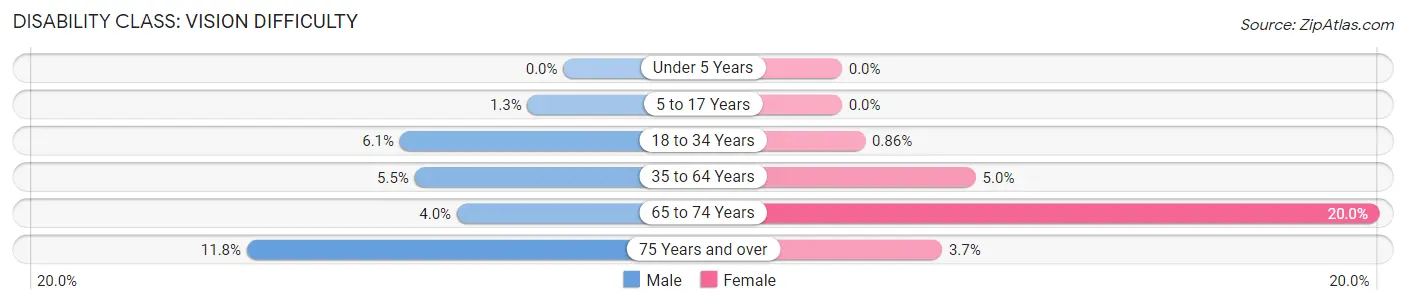
| Age Bracket | Male | Female |
| Under 5 Years | 0 (0.0%) | 0 (0.0%) |
| 5 to 17 Years | 6 (1.3%) | 0 (0.0%) |
| 18 to 34 Years | 51 (6.1%) | 9 (0.9%) |
| 35 to 64 Years | 94 (5.5%) | 76 (5.0%) |
| 65 to 74 Years | 17 (4.0%) | 116 (20.0%) |
| 75 Years and over | 47 (11.7%) | 11 (3.7%) |
Disability Class: Cognitive Difficulty
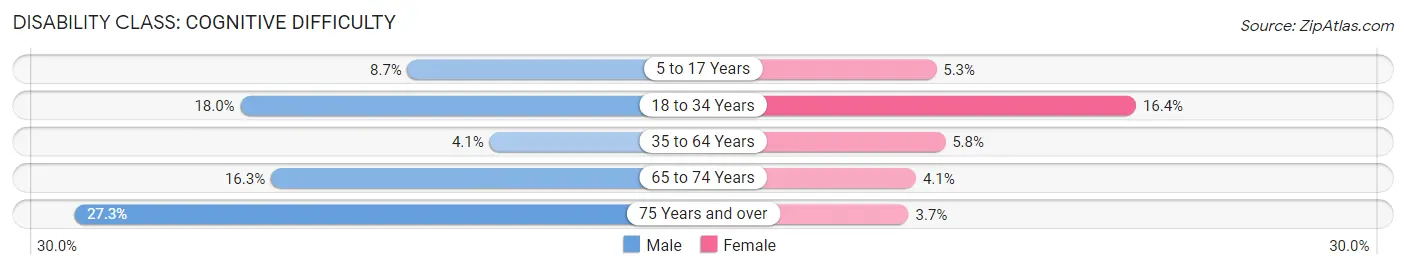
| Age Bracket | Male | Female |
| 5 to 17 Years | 39 (8.7%) | 16 (5.3%) |
| 18 to 34 Years | 151 (18.0%) | 172 (16.4%) |
| 35 to 64 Years | 70 (4.1%) | 88 (5.8%) |
| 65 to 74 Years | 70 (16.3%) | 24 (4.1%) |
| 75 Years and over | 109 (27.3%) | 11 (3.7%) |
Disability Class: Ambulatory Difficulty
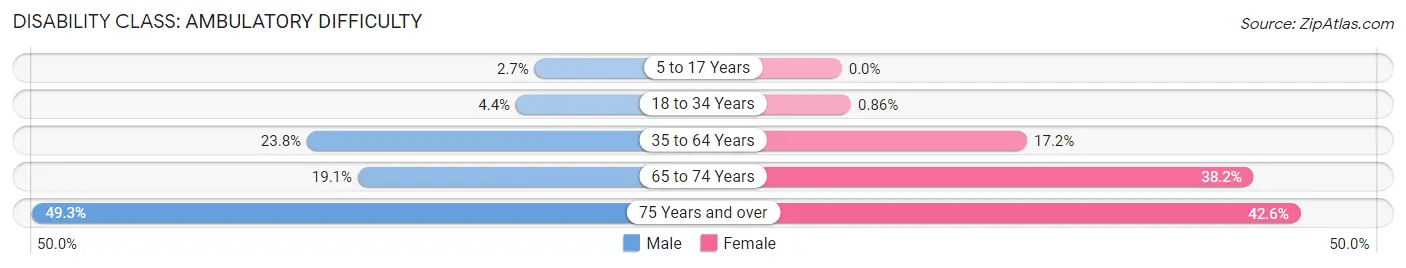
| Age Bracket | Male | Female |
| 5 to 17 Years | 12 (2.7%) | 0 (0.0%) |
| 18 to 34 Years | 37 (4.4%) | 9 (0.9%) |
| 35 to 64 Years | 405 (23.8%) | 263 (17.2%) |
| 65 to 74 Years | 82 (19.1%) | 222 (38.2%) |
| 75 Years and over | 197 (49.2%) | 126 (42.6%) |
Disability Class: Self-Care Difficulty
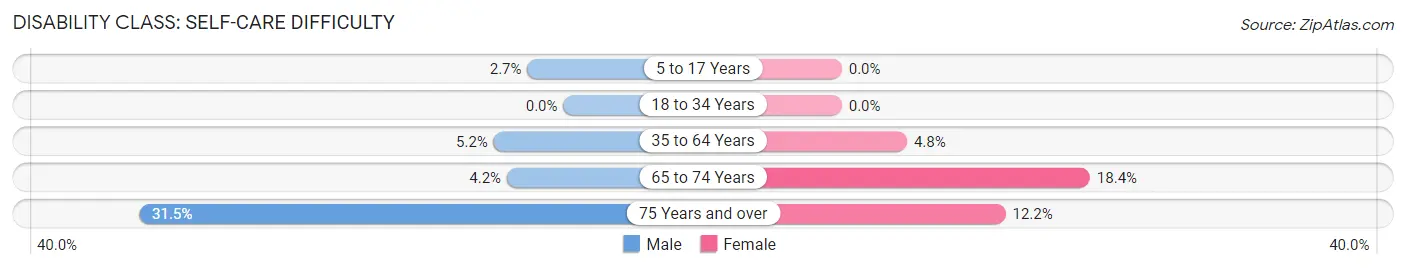
| Age Bracket | Male | Female |
| 5 to 17 Years | 12 (2.7%) | 0 (0.0%) |
| 18 to 34 Years | 0 (0.0%) | 0 (0.0%) |
| 35 to 64 Years | 88 (5.2%) | 74 (4.8%) |
| 65 to 74 Years | 18 (4.2%) | 107 (18.4%) |
| 75 Years and over | 126 (31.5%) | 36 (12.2%) |
Technology Access in Springfield
Computing Device Access in Springfield
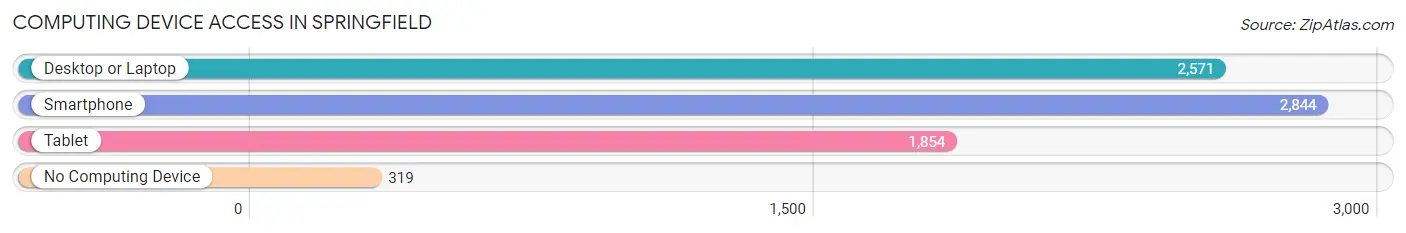
| Device Type | # Households | % Households |
| Desktop or Laptop | 2,571 | 73.7% |
| Smartphone | 2,844 | 81.5% |
| Tablet | 1,854 | 53.1% |
| No Computing Device | 319 | 9.1% |
| Total | 3,490 | 100.0% |
Internet Access in Springfield
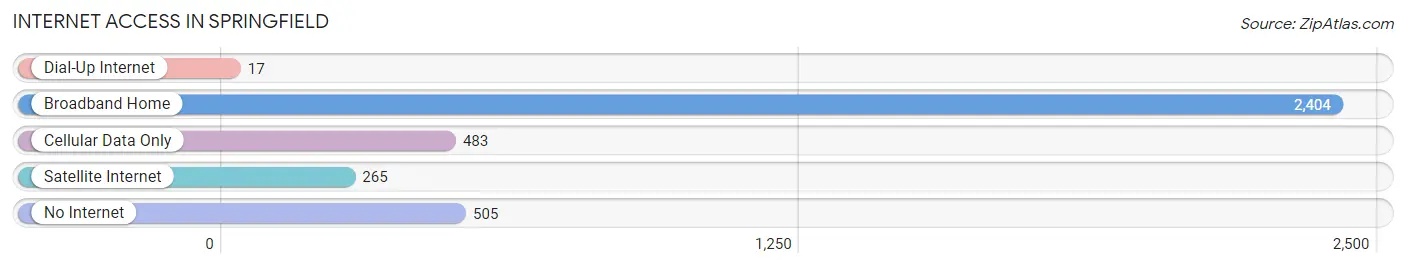
| Internet Type | # Households | % Households |
| Dial-Up Internet | 17 | 0.5% |
| Broadband Home | 2,404 | 68.9% |
| Cellular Data Only | 483 | 13.8% |
| Satellite Internet | 265 | 7.6% |
| No Internet | 505 | 14.5% |
| Total | 3,490 | 100.0% |
Springfield Summary
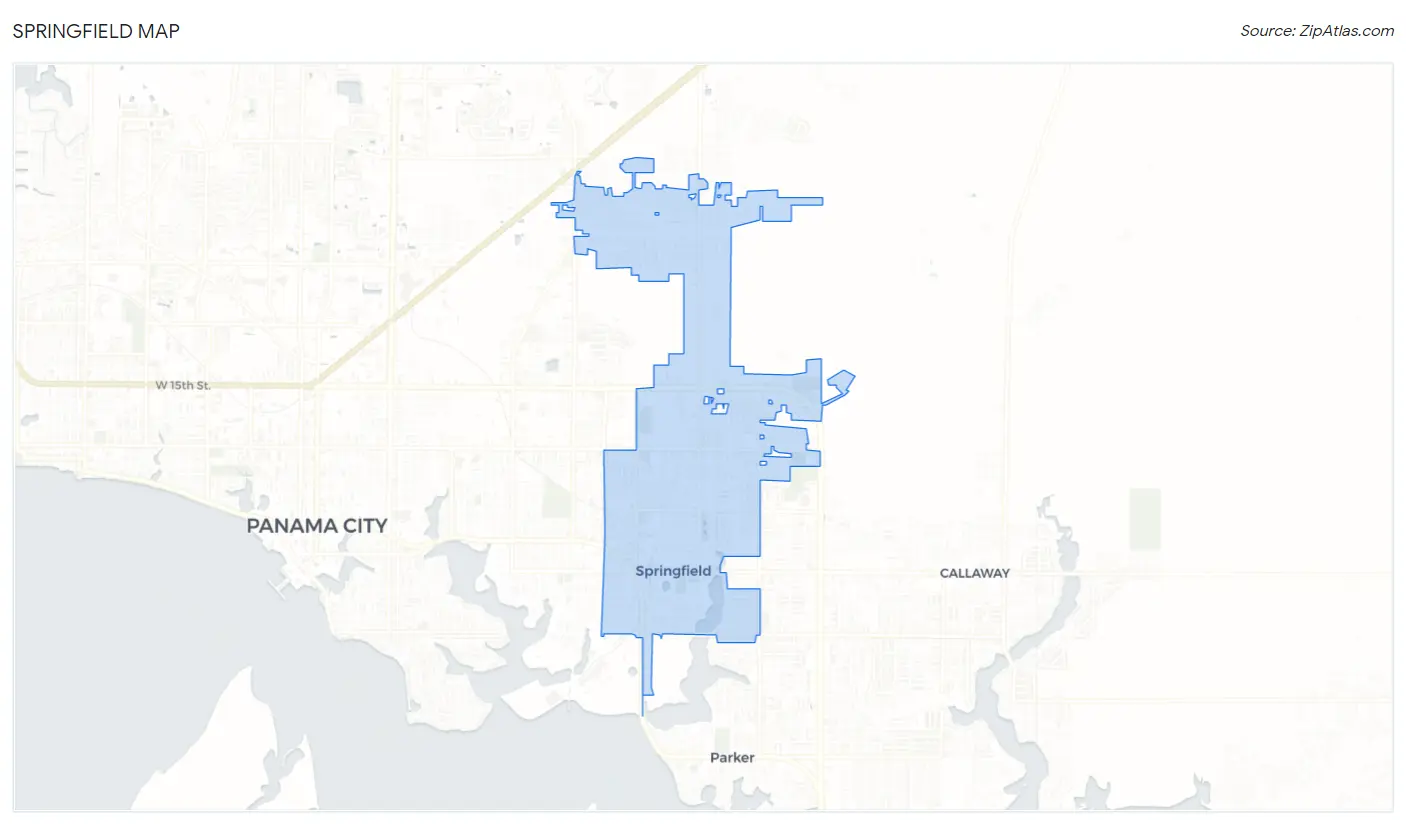
Springfield is a small town located in Bay County, Florida. It is situated on the north side of the bay, just east of Panama City. The town has a population of approximately 1,500 people and is part of the Panama City-Lynn Haven-Panama City Beach Metropolitan Statistical Area.
History
The area that is now Springfield was first settled in the late 1800s by a group of settlers from Georgia. The town was originally known as “Springfield Station” and was a stop on the railroad line that ran from Pensacola to Panama City. The town was officially incorporated in 1909 and was named after the nearby spring.
In the early 1900s, Springfield was a thriving agricultural community. The town was known for its production of cotton, corn, and peanuts. The town also had a thriving lumber industry, with several sawmills located in the area.
In the 1950s, Springfield began to experience a decline in population as many of the town’s residents moved away to larger cities. The town’s economy shifted to tourism and the service industry. In the late 1990s, the town experienced a resurgence in population as people moved back to the area to take advantage of the area’s natural beauty and proximity to the beach.
Geography
Springfield is located in Bay County, Florida. The town is situated on the north side of the bay, just east of Panama City. The town is bordered by the towns of Callaway to the north, Lynn Haven to the east, and Panama City Beach to the south.
The town is located on the banks of the North Bay, which is part of the larger St. Andrew Bay. The town is located in a flat, coastal plain and is surrounded by pine forests and wetlands. The town is located approximately 10 miles from the Gulf of Mexico.
Economy
The economy of Springfield is largely based on tourism and the service industry. The town is home to several hotels and resorts, as well as restaurants and other tourist attractions. The town is also home to several marinas, which provide access to the bay for fishing and other recreational activities.
The town is also home to several manufacturing and industrial businesses. These businesses include a paper mill, a lumber mill, and a seafood processing plant.
Demographics
As of the 2010 census, the population of Springfield was 1,500. The town is predominantly white, with approximately 75% of the population identifying as white. The town also has a small African American population, with approximately 10% of the population identifying as African American. The town also has a small Hispanic population, with approximately 5% of the population identifying as Hispanic.
The median household income in Springfield is approximately $35,000. The town has a poverty rate of approximately 15%, which is slightly higher than the national average. The town also has a high rate of unemployment, with approximately 10% of the population unemployed.
Common Questions
What is Per Capita Income in Springfield?
Per Capita income in Springfield is $25,345.
What is the Median Family Income in Springfield?
Median Family Income in Springfield is $60,376.
What is the Median Household income in Springfield?
Median Household Income in Springfield is $52,188.
What is Income or Wage Gap in Springfield?
Income or Wage Gap in Springfield is 32.6%.
Women in Springfield earn 67.4 cents for every dollar earned by a man.
What is Family Income Deficit in Springfield?
Family Income Deficit in Springfield is $15,285.
Families that are below poverty line in Springfield earn $15,285 less on average than the poverty threshold level.
What is Inequality or Gini Index in Springfield?
Inequality or Gini Index in Springfield is 0.35.
What is the Total Population of Springfield?
Total Population of Springfield is 8,295.
What is the Total Male Population of Springfield?
Total Male Population of Springfield is 4,314.
What is the Total Female Population of Springfield?
Total Female Population of Springfield is 3,981.
What is the Ratio of Males per 100 Females in Springfield?
There are 108.36 Males per 100 Females in Springfield.
What is the Ratio of Females per 100 Males in Springfield?
There are 92.28 Females per 100 Males in Springfield.
What is the Median Population Age in Springfield?
Median Population Age in Springfield is 42.2 Years.
What is the Average Family Size in Springfield
Average Family Size in Springfield is 3.0 People.
What is the Average Household Size in Springfield
Average Household Size in Springfield is 2.3 People.
How Large is the Labor Force in Springfield?
There are 4,014 People in the Labor Forcein in Springfield.
What is the Percentage of People in the Labor Force in Springfield?
56.2% of People are in the Labor Force in Springfield.
What is the Unemployment Rate in Springfield?
Unemployment Rate in Springfield is 1.2%.