Taiwanese Disability Age 18 to 34

COMPARE

Taiwanese
Race
Ancestry
AfghanAfricanAlaska NativeAlaskan AthabascanAlbanianAleutAlsatianAmericanApacheArabArapahoArgentineanArmenianAssyrian/Chaldean/SyriacAustralianAustrianBahamianBangladeshiBarbadianBasqueBelgianBelizeanBermudanBhutaneseBlackfeetBolivianBrazilianBritishBritish West IndianBulgarianBurmeseCajunCambodianCanadianCape VerdeanCarpatho RusynCelticCentral AmericanCentral American IndianCherokeeCheyenneChickasawChileanChineseChippewaChoctawColombianColvilleComancheCosta RicanCreeCreekCroatianCrowCubanCypriotCzechCzechoslovakianDanishDelawareDominicanDutchDutch West IndianEastern EuropeanEcuadorianEgyptianEnglishEstonianEthiopianEuropeanFijianFilipinoFinnishFrenchFrench American IndianFrench CanadianGermanGerman RussianGhanaianGreekGuamanian/ChamorroGuatemalanGuyaneseHaitianHmongHonduranHopiHoumaHungarianIcelanderIndian (Asian)IndonesianInupiatIranianIraqiIrishIroquoisIsraeliItalianJamaicanJapaneseJordanianKenyanKiowaKoreanLaotianLatvianLebaneseLiberianLithuanianLumbeeLuxembourgerMacedonianMalaysianMalteseMarshalleseMenomineeMexicanMexican American IndianMongolianMoroccanNative HawaiianNavajoNepaleseNew ZealanderNicaraguanNigerianNorthern EuropeanNorwegianOkinawanOsageOttawaPaiutePakistaniPalestinianPanamanianParaguayanPennsylvania GermanPeruvianPimaPolishPortuguesePotawatomiPuebloPuerto RicanPuget Sound SalishRomanianRussianSalvadoranSamoanScandinavianScotch-IrishScottishSeminoleSenegaleseSerbianShoshoneSierra LeoneanSiouxSlavicSlovakSloveneSomaliSouth AfricanSouth AmericanSouth American IndianSoviet UnionSpaniardSpanishSpanish AmericanSpanish American IndianSri LankanSubsaharan AfricanSudaneseSwedishSwissSyrianTaiwaneseThaiTlingit-HaidaTohono O'OdhamTonganTrinidadian and TobagonianTsimshianTurkishU.S. Virgin IslanderUgandanUkrainianUruguayanUteVenezuelanVietnameseWelshWest IndianYakamaYaquiYugoslavianYumanYup'ikZimbabwean
Immigration
NonimmigrantsImmigrantsAfghanistanAfricaAlbaniaArgentinaArmeniaAsiaAustraliaAustriaBahamasBangladeshBarbadosBelarusBelgiumBelizeBoliviaBosnia and HerzegovinaBrazilBulgariaBurma/MyanmarCabo VerdeCambodiaCameroonCanadaCaribbeanCentral AmericaChileChinaColombiaCongoCosta RicaCroatiaCubaCzechoslovakiaDenmarkDominicaDominican RepublicEastern AfricaEastern AsiaEastern EuropeEcuadorEgyptEl SalvadorEnglandEritreaEthiopiaEuropeFijiFranceGermanyGhanaGreeceGrenadaGuatemalaGuyanaHaitiHondurasHong KongHungaryIndiaIndonesiaIranIraqIrelandIsraelItalyJamaicaJapanJordanKazakhstanKenyaKoreaKuwaitLaosLatin AmericaLatviaLebanonLiberiaLithuaniaMalaysiaMexicoMicronesiaMiddle AfricaMoldovaMoroccoNepalNetherlandsNicaraguaNigeriaNorth AmericaNorth MacedoniaNorthern AfricaNorthern EuropeNorwayOceaniaPakistanPanamaPeruPhilippinesPolandPortugalRomaniaRussiaSaudi ArabiaScotlandSenegalSerbiaSierra LeoneSingaporeSomaliaSouth AfricaSouth AmericaSouth Central AsiaSouth Eastern AsiaSouthern EuropeSpainSri LankaSt. Vincent and the GrenadinesSudanSwedenSwitzerlandSyriaTaiwanThailandTrinidad and TobagoTurkeyUgandaUkraineUruguayUzbekistanVenezuelaVietnamWest IndiesWestern AfricaWestern AsiaWestern EuropeYemenZaireZimbabweAzores
Select to Compare
Race
Ancestry
AfghanAfricanAlaska NativeAlaskan AthabascanAlbanianAleutAlsatianAmericanApacheArabArapahoArgentineanArmenianAssyrian/Chaldean/SyriacAustralianAustrianBahamianBangladeshiBarbadianBasqueBelgianBelizeanBermudanBhutaneseBlackfeetBolivianBrazilianBritishBritish West IndianBulgarianBurmeseCajunCambodianCanadianCape VerdeanCarpatho RusynCelticCentral AmericanCentral American IndianCherokeeCheyenneChickasawChileanChineseChippewaChoctawColombianColvilleComancheCosta RicanCreeCreekCroatianCrowCubanCypriotCzechCzechoslovakianDanishDelawareDominicanDutchDutch West IndianEastern EuropeanEcuadorianEgyptianEnglishEstonianEthiopianEuropeanFijianFilipinoFinnishFrenchFrench American IndianFrench CanadianGermanGerman RussianGhanaianGreekGuamanian/ChamorroGuatemalanGuyaneseHaitianHmongHonduranHopiHoumaHungarianIcelanderIndian (Asian)IndonesianInupiatIranianIraqiIrishIroquoisIsraeliItalianJamaicanJapaneseJordanianKenyanKiowaKoreanLaotianLatvianLebaneseLiberianLithuanianLumbeeLuxembourgerMacedonianMalaysianMalteseMarshalleseMenomineeMexicanMexican American IndianMongolianMoroccanNative HawaiianNavajoNepaleseNew ZealanderNicaraguanNigerianNorthern EuropeanNorwegianOkinawanOsageOttawaPaiutePakistaniPalestinianPanamanianParaguayanPennsylvania GermanPeruvianPimaPolishPortuguesePotawatomiPuebloPuerto RicanPuget Sound SalishRomanianRussianSalvadoranSamoanScandinavianScotch-IrishScottishSeminoleSenegaleseSerbianShoshoneSierra LeoneanSiouxSlavicSlovakSloveneSomaliSouth AfricanSouth AmericanSouth American IndianSoviet UnionSpaniardSpanishSpanish AmericanSpanish American IndianSri LankanSubsaharan AfricanSudaneseSwedishSwissSyrianThaiTlingit-HaidaTohono O'OdhamTonganTrinidadian and TobagonianTsimshianTurkishU.S. Virgin IslanderUgandanUkrainianUruguayanUteVenezuelanVietnameseWelshWest IndianYakamaYaquiYugoslavianYumanYup'ikZimbabwean
Immigration
NonimmigrantsImmigrantsAfghanistanAfricaAlbaniaArgentinaArmeniaAsiaAustraliaAustriaBahamasBangladeshBarbadosBelarusBelgiumBelizeBoliviaBosnia and HerzegovinaBrazilBulgariaBurma/MyanmarCabo VerdeCambodiaCameroonCanadaCaribbeanCentral AmericaChileChinaColombiaCongoCosta RicaCroatiaCubaCzechoslovakiaDenmarkDominicaDominican RepublicEastern AfricaEastern AsiaEastern EuropeEcuadorEgyptEl SalvadorEnglandEritreaEthiopiaEuropeFijiFranceGermanyGhanaGreeceGrenadaGuatemalaGuyanaHaitiHondurasHong KongHungaryIndiaIndonesiaIranIraqIrelandIsraelItalyJamaicaJapanJordanKazakhstanKenyaKoreaKuwaitLaosLatin AmericaLatviaLebanonLiberiaLithuaniaMalaysiaMexicoMicronesiaMiddle AfricaMoldovaMoroccoNepalNetherlandsNicaraguaNigeriaNorth AmericaNorth MacedoniaNorthern AfricaNorthern EuropeNorwayOceaniaPakistanPanamaPeruPhilippinesPolandPortugalRomaniaRussiaSaudi ArabiaScotlandSenegalSerbiaSierra LeoneSingaporeSomaliaSouth AfricaSouth AmericaSouth Central AsiaSouth Eastern AsiaSouthern EuropeSpainSri LankaSt. Vincent and the GrenadinesSudanSwedenSwitzerlandSyriaTaiwanThailandTrinidad and TobagoTurkeyUgandaUkraineUruguayUzbekistanVenezuelaVietnamWest IndiesWestern AfricaWestern AsiaWestern EuropeYemenZaireZimbabweAzores
Disability Age 18 to 34
Income
Poverty
Unemployment
Labor Participation
Family Structure
Vehicle Availability
Education Level
Disability

Taiwanese Disability Age 18 to 34
Exceptional

6.0%
DISABILITY | AGE 18 TO 34
99.6/ 100
METRIC RATING
64th/ 347
METRIC RANK

Taiwanese Disability Age 18 to 34 Correlation Chart

The statistical analysis conducted on geographies consisting of 31,720,747 people shows a significant positive correlation between the proportion of Taiwanese and percentage of population with a disability between the ages 18 and 35 in the United States with a correlation coefficient (R) of 0.606 and weighted average of 6.0%. On average, for every 1% (one percent) increase in Taiwanese within a typical geography, there is an increase of 6.7% in percentage of population with a disability between the ages 18 and 35.
Taiwanese Disability Age 18 to 34
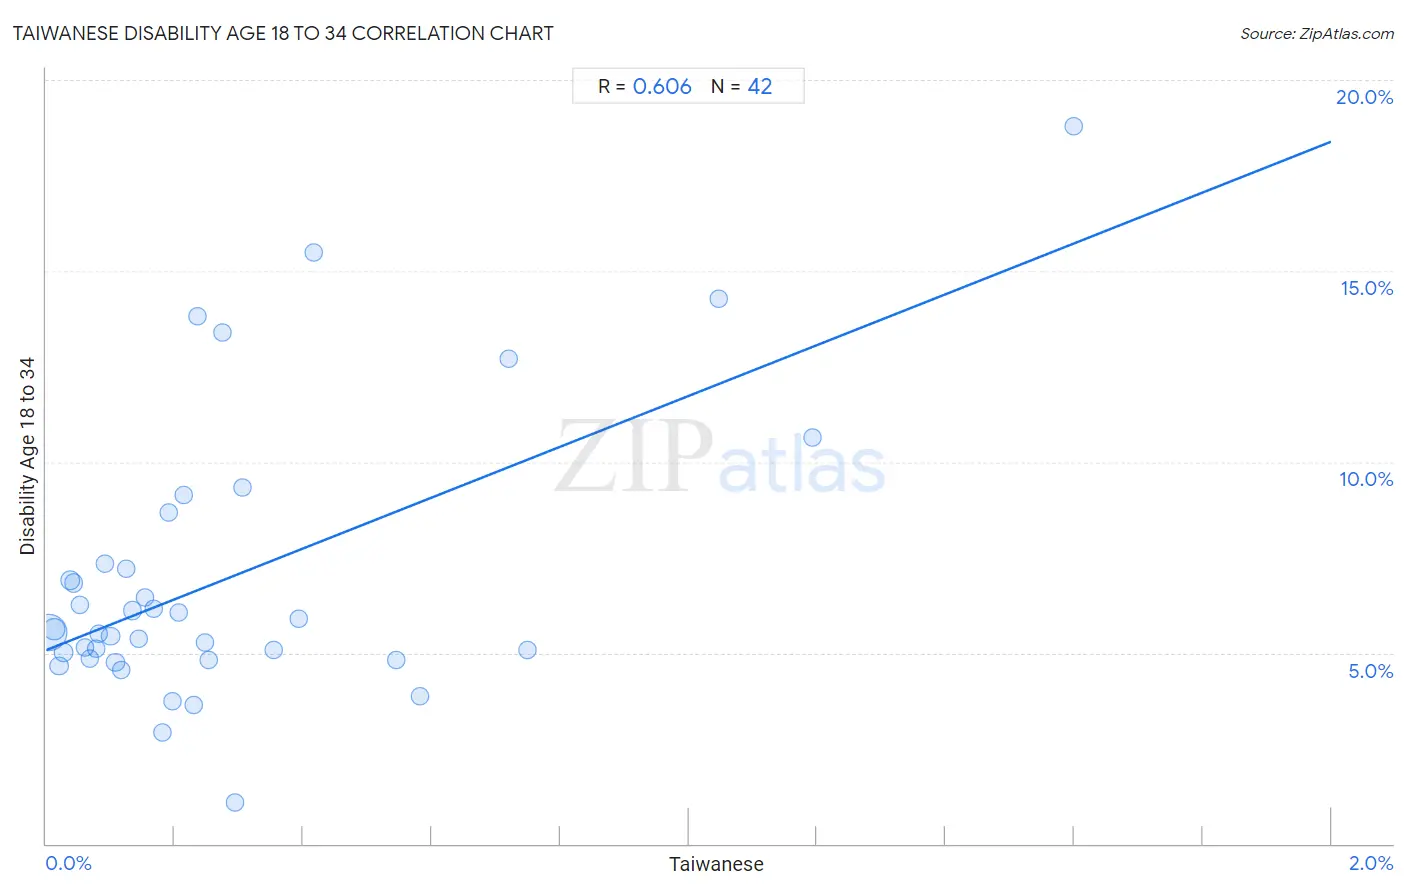
It is essential to understand that the correlation between the percentage of Taiwanese and percentage of population with a disability between the ages 18 and 35 does not imply a direct cause-and-effect relationship. It remains uncertain whether the presence of Taiwanese influences an upward or downward trend in the level of percentage of population with a disability between the ages 18 and 35 within an area, or if Taiwanese simply ended up residing in those areas with higher or lower levels of percentage of population with a disability between the ages 18 and 35 due to other factors.

Demographics Similar to Taiwanese by Disability Age 18 to 34

In terms of disability age 18 to 34, the demographic groups most similar to Taiwanese are Salvadoran (6.0%, a difference of 0.010%), Peruvian (6.0%, a difference of 0.070%), British West Indian (6.0%, a difference of 0.090%), Trinidadian and Tobagonian (6.0%, a difference of 0.14%), and Burmese (6.0%, a difference of 0.28%).
DemographicsRating | RankDisability Age 18 to 34
Immigrants from Haiti
99.7
/100
|
#57
Exceptional
5.9%
Immigrants from Serbia
99.7
/100
|
#58
Exceptional
5.9%
Immigrants from Caribbean
99.6
/100
|
#59
Exceptional
6.0%
Immigrants from Sri Lanka
99.6
/100
|
#60
Exceptional
6.0%
British West Indians
99.6
/100
|
#61
Exceptional
6.0%
Peruvians
99.6
/100
|
#62
Exceptional
6.0%
Salvadorans
99.6
/100
|
#63
Exceptional
6.0%
Taiwanese
99.6
/100
|
#64
Exceptional
6.0%
Trinidadians and Tobagonians
99.5
/100
|
#65
Exceptional
6.0%
Burmese
99.5
/100
|
#66
Exceptional
6.0%
Immigrants from North Macedonia
99.5
/100
|
#67
Exceptional
6.0%
Immigrants from Poland
99.5
/100
|
#68
Exceptional
6.0%
Immigrants from West Indies
99.4
/100
|
#69
Exceptional
6.0%
Immigrants from Greece
99.4
/100
|
#70
Exceptional
6.0%
Immigrants from Japan
99.3
/100
|
#71
Exceptional
6.0%

Taiwanese Disability Age 18 to 34 Correlation Summary

MeasurementTaiwanese DataDisability Age 18 to 34 Data
Minimum0.0036%1.1%
Maximum1.6%18.8%
Range1.6%17.7%
Mean0.29%7.0%
Median0.19%5.6%
Interquartile 25% (IQ1)0.082%4.8%
Interquartile 75% (IQ3)0.31%7.3%
Interquartile Range (IQR)0.22%2.5%
Standard Deviation (Sample)0.34%3.7%
Standard Deviation (Population)0.33%3.7%

Correlation Details

Taiwanese PercentileSample SizeDisability Age 18 to 34
[
0.0%
-
0.5%
]
0.0036%
22,155,7835.5%
[
0.0%
-
0.5%
]
0.012%
3,425,7565.6%
[
0.0%
-
0.5%
]
0.020%
720,5194.7%
[
0.0%
-
0.5%
]
0.027%
1,852,2075.0%
[
0.0%
-
0.5%
]
0.037%
874,9996.9%
[
0.0%
-
0.5%
]
0.043%
240,2646.8%
[
0.0%
-
0.5%
]
0.052%
257,6106.3%
[
0.0%
-
0.5%
]
0.060%
80,6435.1%
[
0.0%
-
0.5%
]
0.068%
303,3514.8%
[
0.0%
-
0.5%
]
0.077%
135,5505.1%
[
0.0%
-
0.5%
]
0.082%
93,6885.5%
[
0.0%
-
0.5%
]
0.091%
204,0487.3%
[
0.0%
-
0.5%
]
0.10%
93,9175.4%
[
0.0%
-
0.5%
]
0.11%
335,5104.8%
[
0.0%
-
0.5%
]
0.12%
66,6584.6%
[
0.0%
-
0.5%
]
0.12%
37,0477.2%
[
0.0%
-
0.5%
]
0.13%
85,5256.1%
[
0.0%
-
0.5%
]
0.14%
47,5495.4%
[
0.0%
-
0.5%
]
0.15%
33,8906.5%
[
0.0%
-
0.5%
]
0.17%
33,2976.1%
[
0.0%
-
0.5%
]
0.18%
77,8682.9%
[
0.0%
-
0.5%
]
0.19%
63,4228.7%
[
0.0%
-
0.5%
]
0.20%
36,8063.7%
[
0.0%
-
0.5%
]
0.21%
61,7576.1%
[
0.0%
-
0.5%
]
0.21%
17,8089.1%
[
0.0%
-
0.5%
]
0.23%
42,1163.6%
[
0.0%
-
0.5%
]
0.23%
21,71213.8%
[
0.0%
-
0.5%
]
0.25%
40,0645.3%
[
0.0%
-
0.5%
]
0.25%
30,5094.8%
[
0.0%
-
0.5%
]
0.28%
18,53613.4%
[
0.0%
-
0.5%
]
0.29%
7,4711.1%
[
0.0%
-
0.5%
]
0.31%
6549.3%
[
0.0%
-
0.5%
]
0.35%
83,4015.1%
[
0.0%
-
0.5%
]
0.39%
7,6265.9%
[
0.0%
-
0.5%
]
0.42%
32,66515.5%
[
0.5%
-
1.0%
]
0.54%
1,4714.8%
[
0.5%
-
1.0%
]
0.58%
23,6893.9%
[
0.5%
-
1.0%
]
0.72%
27812.7%
[
0.5%
-
1.0%
]
0.75%
66,2495.1%
[
1.0%
-
1.5%
]
1.05%
3,81914.3%
[
1.0%
-
1.5%
]
1.19%
2,51510.6%
[
1.5%
-
2.0%
]
1.60%
2,50018.8%