Zip Codes with the Highest Percentage of Households Without a Vehicle in Denver, CO
RELATED REPORTS & OPTIONS
Households without a Cars
Denver
Compare Zip Codes
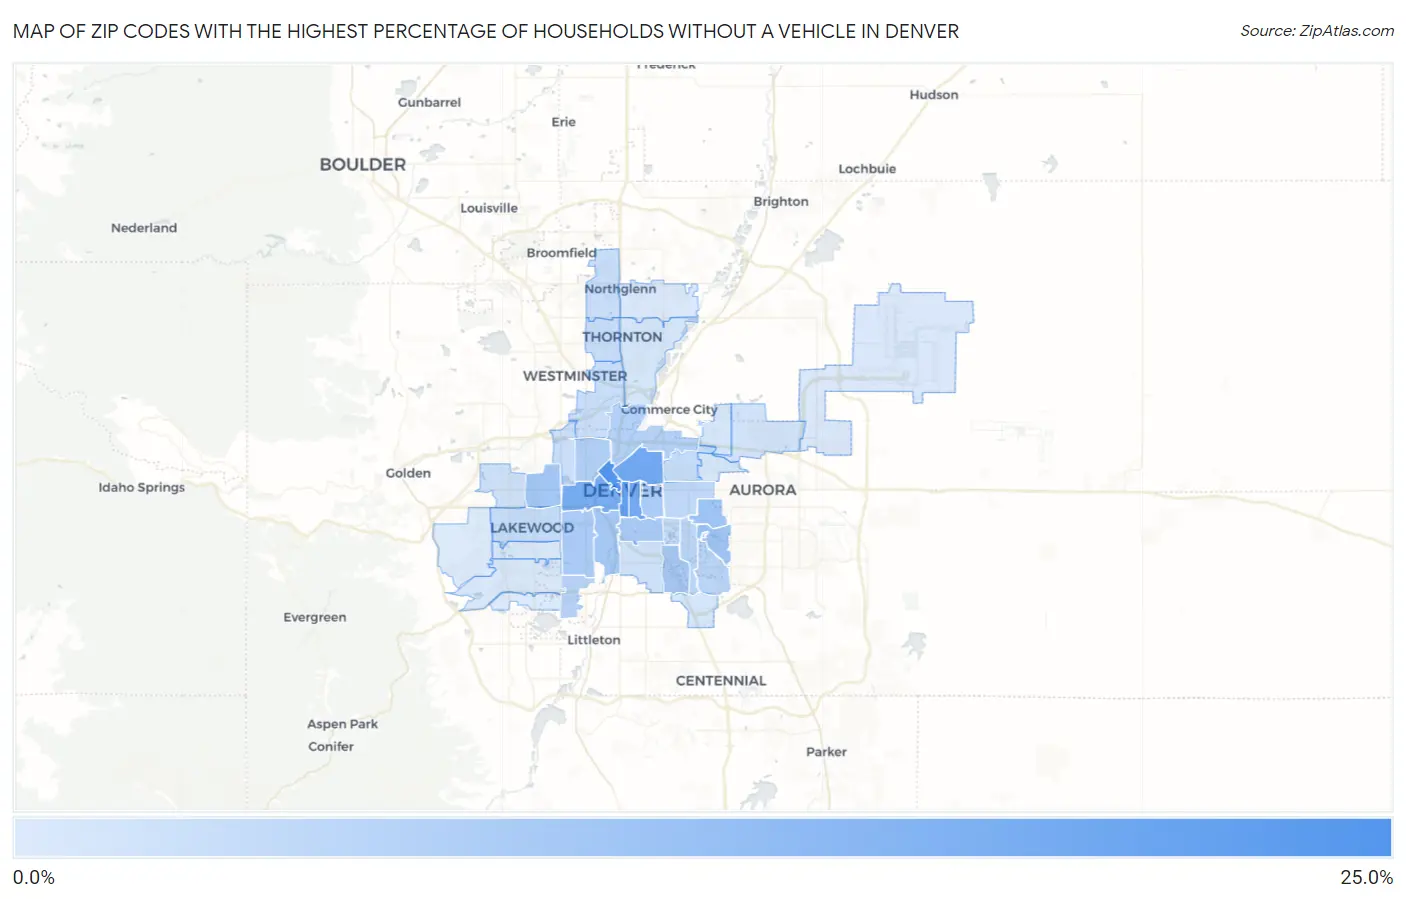
Map of Zip Codes with the Highest Percentage of Households Without a Vehicle in Denver
3.2%
24.0%
Zip Codes with the Highest Percentage of Households Without a Vehicle in Denver, CO
| Zip Code | Housholds Without a Car | vs State | vs National | |
| 1. | 80290 | 24.0% | 5.0%(+19.0)#3 | 8.3%(+15.7)#1,143 |
| 2. | 80202 | 22.3% | 5.0%(+17.3)#4 | 8.3%(+14.0)#1,274 |
| 3. | 80203 | 20.3% | 5.0%(+15.3)#5 | 8.3%(+12.0)#1,464 |
| 4. | 80205 | 18.0% | 5.0%(+13.0)#6 | 8.3%(+9.70)#1,774 |
| 5. | 80218 | 17.6% | 5.0%(+12.6)#7 | 8.3%(+9.30)#1,847 |
| 6. | 80204 | 17.0% | 5.0%(+12.0)#8 | 8.3%(+8.70)#1,955 |
| 7. | 80230 | 11.3% | 5.0%(+6.30)#23 | 8.3%(+3.00)#3,956 |
| 8. | 80247 | 11.2% | 5.0%(+6.20)#24 | 8.3%(+2.90)#4,017 |
| 9. | 80214 | 10.7% | 5.0%(+5.70)#27 | 8.3%(+2.40)#4,311 |
| 10. | 80222 | 10.3% | 5.0%(+5.30)#30 | 8.3%(+2.00)#4,632 |
| 11. | 80223 | 10.3% | 5.0%(+5.30)#32 | 8.3%(+2.00)#4,638 |
| 12. | 80219 | 9.9% | 5.0%(+4.90)#36 | 8.3%(+1.60)#4,924 |
| 13. | 80206 | 9.9% | 5.0%(+4.90)#38 | 8.3%(+1.60)#4,940 |
| 14. | 80209 | 9.7% | 5.0%(+4.70)#40 | 8.3%(+1.40)#5,107 |
| 15. | 80211 | 8.8% | 5.0%(+3.80)#46 | 8.3%(+0.500)#5,951 |
| 16. | 80216 | 8.5% | 5.0%(+3.50)#50 | 8.3%(+0.200)#6,334 |
| 17. | 80236 | 8.0% | 5.0%(+3.00)#56 | 8.3%(-0.300)#6,940 |
| 18. | 80224 | 7.8% | 5.0%(+2.80)#63 | 8.3%(-0.500)#7,249 |
| 19. | 80231 | 7.6% | 5.0%(+2.60)#67 | 8.3%(-0.700)#7,544 |
| 20. | 80220 | 7.0% | 5.0%(+2.00)#78 | 8.3%(-1.30)#8,532 |
| 21. | 80246 | 6.9% | 5.0%(+1.90)#82 | 8.3%(-1.40)#8,743 |
| 22. | 80226 | 6.3% | 5.0%(+1.30)#90 | 8.3%(-2.00)#9,786 |
| 23. | 80207 | 6.1% | 5.0%(+1.10)#97 | 8.3%(-2.20)#10,227 |
| 24. | 80221 | 5.8% | 5.0%(+0.800)#110 | 8.3%(-2.50)#10,886 |
| 25. | 80260 | 5.8% | 5.0%(+0.800)#111 | 8.3%(-2.50)#10,895 |
| 26. | 80234 | 5.8% | 5.0%(+0.800)#112 | 8.3%(-2.50)#10,902 |
| 27. | 80212 | 5.5% | 5.0%(+0.500)#124 | 8.3%(-2.80)#11,649 |
| 28. | 80215 | 5.1% | 5.0%(+0.100)#131 | 8.3%(-3.20)#12,643 |
| 29. | 80210 | 4.9% | 5.0%(-0.100)#133 | 8.3%(-3.40)#13,086 |
| 30. | 80239 | 4.6% | 5.0%(-0.400)#143 | 8.3%(-3.70)#13,895 |
| 31. | 80229 | 4.1% | 5.0%(-0.900)#158 | 8.3%(-4.20)#15,347 |
| 32. | 80238 | 4.1% | 5.0%(-0.900)#159 | 8.3%(-4.20)#15,397 |
| 33. | 80237 | 4.0% | 5.0%(-1.00)#168 | 8.3%(-4.30)#15,735 |
| 34. | 80227 | 3.9% | 5.0%(-1.10)#173 | 8.3%(-4.40)#16,001 |
| 35. | 80232 | 3.7% | 5.0%(-1.30)#179 | 8.3%(-4.60)#16,693 |
| 36. | 80249 | 3.6% | 5.0%(-1.40)#184 | 8.3%(-4.70)#16,981 |
| 37. | 80233 | 3.4% | 5.0%(-1.60)#195 | 8.3%(-4.90)#17,610 |
| 38. | 80228 | 3.3% | 5.0%(-1.70)#203 | 8.3%(-5.00)#17,992 |
| 39. | 80235 | 3.2% | 5.0%(-1.80)#211 | 8.3%(-5.10)#18,424 |
1
Common Questions
What are the Top 10 Zip Codes with the Highest Percentage of Households Without a Vehicle in Denver, CO?
Top 10 Zip Codes with the Highest Percentage of Households Without a Vehicle in Denver, CO are:
What zip code has the Highest Percentage of Households Without a Vehicle in Denver, CO?
80290 has the Highest Percentage of Households Without a Vehicle in Denver, CO with 24.0%.
What is the Percentage of Households Without a Vehicle in Denver, CO?
Percentage of Households Without a Vehicle in Denver is 9.9%.
What is the Percentage of Households Without a Vehicle in Colorado?
Percentage of Households Without a Vehicle in Colorado is 5.0%.
What is the Percentage of Households Without a Vehicle in the United States?
Percentage of Households Without a Vehicle in the United States is 8.3%.