Zip Codes with the Highest Percentage of Black / African American Population in Denver, CO
RELATED REPORTS & OPTIONS
Black / African American
Denver
Compare Zip Codes
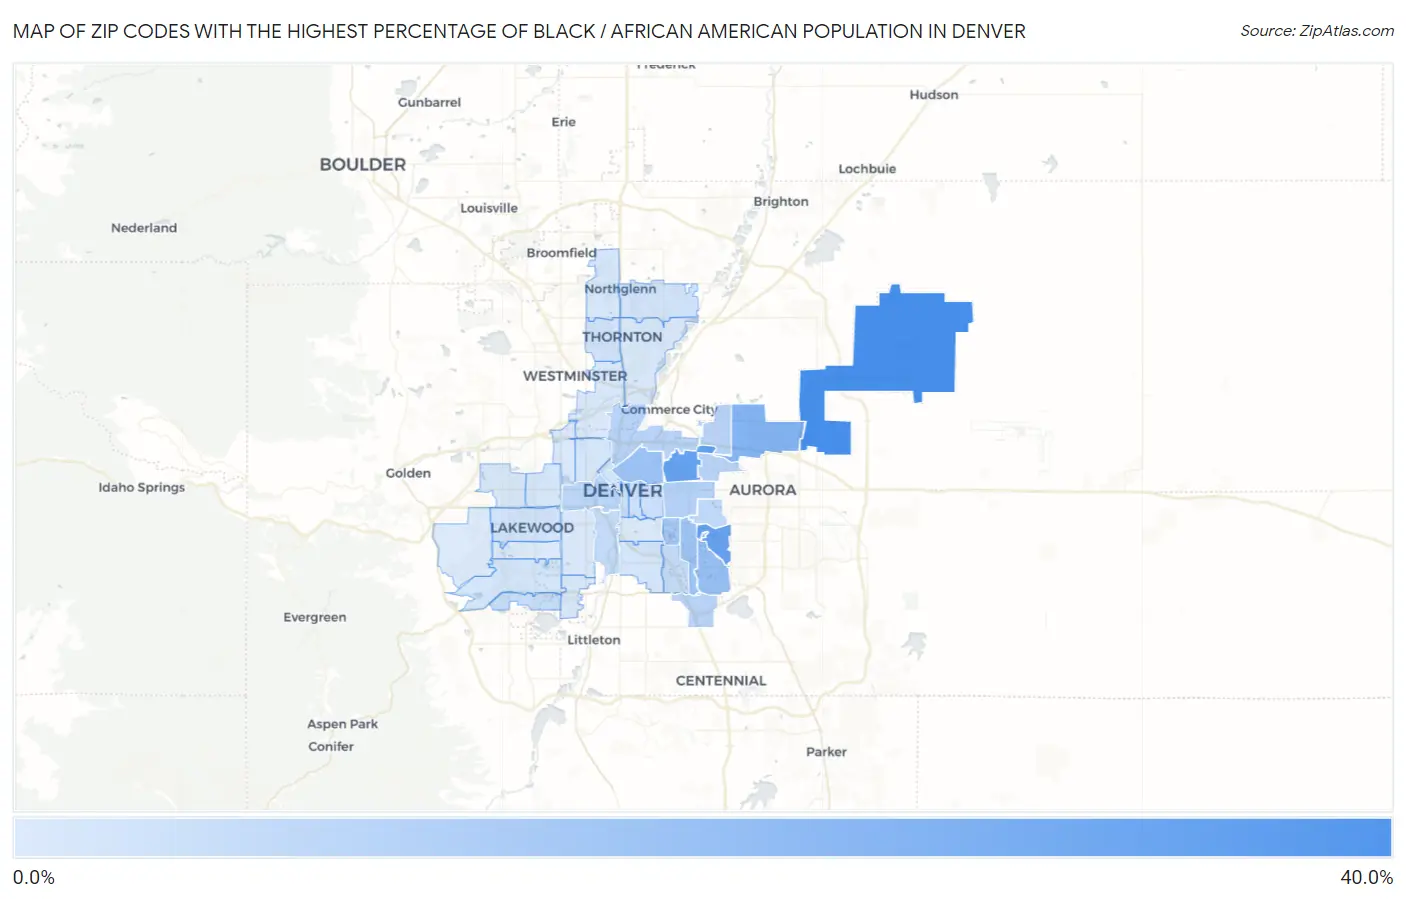
Map of Zip Codes with the Highest Percentage of Black / African American Population in Denver
0.65%
32.3%
Zip Codes with the Highest Percentage of Black / African American Population in Denver, CO
| Zip Code | Black / African American | vs State | vs National | |
| 1. | 80249 | 32.3% | 4.0%(+28.3)#2 | 12.5%(+19.8)#2,447 |
| 2. | 80207 | 25.5% | 4.0%(+21.4)#4 | 12.5%(+13.0)#3,160 |
| 3. | 80247 | 24.6% | 4.0%(+20.6)#5 | 12.5%(+12.2)#3,257 |
| 4. | 80239 | 18.8% | 4.0%(+14.7)#8 | 12.5%(+6.29)#4,167 |
| 5. | 80231 | 14.0% | 4.0%(+9.99)#16 | 12.5%(+1.57)#5,226 |
| 6. | 80205 | 13.6% | 4.0%(+9.51)#18 | 12.5%(+1.09)#5,358 |
| 7. | 80224 | 13.0% | 4.0%(+8.90)#20 | 12.5%(+0.483)#5,553 |
| 8. | 80246 | 11.4% | 4.0%(+7.36)#25 | 12.5%(-1.06)#6,098 |
| 9. | 80220 | 8.5% | 4.0%(+4.49)#28 | 12.5%(-3.93)#7,266 |
| 10. | 80237 | 7.8% | 4.0%(+3.72)#33 | 12.5%(-4.70)#7,657 |
| 11. | 80216 | 7.7% | 4.0%(+3.65)#34 | 12.5%(-4.77)#7,694 |
| 12. | 80238 | 7.6% | 4.0%(+3.55)#35 | 12.5%(-4.87)#7,754 |
| 13. | 80204 | 7.2% | 4.0%(+3.11)#37 | 12.5%(-5.31)#8,010 |
| 14. | 80230 | 6.3% | 4.0%(+2.23)#43 | 12.5%(-6.19)#8,569 |
| 15. | 80223 | 5.4% | 4.0%(+1.35)#47 | 12.5%(-7.07)#9,222 |
| 16. | 80222 | 5.1% | 4.0%(+1.02)#54 | 12.5%(-7.40)#9,498 |
| 17. | 80235 | 5.0% | 4.0%(+0.966)#56 | 12.5%(-7.45)#9,544 |
| 18. | 80203 | 4.5% | 4.0%(+0.412)#60 | 12.5%(-8.01)#10,049 |
| 19. | 80206 | 4.2% | 4.0%(+0.183)#61 | 12.5%(-8.24)#10,272 |
| 20. | 80218 | 3.7% | 4.0%(-0.361)#72 | 12.5%(-8.78)#10,843 |
| 21. | 80233 | 3.0% | 4.0%(-1.06)#86 | 12.5%(-9.48)#11,841 |
| 22. | 80260 | 2.7% | 4.0%(-1.32)#90 | 12.5%(-9.74)#12,249 |
| 23. | 80226 | 2.6% | 4.0%(-1.46)#94 | 12.5%(-9.88)#12,462 |
| 24. | 80202 | 2.6% | 4.0%(-1.48)#96 | 12.5%(-9.90)#12,495 |
| 25. | 80210 | 2.5% | 4.0%(-1.53)#98 | 12.5%(-9.95)#12,572 |
| 26. | 80227 | 2.3% | 4.0%(-1.74)#101 | 12.5%(-10.2)#12,930 |
| 27. | 80214 | 2.1% | 4.0%(-1.94)#109 | 12.5%(-10.4)#13,320 |
| 28. | 80211 | 1.9% | 4.0%(-2.17)#119 | 12.5%(-10.6)#13,878 |
| 29. | 80234 | 1.8% | 4.0%(-2.26)#125 | 12.5%(-10.7)#14,067 |
| 30. | 80219 | 1.6% | 4.0%(-2.45)#134 | 12.5%(-10.9)#14,524 |
| 31. | 80236 | 1.5% | 4.0%(-2.57)#139 | 12.5%(-11.0)#14,899 |
| 32. | 80229 | 1.5% | 4.0%(-2.58)#140 | 12.5%(-11.0)#14,919 |
| 33. | 80221 | 1.4% | 4.0%(-2.61)#142 | 12.5%(-11.0)#15,019 |
| 34. | 80215 | 1.4% | 4.0%(-2.67)#146 | 12.5%(-11.1)#15,175 |
| 35. | 80212 | 1.1% | 4.0%(-2.90)#165 | 12.5%(-11.3)#15,954 |
| 36. | 80228 | 0.82% | 4.0%(-3.23)#200 | 12.5%(-11.6)#17,312 |
| 37. | 80232 | 0.66% | 4.0%(-3.39)#220 | 12.5%(-11.8)#18,194 |
| 38. | 80209 | 0.65% | 4.0%(-3.40)#221 | 12.5%(-11.8)#18,240 |
1
Common Questions
What are the Top 10 Zip Codes with the Highest Percentage of Black / African American Population in Denver, CO?
Top 10 Zip Codes with the Highest Percentage of Black / African American Population in Denver, CO are:
What zip code has the Highest Percentage of Black / African American Population in Denver, CO?
80249 has the Highest Percentage of Black / African American Population in Denver, CO with 32.3%.
What is the Percentage of Black / African American Population in Denver, CO?
Percentage of Black / African American Population in Denver is 8.9%.
What is the Percentage of Black / African American Population in Colorado?
Percentage of Black / African American Population in Colorado is 4.0%.
What is the Percentage of Black / African American Population in the United States?
Percentage of Black / African American Population in the United States is 12.5%.