Zip Codes with the Highest Percentage of Population Employed in Construction & Extraction in Denver, CO
RELATED REPORTS & OPTIONS
Construction & Extraction
Denver
Compare Zip Codes
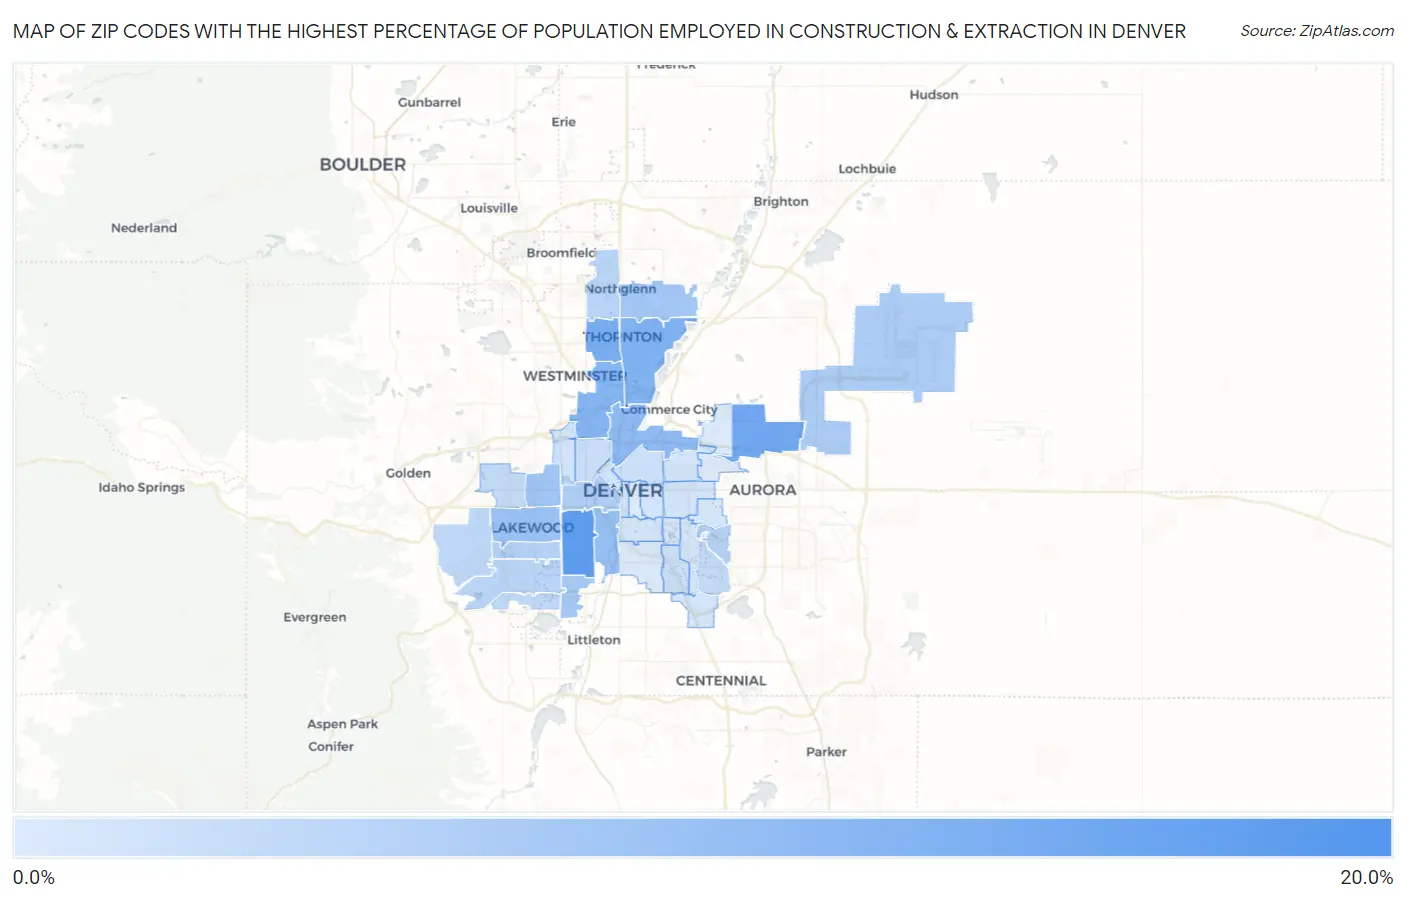
Map of Zip Codes with the Highest Percentage of Population Employed in Construction & Extraction in Denver
0.72%
18.3%
Zip Codes with the Highest Percentage of Population Employed in Construction & Extraction in Denver, CO
| Zip Code | % Employed | vs State | vs National | |
| 1. | 80290 | 18.3% | 5.5%(+12.9)#19 | 5.0%(+13.3)#1,241 |
| 2. | 80219 | 15.4% | 5.5%(+9.96)#31 | 5.0%(+10.4)#1,871 |
| 3. | 80239 | 13.2% | 5.5%(+7.73)#54 | 5.0%(+8.18)#2,849 |
| 4. | 80260 | 12.0% | 5.5%(+6.58)#67 | 5.0%(+7.04)#3,566 |
| 5. | 80229 | 11.3% | 5.5%(+5.90)#76 | 5.0%(+6.35)#4,068 |
| 6. | 80221 | 10.6% | 5.5%(+5.12)#96 | 5.0%(+5.58)#4,784 |
| 7. | 80216 | 9.5% | 5.5%(+4.08)#123 | 5.0%(+4.54)#5,990 |
| 8. | 80223 | 8.8% | 5.5%(+3.32)#140 | 5.0%(+3.78)#7,136 |
| 9. | 80226 | 8.0% | 5.5%(+2.53)#155 | 5.0%(+2.99)#8,525 |
| 10. | 80214 | 7.5% | 5.5%(+2.04)#172 | 5.0%(+2.50)#9,561 |
| 11. | 80233 | 7.2% | 5.5%(+1.77)#185 | 5.0%(+2.23)#10,184 |
| 12. | 80236 | 6.7% | 5.5%(+1.23)#200 | 5.0%(+1.69)#11,527 |
| 13. | 80249 | 6.2% | 5.5%(+0.762)#224 | 5.0%(+1.22)#12,848 |
| 14. | 80204 | 5.8% | 5.5%(+0.398)#238 | 5.0%(+0.855)#13,931 |
| 15. | 80232 | 5.1% | 5.5%(-0.349)#278 | 5.0%(+0.108)#16,359 |
| 16. | 80247 | 5.0% | 5.5%(-0.471)#284 | 5.0%(-0.013)#16,825 |
| 17. | 80234 | 4.7% | 5.5%(-0.790)#298 | 5.0%(-0.333)#17,914 |
| 18. | 80227 | 4.5% | 5.5%(-0.908)#302 | 5.0%(-0.451)#18,352 |
| 19. | 80228 | 4.1% | 5.5%(-1.35)#321 | 5.0%(-0.892)#19,928 |
| 20. | 80235 | 4.0% | 5.5%(-1.45)#326 | 5.0%(-0.996)#20,343 |
| 21. | 80231 | 3.4% | 5.5%(-2.03)#345 | 5.0%(-1.57)#22,236 |
| 22. | 80215 | 3.3% | 5.5%(-2.15)#352 | 5.0%(-1.70)#22,640 |
| 23. | 80211 | 2.8% | 5.5%(-2.64)#370 | 5.0%(-2.19)#24,160 |
| 24. | 80222 | 2.6% | 5.5%(-2.88)#378 | 5.0%(-2.43)#24,875 |
| 25. | 80205 | 2.4% | 5.5%(-3.03)#385 | 5.0%(-2.58)#25,260 |
| 26. | 80212 | 2.0% | 5.5%(-3.49)#404 | 5.0%(-3.03)#26,422 |
| 27. | 80220 | 1.9% | 5.5%(-3.55)#409 | 5.0%(-3.09)#26,579 |
| 28. | 80203 | 1.9% | 5.5%(-3.58)#410 | 5.0%(-3.13)#26,645 |
| 29. | 80246 | 1.8% | 5.5%(-3.62)#412 | 5.0%(-3.17)#26,718 |
| 30. | 80202 | 1.8% | 5.5%(-3.69)#414 | 5.0%(-3.23)#26,850 |
| 31. | 80224 | 1.8% | 5.5%(-3.69)#415 | 5.0%(-3.23)#26,861 |
| 32. | 80237 | 1.7% | 5.5%(-3.74)#418 | 5.0%(-3.28)#26,973 |
| 33. | 80207 | 1.7% | 5.5%(-3.79)#421 | 5.0%(-3.33)#27,077 |
| 34. | 80206 | 1.6% | 5.5%(-3.83)#423 | 5.0%(-3.38)#27,167 |
| 35. | 80209 | 1.5% | 5.5%(-3.94)#428 | 5.0%(-3.49)#27,413 |
| 36. | 80230 | 1.5% | 5.5%(-3.95)#429 | 5.0%(-3.50)#27,428 |
| 37. | 80210 | 1.0% | 5.5%(-4.42)#440 | 5.0%(-3.96)#28,276 |
| 38. | 80218 | 0.75% | 5.5%(-4.70)#446 | 5.0%(-4.24)#28,655 |
| 39. | 80238 | 0.72% | 5.5%(-4.73)#449 | 5.0%(-4.28)#28,706 |
1
Common Questions
What are the Top 10 Zip Codes with the Highest Percentage of Population Employed in Construction & Extraction in Denver, CO?
Top 10 Zip Codes with the Highest Percentage of Population Employed in Construction & Extraction in Denver, CO are:
What zip code has the Highest Percentage of Population Employed in Construction & Extraction in Denver, CO?
80290 has the Highest Percentage of Population Employed in Construction & Extraction in Denver, CO with 18.3%.
What is the Percentage of Population Employed in Construction & Extraction in Denver, CO?
Percentage of Population Employed in Construction & Extraction in Denver is 4.5%.
What is the Percentage of Population Employed in Construction & Extraction in Colorado?
Percentage of Population Employed in Construction & Extraction in Colorado is 5.5%.
What is the Percentage of Population Employed in Construction & Extraction in the United States?
Percentage of Population Employed in Construction & Extraction in the United States is 5.0%.