Zip Codes with the Highest Percentage of Population Employed in Mining, Quarrying, & Extraction in Denver, CO
RELATED REPORTS & OPTIONS
Mining, Quarrying, & Extraction
Denver
Compare Zip Codes
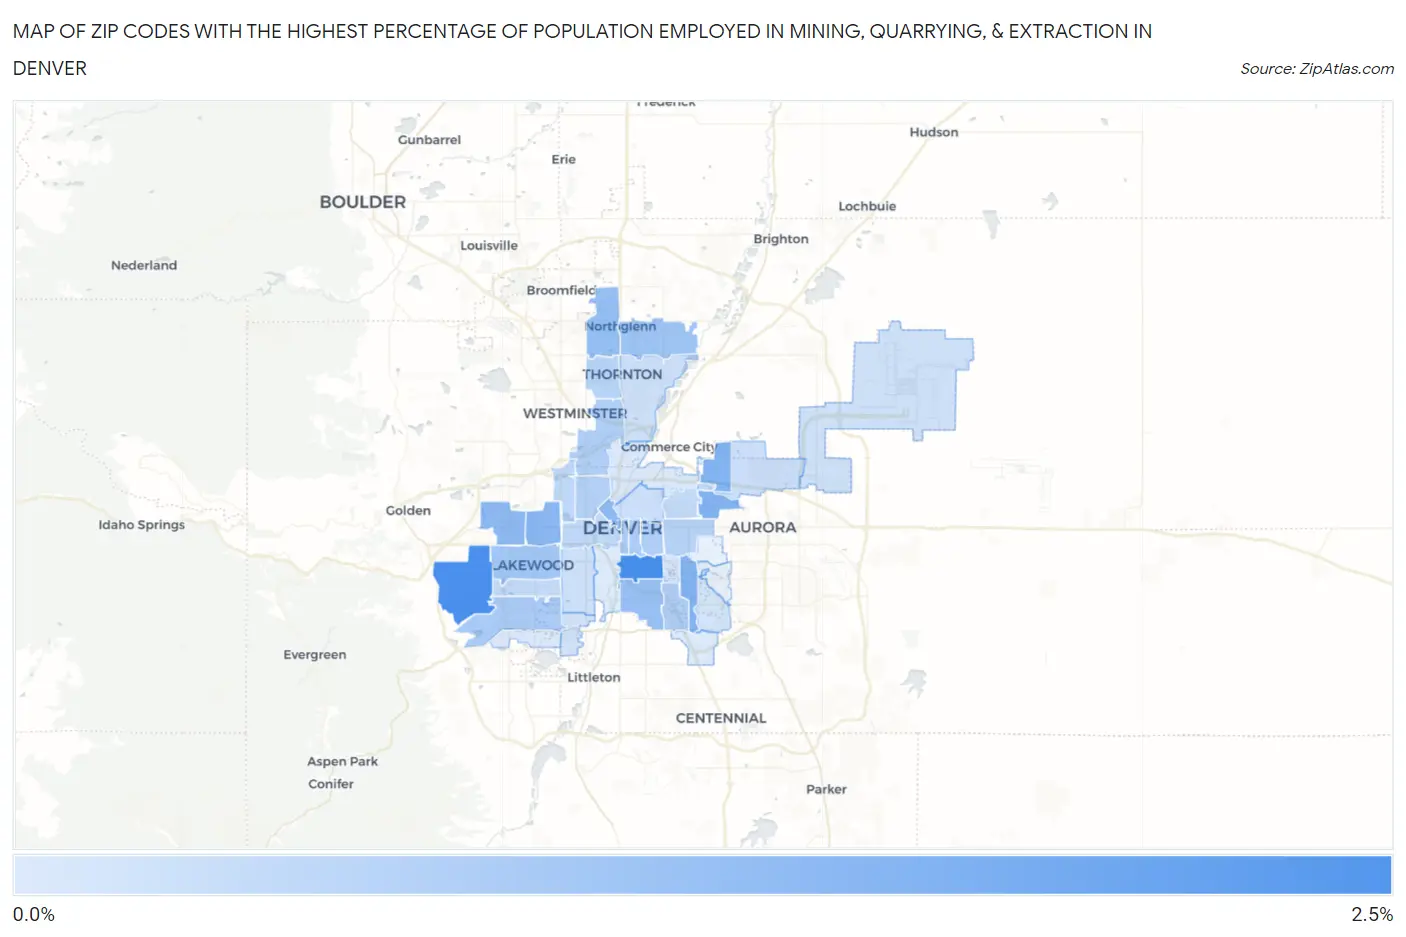
Map of Zip Codes with the Highest Percentage of Population Employed in Mining, Quarrying, & Extraction in Denver
0.12%
2.2%
Zip Codes with the Highest Percentage of Population Employed in Mining, Quarrying, & Extraction in Denver, CO
| Zip Code | % Employed | vs State | vs National | |
| 1. | 80209 | 2.2% | 0.87%(+1.29)#82 | 0.44%(+1.71)#3,495 |
| 2. | 80228 | 2.1% | 0.87%(+1.26)#83 | 0.44%(+1.69)#3,527 |
| 3. | 80238 | 1.3% | 0.87%(+0.464)#123 | 0.44%(+0.893)#4,655 |
| 4. | 80224 | 1.3% | 0.87%(+0.457)#124 | 0.44%(+0.885)#4,666 |
| 5. | 80214 | 1.2% | 0.87%(+0.371)#131 | 0.44%(+0.799)#4,825 |
| 6. | 80215 | 1.2% | 0.87%(+0.326)#136 | 0.44%(+0.755)#4,921 |
| 7. | 80202 | 1.2% | 0.87%(+0.282)#141 | 0.44%(+0.711)#5,014 |
| 8. | 80234 | 1.1% | 0.87%(+0.229)#144 | 0.44%(+0.657)#5,143 |
| 9. | 80210 | 1.0% | 0.87%(+0.174)#151 | 0.44%(+0.602)#5,271 |
| 10. | 80233 | 0.95% | 0.87%(+0.083)#157 | 0.44%(+0.511)#5,508 |
| 11. | 80226 | 0.90% | 0.87%(+0.030)#166 | 0.44%(+0.459)#5,661 |
| 12. | 80227 | 0.80% | 0.87%(-0.070)#177 | 0.44%(+0.358)#5,990 |
| 13. | 80218 | 0.79% | 0.87%(-0.078)#178 | 0.44%(+0.350)#6,014 |
| 14. | 80203 | 0.79% | 0.87%(-0.081)#180 | 0.44%(+0.347)#6,026 |
| 15. | 80206 | 0.74% | 0.87%(-0.124)#185 | 0.44%(+0.305)#6,171 |
| 16. | 80222 | 0.73% | 0.87%(-0.134)#187 | 0.44%(+0.294)#6,214 |
| 17. | 80221 | 0.72% | 0.87%(-0.154)#188 | 0.44%(+0.275)#6,285 |
| 18. | 80211 | 0.69% | 0.87%(-0.178)#190 | 0.44%(+0.251)#6,364 |
| 19. | 80220 | 0.65% | 0.87%(-0.219)#198 | 0.44%(+0.209)#6,556 |
| 20. | 80260 | 0.58% | 0.87%(-0.292)#205 | 0.44%(+0.136)#6,855 |
| 21. | 80204 | 0.51% | 0.87%(-0.354)#210 | 0.44%(+0.074)#7,121 |
| 22. | 80212 | 0.51% | 0.87%(-0.357)#211 | 0.44%(+0.071)#7,141 |
| 23. | 80232 | 0.48% | 0.87%(-0.391)#216 | 0.44%(+0.037)#7,314 |
| 24. | 80207 | 0.47% | 0.87%(-0.401)#219 | 0.44%(+0.027)#7,365 |
| 25. | 80205 | 0.37% | 0.87%(-0.503)#239 | 0.44%(-0.075)#8,013 |
| 26. | 80239 | 0.36% | 0.87%(-0.510)#240 | 0.44%(-0.082)#8,062 |
| 27. | 80219 | 0.35% | 0.87%(-0.521)#243 | 0.44%(-0.093)#8,147 |
| 28. | 80229 | 0.33% | 0.87%(-0.539)#246 | 0.44%(-0.111)#8,274 |
| 29. | 80249 | 0.32% | 0.87%(-0.551)#248 | 0.44%(-0.123)#8,385 |
| 30. | 80236 | 0.27% | 0.87%(-0.596)#254 | 0.44%(-0.167)#8,751 |
| 31. | 80231 | 0.25% | 0.87%(-0.614)#259 | 0.44%(-0.186)#8,928 |
| 32. | 80246 | 0.24% | 0.87%(-0.632)#263 | 0.44%(-0.204)#9,112 |
| 33. | 80235 | 0.16% | 0.87%(-0.707)#281 | 0.44%(-0.279)#9,951 |
| 34. | 80216 | 0.14% | 0.87%(-0.727)#284 | 0.44%(-0.299)#10,215 |
| 35. | 80237 | 0.14% | 0.87%(-0.729)#286 | 0.44%(-0.301)#10,245 |
| 36. | 80223 | 0.12% | 0.87%(-0.745)#290 | 0.44%(-0.317)#10,455 |
1
Common Questions
What are the Top 10 Zip Codes with the Highest Percentage of Population Employed in Mining, Quarrying, & Extraction in Denver, CO?
Top 10 Zip Codes with the Highest Percentage of Population Employed in Mining, Quarrying, & Extraction in Denver, CO are:
What zip code has the Highest Percentage of Population Employed in Mining, Quarrying, & Extraction in Denver, CO?
80209 has the Highest Percentage of Population Employed in Mining, Quarrying, & Extraction in Denver, CO with 2.2%.
What is the Percentage of Population Employed in Mining, Quarrying, & Extraction in Denver, CO?
Percentage of Population Employed in Mining, Quarrying, & Extraction in Denver is 0.63%.
What is the Percentage of Population Employed in Mining, Quarrying, & Extraction in Colorado?
Percentage of Population Employed in Mining, Quarrying, & Extraction in Colorado is 0.87%.
What is the Percentage of Population Employed in Mining, Quarrying, & Extraction in the United States?
Percentage of Population Employed in Mining, Quarrying, & Extraction in the United States is 0.44%.