Zip Codes with the Highest Percentage of Population Employed in Legal Services & Support in Denver, CO
RELATED REPORTS & OPTIONS
Legal Services & Support
Denver
Compare Zip Codes
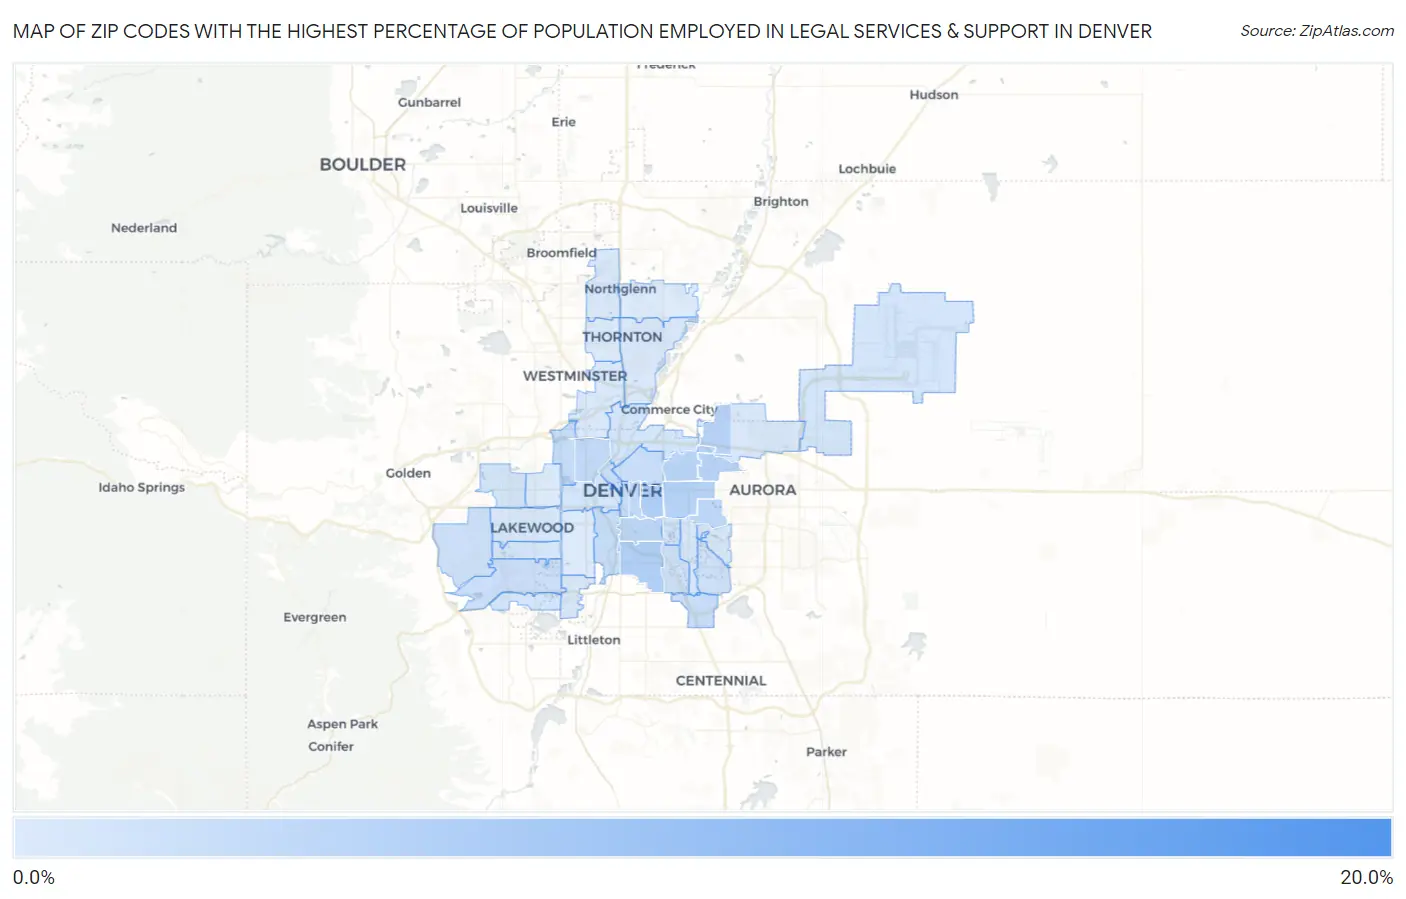
Map of Zip Codes with the Highest Percentage of Population Employed in Legal Services & Support in Denver
0.36%
15.4%
Zip Codes with the Highest Percentage of Population Employed in Legal Services & Support in Denver, CO
| Zip Code | % Employed | vs State | vs National | |
| 1. | 80290 | 15.4% | 1.2%(+14.2)#4 | 1.2%(+14.2)#77 |
| 2. | 80206 | 4.7% | 1.2%(+3.55)#13 | 1.2%(+3.55)#799 |
| 3. | 80210 | 4.6% | 1.2%(+3.38)#14 | 1.2%(+3.38)#871 |
| 4. | 80220 | 4.1% | 1.2%(+2.91)#16 | 1.2%(+2.92)#1,079 |
| 5. | 80238 | 3.9% | 1.2%(+2.69)#18 | 1.2%(+2.69)#1,189 |
| 6. | 80207 | 3.6% | 1.2%(+2.37)#20 | 1.2%(+2.37)#1,384 |
| 7. | 80209 | 3.5% | 1.2%(+2.27)#21 | 1.2%(+2.27)#1,466 |
| 8. | 80230 | 3.4% | 1.2%(+2.22)#22 | 1.2%(+2.22)#1,505 |
| 9. | 80218 | 3.1% | 1.2%(+1.93)#25 | 1.2%(+1.93)#1,736 |
| 10. | 80211 | 2.9% | 1.2%(+1.72)#28 | 1.2%(+1.72)#1,970 |
| 11. | 80223 | 2.6% | 1.2%(+1.43)#33 | 1.2%(+1.43)#2,323 |
| 12. | 80212 | 2.6% | 1.2%(+1.43)#34 | 1.2%(+1.43)#2,337 |
| 13. | 80203 | 2.5% | 1.2%(+1.28)#45 | 1.2%(+1.28)#2,573 |
| 14. | 80202 | 2.4% | 1.2%(+1.20)#49 | 1.2%(+1.21)#2,697 |
| 15. | 80237 | 2.3% | 1.2%(+1.13)#53 | 1.2%(+1.13)#2,819 |
| 16. | 80205 | 2.3% | 1.2%(+1.12)#54 | 1.2%(+1.12)#2,847 |
| 17. | 80227 | 2.2% | 1.2%(+1.02)#58 | 1.2%(+1.02)#3,031 |
| 18. | 80228 | 2.0% | 1.2%(+0.772)#69 | 1.2%(+0.772)#3,585 |
| 19. | 80246 | 1.7% | 1.2%(+0.562)#84 | 1.2%(+0.562)#4,154 |
| 20. | 80222 | 1.7% | 1.2%(+0.529)#87 | 1.2%(+0.530)#4,280 |
| 21. | 80231 | 1.6% | 1.2%(+0.411)#96 | 1.2%(+0.411)#4,693 |
| 22. | 80204 | 1.3% | 1.2%(+0.143)#119 | 1.2%(+0.144)#5,799 |
| 23. | 80249 | 1.3% | 1.2%(+0.120)#123 | 1.2%(+0.120)#5,919 |
| 24. | 80235 | 1.2% | 1.2%(+0.048)#130 | 1.2%(+0.048)#6,313 |
| 25. | 80216 | 1.2% | 1.2%(+0.039)#132 | 1.2%(+0.039)#6,350 |
| 26. | 80215 | 1.2% | 1.2%(+0.000)#138 | 1.2%(+0.001)#6,612 |
| 27. | 80224 | 0.98% | 1.2%(-0.203)#157 | 1.2%(-0.203)#7,953 |
| 28. | 80232 | 0.90% | 1.2%(-0.284)#169 | 1.2%(-0.283)#8,595 |
| 29. | 80226 | 0.86% | 1.2%(-0.326)#178 | 1.2%(-0.326)#8,949 |
| 30. | 80236 | 0.84% | 1.2%(-0.341)#182 | 1.2%(-0.340)#9,075 |
| 31. | 80239 | 0.82% | 1.2%(-0.361)#183 | 1.2%(-0.361)#9,257 |
| 32. | 80234 | 0.81% | 1.2%(-0.372)#187 | 1.2%(-0.371)#9,330 |
| 33. | 80247 | 0.75% | 1.2%(-0.438)#197 | 1.2%(-0.438)#9,967 |
| 34. | 80229 | 0.59% | 1.2%(-0.595)#223 | 1.2%(-0.594)#11,565 |
| 35. | 80221 | 0.59% | 1.2%(-0.596)#224 | 1.2%(-0.596)#11,580 |
| 36. | 80233 | 0.46% | 1.2%(-0.722)#235 | 1.2%(-0.721)#13,103 |
| 37. | 80219 | 0.39% | 1.2%(-0.790)#244 | 1.2%(-0.790)#13,905 |
| 38. | 80214 | 0.37% | 1.2%(-0.816)#250 | 1.2%(-0.816)#14,229 |
| 39. | 80260 | 0.36% | 1.2%(-0.826)#253 | 1.2%(-0.825)#14,348 |
1
Common Questions
What are the Top 10 Zip Codes with the Highest Percentage of Population Employed in Legal Services & Support in Denver, CO?
Top 10 Zip Codes with the Highest Percentage of Population Employed in Legal Services & Support in Denver, CO are:
What zip code has the Highest Percentage of Population Employed in Legal Services & Support in Denver, CO?
80290 has the Highest Percentage of Population Employed in Legal Services & Support in Denver, CO with 15.4%.
What is the Percentage of Population Employed in Legal Services & Support in Denver, CO?
Percentage of Population Employed in Legal Services & Support in Denver is 2.4%.
What is the Percentage of Population Employed in Legal Services & Support in Colorado?
Percentage of Population Employed in Legal Services & Support in Colorado is 1.2%.
What is the Percentage of Population Employed in Legal Services & Support in the United States?
Percentage of Population Employed in Legal Services & Support in the United States is 1.2%.