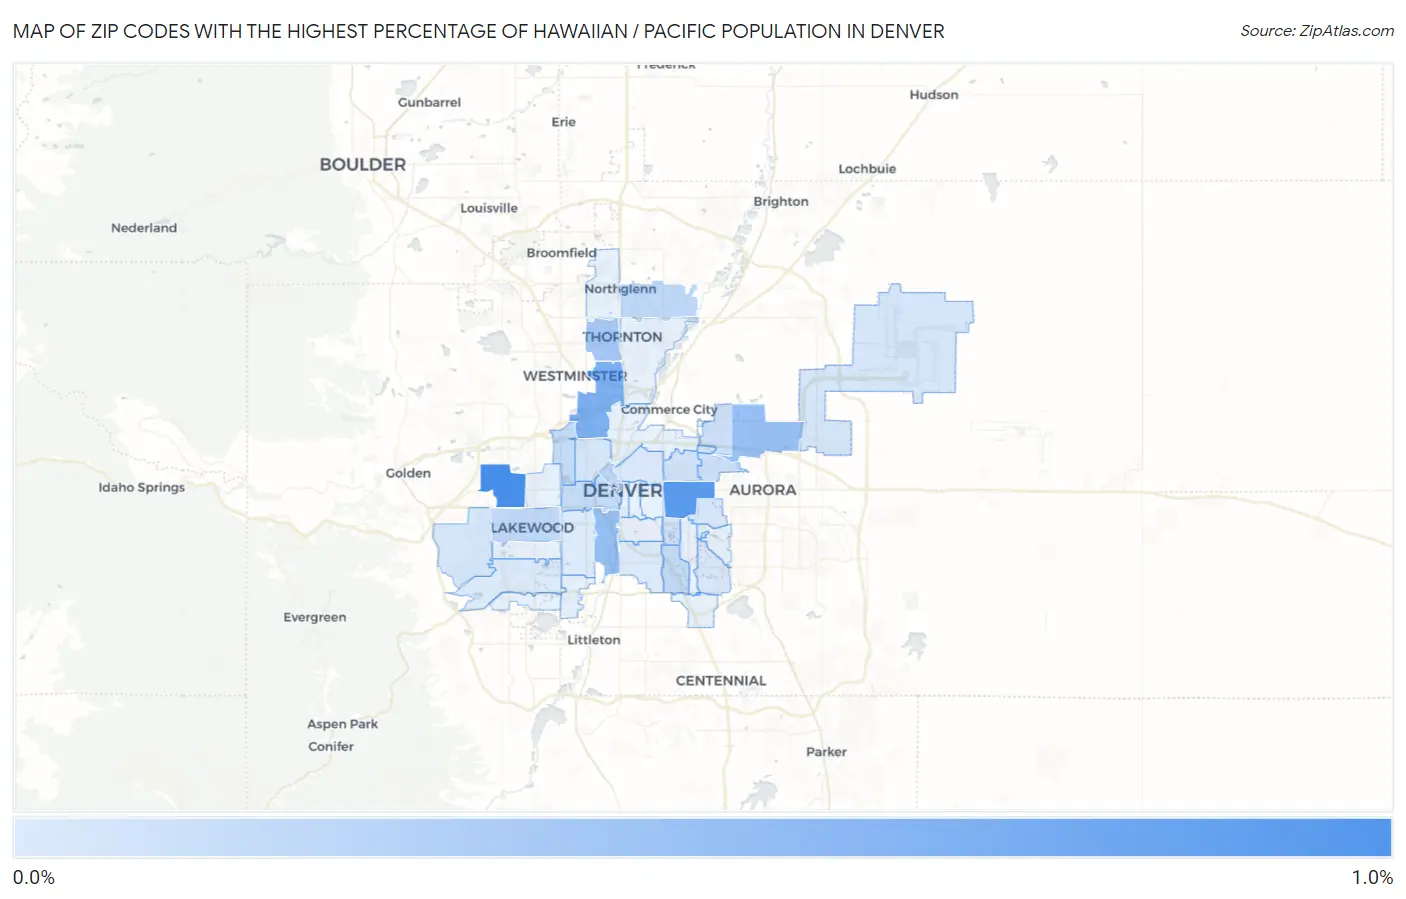
Zip Codes with the Highest Percentage of Hawaiian / Pacific Population in Denver, CO
RELATED REPORTS & OPTIONS
Hawaiian / Pacific
Denver
Compare Zip Codes
Map of Zip Codes with the Highest Percentage of Hawaiian / Pacific Population in Denver
0.012%
0.86%
Zip Codes with the Highest Percentage of Hawaiian / Pacific Population in Denver, CO
| Zip Code | Hawaiian / Pacific | vs State | vs National | |
| 1. | 80215 | 0.86% | 0.14%(+0.716)#13 | 0.19%(+0.668)#849 |
| 2. | 80220 | 0.77% | 0.14%(+0.630)#16 | 0.19%(+0.581)#960 |
| 3. | 80221 | 0.55% | 0.14%(+0.413)#25 | 0.19%(+0.364)#1,304 |
| 4. | 80223 | 0.41% | 0.14%(+0.268)#32 | 0.19%(+0.219)#1,681 |
| 5. | 80239 | 0.40% | 0.14%(+0.264)#34 | 0.19%(+0.216)#1,691 |
| 6. | 80260 | 0.32% | 0.14%(+0.177)#42 | 0.19%(+0.128)#2,029 |
| 7. | 80202 | 0.20% | 0.14%(+0.063)#59 | 0.19%(+0.015)#2,782 |
| 8. | 80233 | 0.18% | 0.14%(+0.038)#65 | 0.19%(-0.010)#3,008 |
| 9. | 80226 | 0.17% | 0.14%(+0.028)#71 | 0.19%(-0.020)#3,124 |
| 10. | 80212 | 0.14% | 0.14%(+0.002)#78 | 0.19%(-0.047)#3,436 |
| 11. | 80204 | 0.14% | 0.14%(+0.002)#79 | 0.19%(-0.047)#3,439 |
| 12. | 80222 | 0.14% | 0.14%(-0.001)#81 | 0.19%(-0.049)#3,469 |
| 13. | 80238 | 0.099% | 0.14%(-0.042)#92 | 0.19%(-0.090)#4,066 |
| 14. | 80246 | 0.092% | 0.14%(-0.048)#96 | 0.19%(-0.097)#4,191 |
| 15. | 80207 | 0.081% | 0.14%(-0.060)#100 | 0.19%(-0.108)#4,409 |
| 16. | 80230 | 0.057% | 0.14%(-0.083)#109 | 0.19%(-0.132)#4,917 |
| 17. | 80211 | 0.055% | 0.14%(-0.085)#112 | 0.19%(-0.133)#4,964 |
| 18. | 80249 | 0.053% | 0.14%(-0.087)#115 | 0.19%(-0.136)#5,016 |
| 19. | 80228 | 0.052% | 0.14%(-0.089)#118 | 0.19%(-0.137)#5,048 |
| 20. | 80231 | 0.026% | 0.14%(-0.114)#136 | 0.19%(-0.163)#5,794 |
| 21. | 80205 | 0.023% | 0.14%(-0.117)#139 | 0.19%(-0.165)#5,889 |
| 22. | 80210 | 0.016% | 0.14%(-0.124)#145 | 0.19%(-0.173)#6,118 |
| 23. | 80227 | 0.014% | 0.14%(-0.126)#146 | 0.19%(-0.175)#6,157 |
| 24. | 80219 | 0.012% | 0.14%(-0.128)#148 | 0.19%(-0.176)#6,216 |
1
Common Questions
What are the Top 10 Zip Codes with the Highest Percentage of Hawaiian / Pacific Population in Denver, CO?
Top 10 Zip Codes with the Highest Percentage of Hawaiian / Pacific Population in Denver, CO are:
What zip code has the Highest Percentage of Hawaiian / Pacific Population in Denver, CO?
80215 has the Highest Percentage of Hawaiian / Pacific Population in Denver, CO with 0.86%.
What is the Percentage of Hawaiian / Pacific Population in Denver, CO?
Percentage of Hawaiian / Pacific Population in Denver is 0.12%.
What is the Percentage of Hawaiian / Pacific Population in Colorado?
Percentage of Hawaiian / Pacific Population in Colorado is 0.14%.
What is the Percentage of Hawaiian / Pacific Population in the United States?
Percentage of Hawaiian / Pacific Population in the United States is 0.19%.