Zip Codes with the Highest Percentage of Population Taking Taxi / Cab to Work in Denver, CO
RELATED REPORTS & OPTIONS
Taxi / Cab
Denver
Compare Zip Codes
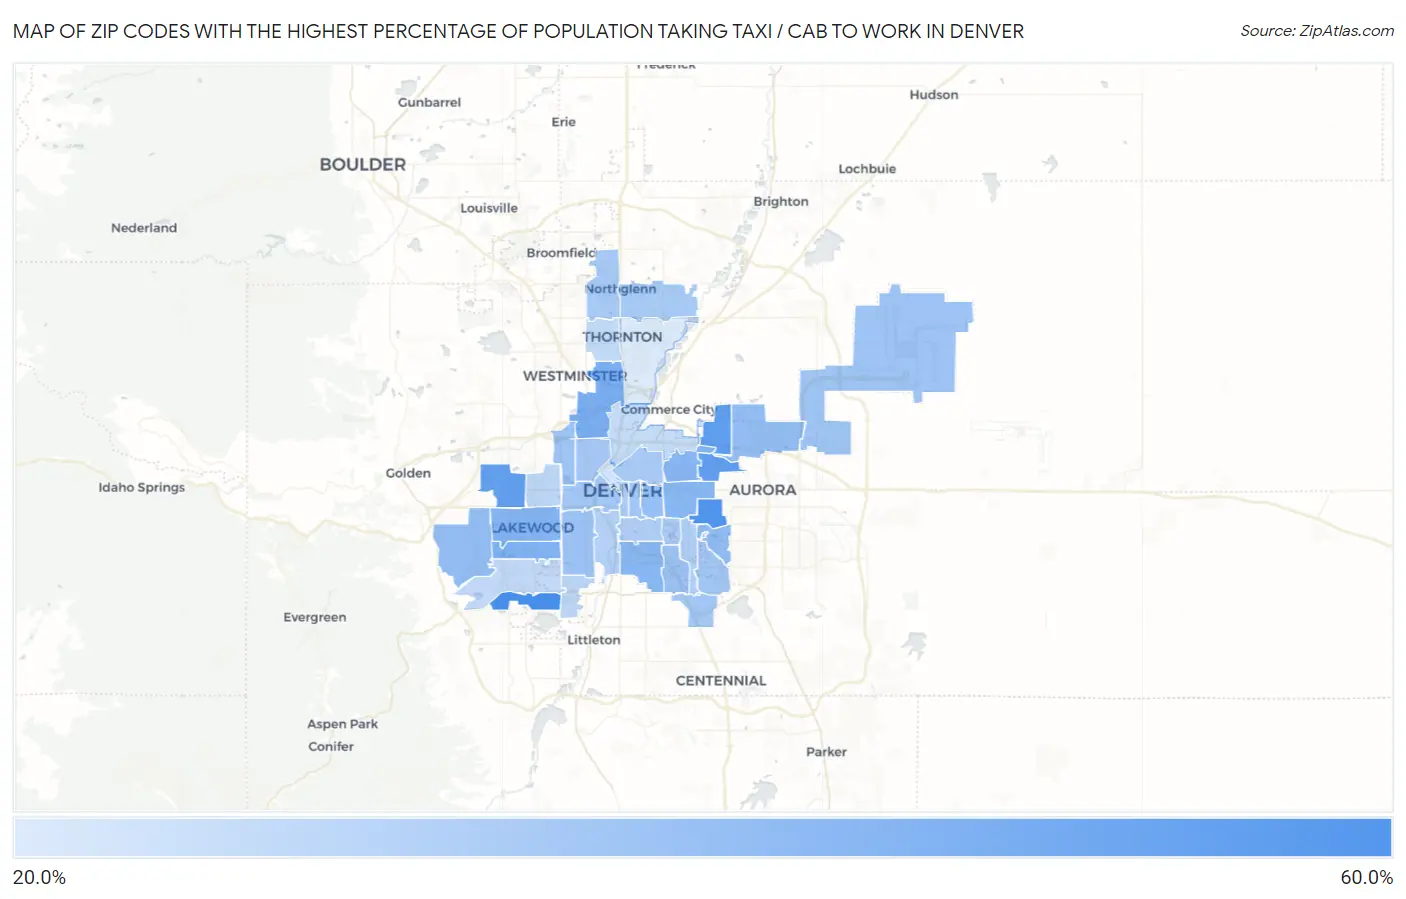
Map of Zip Codes with the Highest Percentage of Population Taking Taxi / Cab to Work in Denver
25.4%
52.3%
Zip Codes with the Highest Percentage of Population Taking Taxi / Cab to Work in Denver, CO
| Zip Code | % Take Taxi / Cab | vs State | vs National | |
| 1. | 80235 | 52.3% | 37.4%(+14.9)#32 | 38.2%(+14.1)#2,298 |
| 2. | 80230 | 50.7% | 37.4%(+13.3)#40 | 38.2%(+12.5)#2,743 |
| 3. | 80238 | 47.4% | 37.4%(+10.00)#57 | 38.2%(+9.20)#3,831 |
| 4. | 80215 | 47.1% | 37.4%(+9.70)#61 | 38.2%(+8.90)#3,945 |
| 5. | 80221 | 42.5% | 37.4%(+5.10)#85 | 38.2%(+4.30)#5,512 |
| 6. | 80232 | 41.3% | 37.4%(+3.90)#95 | 38.2%(+3.10)#6,040 |
| 7. | 80226 | 40.8% | 37.4%(+3.40)#97 | 38.2%(+2.60)#6,246 |
| 8. | 80210 | 40.2% | 37.4%(+2.80)#99 | 38.2%(+2.00)#6,525 |
| 9. | 80207 | 40.0% | 37.4%(+2.60)#104 | 38.2%(+1.80)#6,622 |
| 10. | 80220 | 39.9% | 37.4%(+2.50)#105 | 38.2%(+1.70)#6,652 |
| 11. | 80247 | 38.3% | 37.4%(+0.900)#116 | 38.2%(+0.100)#7,355 |
| 12. | 80239 | 38.1% | 37.4%(+0.700)#118 | 38.2%(-0.100)#7,421 |
| 13. | 80228 | 37.8% | 37.4%(+0.400)#121 | 38.2%(-0.400)#7,571 |
| 14. | 80206 | 37.3% | 37.4%(-0.100)#126 | 38.2%(-0.900)#7,814 |
| 15. | 80219 | 36.9% | 37.4%(-0.500)#129 | 38.2%(-1.30)#7,967 |
| 16. | 80222 | 36.9% | 37.4%(-0.500)#130 | 38.2%(-1.30)#7,991 |
| 17. | 80249 | 36.1% | 37.4%(-1.30)#136 | 38.2%(-2.10)#8,379 |
| 18. | 80212 | 35.9% | 37.4%(-1.50)#139 | 38.2%(-2.30)#8,469 |
| 19. | 80204 | 35.3% | 37.4%(-2.10)#148 | 38.2%(-2.90)#8,782 |
| 20. | 80231 | 35.3% | 37.4%(-2.10)#149 | 38.2%(-2.90)#8,783 |
| 21. | 80237 | 35.0% | 37.4%(-2.40)#150 | 38.2%(-3.20)#8,886 |
| 22. | 80218 | 35.0% | 37.4%(-2.40)#151 | 38.2%(-3.20)#8,890 |
| 23. | 80211 | 34.6% | 37.4%(-2.80)#155 | 38.2%(-3.60)#9,075 |
| 24. | 80205 | 34.5% | 37.4%(-2.90)#156 | 38.2%(-3.70)#9,118 |
| 25. | 80234 | 34.5% | 37.4%(-2.90)#157 | 38.2%(-3.70)#9,123 |
| 26. | 80233 | 34.4% | 37.4%(-3.00)#159 | 38.2%(-3.80)#9,173 |
| 27. | 80246 | 33.9% | 37.4%(-3.50)#163 | 38.2%(-4.30)#9,398 |
| 28. | 80203 | 33.7% | 37.4%(-3.70)#165 | 38.2%(-4.50)#9,482 |
| 29. | 80209 | 33.2% | 37.4%(-4.20)#166 | 38.2%(-5.00)#9,693 |
| 30. | 80224 | 32.9% | 37.4%(-4.50)#167 | 38.2%(-5.30)#9,804 |
| 31. | 80223 | 32.3% | 37.4%(-5.10)#175 | 38.2%(-5.90)#10,078 |
| 32. | 80214 | 30.8% | 37.4%(-6.60)#182 | 38.2%(-7.40)#10,613 |
| 33. | 80236 | 30.7% | 37.4%(-6.70)#183 | 38.2%(-7.50)#10,684 |
| 34. | 80227 | 30.1% | 37.4%(-7.30)#191 | 38.2%(-8.10)#10,877 |
| 35. | 80260 | 29.7% | 37.4%(-7.70)#194 | 38.2%(-8.50)#11,019 |
| 36. | 80216 | 29.3% | 37.4%(-8.10)#198 | 38.2%(-8.90)#11,189 |
| 37. | 80202 | 26.9% | 37.4%(-10.5)#209 | 38.2%(-11.3)#11,844 |
| 38. | 80229 | 25.4% | 37.4%(-12.0)#213 | 38.2%(-12.8)#12,167 |
1
Common Questions
What are the Top 10 Zip Codes with the Highest Percentage of Population Taking Taxi / Cab to Work in Denver, CO?
Top 10 Zip Codes with the Highest Percentage of Population Taking Taxi / Cab to Work in Denver, CO are:
What zip code has the Highest Percentage of Population Taking Taxi / Cab to Work in Denver, CO?
80235 has the Highest Percentage of Population Taking Taxi / Cab to Work in Denver, CO with 52.3%.
What is the Percentage of Population Taking Taxi / Cab to Work in Denver, CO?
Percentage of Population Taking Taxi / Cab to Work in Denver is 35.2%.
What is the Percentage of Population Taking Taxi / Cab to Work in Colorado?
Percentage of Population Taking Taxi / Cab to Work in Colorado is 37.4%.
What is the Percentage of Population Taking Taxi / Cab to Work in the United States?
Percentage of Population Taking Taxi / Cab to Work in the United States is 38.2%.