Zip Codes with the Highest Percentage of Population Employed in Life, Physical & Social Science in Denver, CO
RELATED REPORTS & OPTIONS
Life, Physical & Social Science
Denver
Compare Zip Codes
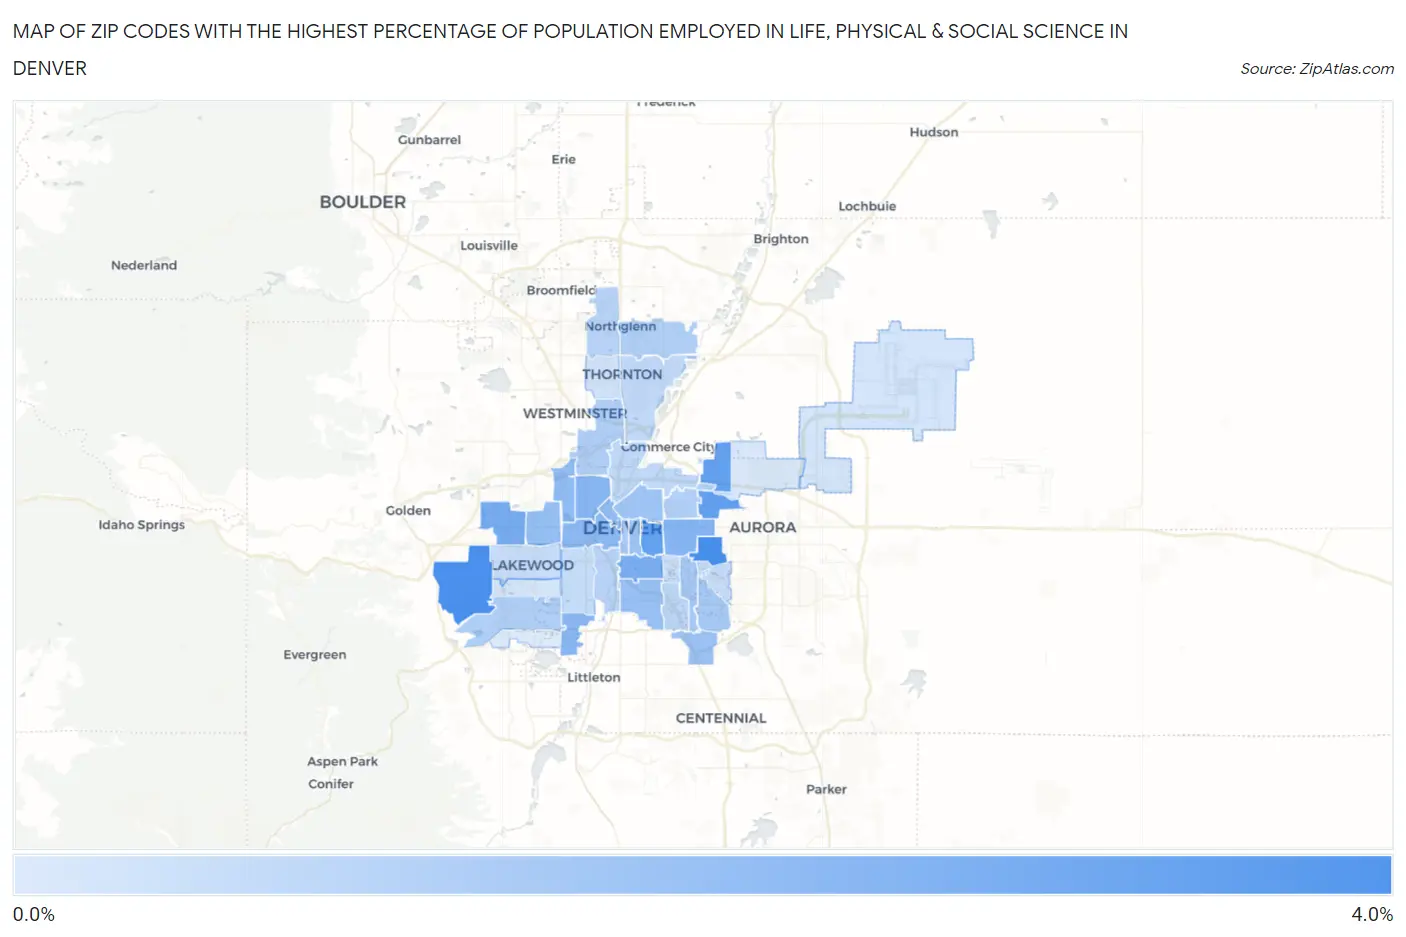
Map of Zip Codes with the Highest Percentage of Population Employed in Life, Physical & Social Science in Denver
0.20%
3.4%
Zip Codes with the Highest Percentage of Population Employed in Life, Physical & Social Science in Denver, CO
| Zip Code | % Employed | vs State | vs National | |
| 1. | 80230 | 3.4% | 1.3%(+2.11)#41 | 1.1%(+2.34)#1,475 |
| 2. | 80228 | 3.4% | 1.3%(+2.06)#43 | 1.1%(+2.29)#1,509 |
| 3. | 80238 | 2.8% | 1.3%(+1.53)#56 | 1.1%(+1.76)#2,053 |
| 4. | 80206 | 2.8% | 1.3%(+1.52)#59 | 1.1%(+1.74)#2,075 |
| 5. | 80215 | 2.4% | 1.3%(+1.06)#66 | 1.1%(+1.29)#2,791 |
| 6. | 80209 | 2.3% | 1.3%(+0.957)#71 | 1.1%(+1.18)#3,010 |
| 7. | 80220 | 2.1% | 1.3%(+0.753)#78 | 1.1%(+0.980)#3,489 |
| 8. | 80211 | 2.0% | 1.3%(+0.718)#82 | 1.1%(+0.946)#3,580 |
| 9. | 80236 | 2.0% | 1.3%(+0.654)#89 | 1.1%(+0.881)#3,766 |
| 10. | 80204 | 1.9% | 1.3%(+0.606)#96 | 1.1%(+0.833)#3,902 |
| 11. | 80212 | 1.8% | 1.3%(+0.507)#104 | 1.1%(+0.734)#4,239 |
| 12. | 80202 | 1.8% | 1.3%(+0.452)#110 | 1.1%(+0.679)#4,443 |
| 13. | 80214 | 1.7% | 1.3%(+0.430)#112 | 1.1%(+0.658)#4,515 |
| 14. | 80210 | 1.7% | 1.3%(+0.360)#114 | 1.1%(+0.587)#4,825 |
| 15. | 80218 | 1.6% | 1.3%(+0.256)#119 | 1.1%(+0.483)#5,276 |
| 16. | 80237 | 1.6% | 1.3%(+0.241)#120 | 1.1%(+0.468)#5,337 |
| 17. | 80205 | 1.5% | 1.3%(+0.209)#122 | 1.1%(+0.436)#5,511 |
| 18. | 80224 | 1.4% | 1.3%(+0.078)#134 | 1.1%(+0.305)#6,221 |
| 19. | 80231 | 1.3% | 1.3%(+0.022)#142 | 1.1%(+0.250)#6,527 |
| 20. | 80203 | 1.3% | 1.3%(-0.014)#146 | 1.1%(+0.214)#6,775 |
| 21. | 80221 | 1.2% | 1.3%(-0.151)#162 | 1.1%(+0.076)#7,751 |
| 22. | 80227 | 1.1% | 1.3%(-0.172)#164 | 1.1%(+0.055)#7,884 |
| 23. | 80233 | 1.1% | 1.3%(-0.186)#168 | 1.1%(+0.041)#7,997 |
| 24. | 80207 | 1.1% | 1.3%(-0.224)#171 | 1.1%(+0.003)#8,273 |
| 25. | 80234 | 0.97% | 1.3%(-0.345)#186 | 1.1%(-0.118)#9,294 |
| 26. | 80223 | 0.96% | 1.3%(-0.354)#187 | 1.1%(-0.127)#9,377 |
| 27. | 80222 | 0.90% | 1.3%(-0.416)#195 | 1.1%(-0.189)#9,936 |
| 28. | 80216 | 0.86% | 1.3%(-0.459)#201 | 1.1%(-0.232)#10,384 |
| 29. | 80229 | 0.77% | 1.3%(-0.549)#221 | 1.1%(-0.322)#11,318 |
| 30. | 80219 | 0.71% | 1.3%(-0.613)#229 | 1.1%(-0.386)#11,964 |
| 31. | 80247 | 0.65% | 1.3%(-0.665)#240 | 1.1%(-0.438)#12,626 |
| 32. | 80226 | 0.64% | 1.3%(-0.676)#244 | 1.1%(-0.449)#12,752 |
| 33. | 80246 | 0.60% | 1.3%(-0.722)#252 | 1.1%(-0.495)#13,355 |
| 34. | 80260 | 0.44% | 1.3%(-0.877)#275 | 1.1%(-0.650)#15,248 |
| 35. | 80249 | 0.40% | 1.3%(-0.918)#280 | 1.1%(-0.690)#15,746 |
| 36. | 80232 | 0.35% | 1.3%(-0.972)#286 | 1.1%(-0.745)#16,447 |
| 37. | 80239 | 0.31% | 1.3%(-1.00)#290 | 1.1%(-0.777)#16,893 |
| 38. | 80235 | 0.20% | 1.3%(-1.12)#306 | 1.1%(-0.889)#18,178 |
1
Common Questions
What are the Top 10 Zip Codes with the Highest Percentage of Population Employed in Life, Physical & Social Science in Denver, CO?
Top 10 Zip Codes with the Highest Percentage of Population Employed in Life, Physical & Social Science in Denver, CO are:
What zip code has the Highest Percentage of Population Employed in Life, Physical & Social Science in Denver, CO?
80230 has the Highest Percentage of Population Employed in Life, Physical & Social Science in Denver, CO with 3.4%.
What is the Percentage of Population Employed in Life, Physical & Social Science in Denver, CO?
Percentage of Population Employed in Life, Physical & Social Science in Denver is 1.5%.
What is the Percentage of Population Employed in Life, Physical & Social Science in Colorado?
Percentage of Population Employed in Life, Physical & Social Science in Colorado is 1.3%.
What is the Percentage of Population Employed in Life, Physical & Social Science in the United States?
Percentage of Population Employed in Life, Physical & Social Science in the United States is 1.1%.