Zip Codes with the Highest Percentage of Population Employed in Finance & Insurance in Denver, CO
RELATED REPORTS & OPTIONS
Finance & Insurance
Denver
Compare Zip Codes
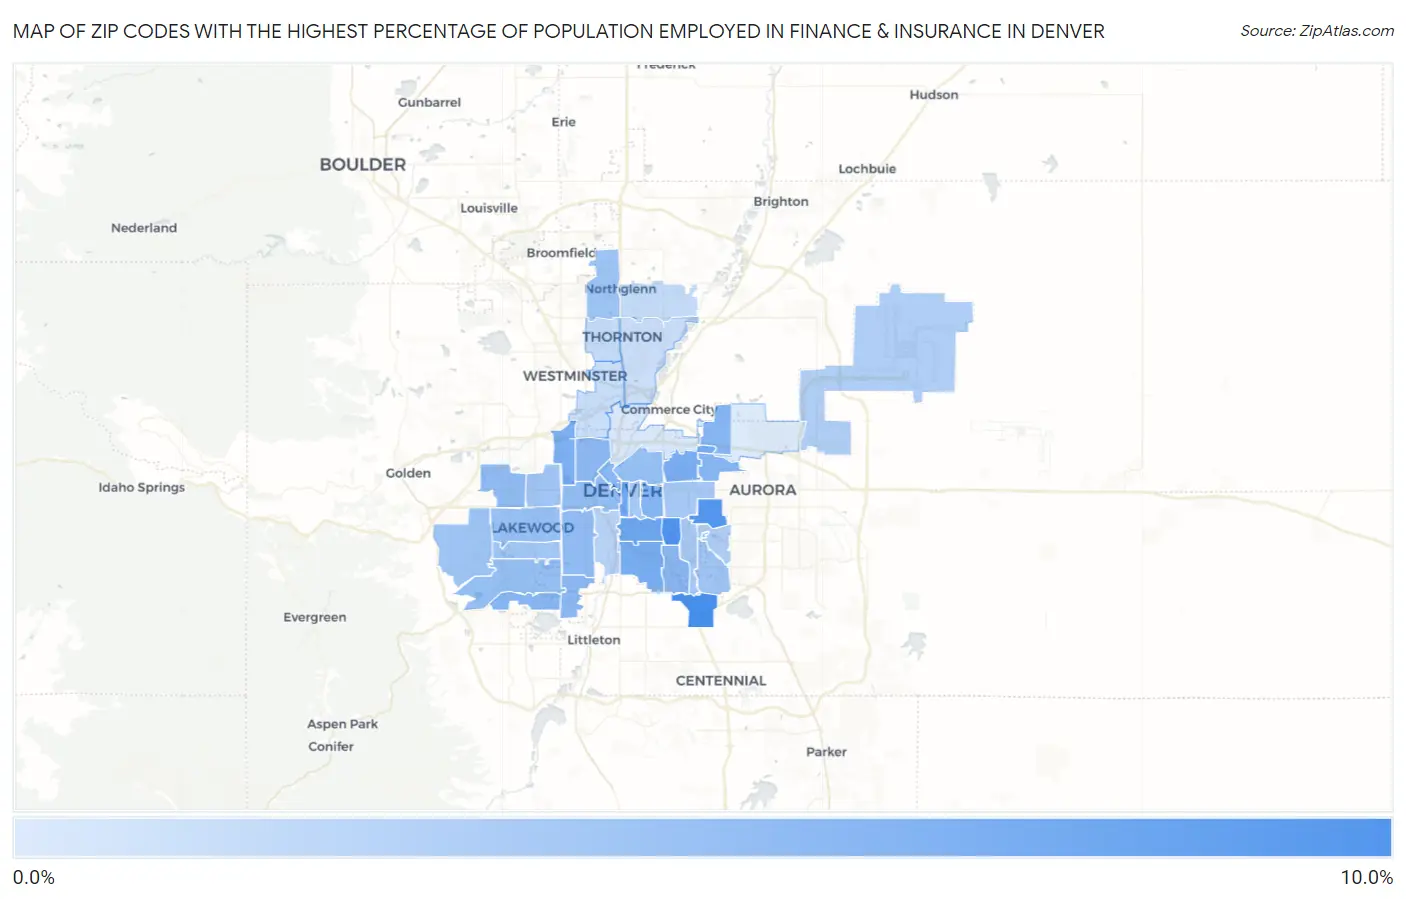
Map of Zip Codes with the Highest Percentage of Population Employed in Finance & Insurance in Denver
1.8%
9.9%
Zip Codes with the Highest Percentage of Population Employed in Finance & Insurance in Denver, CO
| Zip Code | % Employed | vs State | vs National | |
| 1. | 80237 | 9.9% | 4.8%(+5.12)#17 | 4.8%(+5.16)#1,749 |
| 2. | 80246 | 9.5% | 4.8%(+4.66)#21 | 4.8%(+4.70)#1,983 |
| 3. | 80230 | 9.1% | 4.8%(+4.29)#24 | 4.8%(+4.34)#2,184 |
| 4. | 80209 | 7.8% | 4.8%(+2.96)#47 | 4.8%(+3.00)#3,319 |
| 5. | 80203 | 7.6% | 4.8%(+2.83)#52 | 4.8%(+2.88)#3,449 |
| 6. | 80210 | 7.3% | 4.8%(+2.48)#56 | 4.8%(+2.53)#3,834 |
| 7. | 80207 | 7.1% | 4.8%(+2.33)#59 | 4.8%(+2.37)#4,053 |
| 8. | 80212 | 6.8% | 4.8%(+2.02)#65 | 4.8%(+2.06)#4,482 |
| 9. | 80206 | 6.5% | 4.8%(+1.71)#69 | 4.8%(+1.75)#4,956 |
| 10. | 80235 | 6.4% | 4.8%(+1.55)#74 | 4.8%(+1.59)#5,207 |
| 11. | 80238 | 6.3% | 4.8%(+1.51)#75 | 4.8%(+1.55)#5,272 |
| 12. | 80202 | 6.2% | 4.8%(+1.42)#80 | 4.8%(+1.47)#5,432 |
| 13. | 80222 | 6.2% | 4.8%(+1.40)#81 | 4.8%(+1.44)#5,473 |
| 14. | 80236 | 6.1% | 4.8%(+1.33)#84 | 4.8%(+1.37)#5,589 |
| 15. | 80211 | 6.1% | 4.8%(+1.30)#85 | 4.8%(+1.35)#5,642 |
| 16. | 80219 | 5.9% | 4.8%(+1.10)#88 | 4.8%(+1.14)#6,057 |
| 17. | 80215 | 5.8% | 4.8%(+1.00)#93 | 4.8%(+1.04)#6,261 |
| 18. | 80204 | 5.7% | 4.8%(+0.866)#99 | 4.8%(+0.908)#6,551 |
| 19. | 80205 | 5.7% | 4.8%(+0.852)#102 | 4.8%(+0.895)#6,580 |
| 20. | 80227 | 5.6% | 4.8%(+0.744)#105 | 4.8%(+0.787)#6,859 |
| 21. | 80226 | 5.5% | 4.8%(+0.647)#108 | 4.8%(+0.690)#7,091 |
| 22. | 80234 | 5.2% | 4.8%(+0.361)#115 | 4.8%(+0.404)#7,790 |
| 23. | 80228 | 5.1% | 4.8%(+0.290)#118 | 4.8%(+0.333)#7,993 |
| 24. | 80290 | 5.0% | 4.8%(+0.220)#123 | 4.8%(+0.262)#8,195 |
| 25. | 80214 | 5.0% | 4.8%(+0.202)#124 | 4.8%(+0.245)#8,249 |
| 26. | 80231 | 5.0% | 4.8%(+0.151)#126 | 4.8%(+0.193)#8,404 |
| 27. | 80232 | 4.8% | 4.8%(-0.000)#134 | 4.8%(+0.043)#8,858 |
| 28. | 80220 | 4.7% | 4.8%(-0.061)#139 | 4.8%(-0.019)#9,062 |
| 29. | 80224 | 4.7% | 4.8%(-0.066)#140 | 4.8%(-0.023)#9,076 |
| 30. | 80218 | 4.7% | 4.8%(-0.087)#141 | 4.8%(-0.045)#9,147 |
| 31. | 80247 | 4.2% | 4.8%(-0.594)#158 | 4.8%(-0.552)#10,807 |
| 32. | 80249 | 4.1% | 4.8%(-0.707)#163 | 4.8%(-0.664)#11,185 |
| 33. | 80223 | 3.7% | 4.8%(-1.10)#183 | 4.8%(-1.05)#12,707 |
| 34. | 80233 | 3.2% | 4.8%(-1.63)#220 | 4.8%(-1.59)#15,026 |
| 35. | 80260 | 3.0% | 4.8%(-1.78)#234 | 4.8%(-1.73)#15,667 |
| 36. | 80221 | 2.9% | 4.8%(-1.94)#246 | 4.8%(-1.90)#16,426 |
| 37. | 80229 | 2.8% | 4.8%(-2.06)#254 | 4.8%(-2.01)#16,973 |
| 38. | 80216 | 2.1% | 4.8%(-2.70)#302 | 4.8%(-2.65)#19,987 |
| 39. | 80239 | 1.8% | 4.8%(-2.99)#316 | 4.8%(-2.95)#21,240 |
1
Common Questions
What are the Top 10 Zip Codes with the Highest Percentage of Population Employed in Finance & Insurance in Denver, CO?
Top 10 Zip Codes with the Highest Percentage of Population Employed in Finance & Insurance in Denver, CO are:
What zip code has the Highest Percentage of Population Employed in Finance & Insurance in Denver, CO?
80237 has the Highest Percentage of Population Employed in Finance & Insurance in Denver, CO with 9.9%.
What is the Percentage of Population Employed in Finance & Insurance in Denver, CO?
Percentage of Population Employed in Finance & Insurance in Denver is 5.8%.
What is the Percentage of Population Employed in Finance & Insurance in Colorado?
Percentage of Population Employed in Finance & Insurance in Colorado is 4.8%.
What is the Percentage of Population Employed in Finance & Insurance in the United States?
Percentage of Population Employed in Finance & Insurance in the United States is 4.8%.