Zip Codes with the Highest Percentage of Population Employed in Real Estate, Rental & Leasing in Denver, CO
RELATED REPORTS & OPTIONS
Real Estate, Rental & Leasing
Denver
Compare Zip Codes
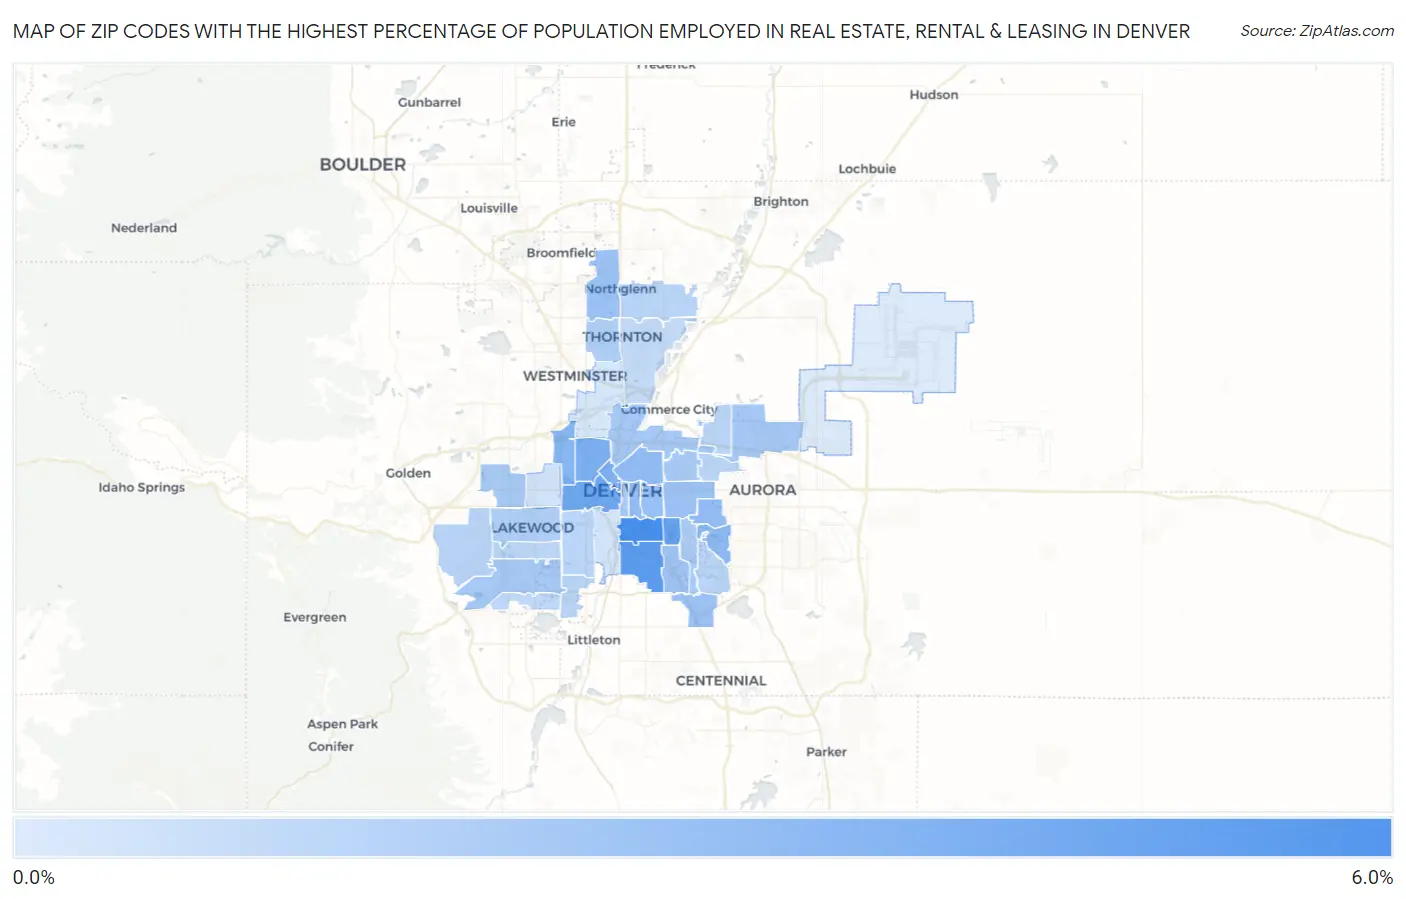
Map of Zip Codes with the Highest Percentage of Population Employed in Real Estate, Rental & Leasing in Denver
0.94%
5.6%
Zip Codes with the Highest Percentage of Population Employed in Real Estate, Rental & Leasing in Denver, CO
| Zip Code | % Employed | vs State | vs National | |
| 1. | 80209 | 5.6% | 2.4%(+3.22)#35 | 1.9%(+3.76)#1,097 |
| 2. | 80210 | 5.0% | 2.4%(+2.57)#45 | 1.9%(+3.10)#1,390 |
| 3. | 80246 | 4.7% | 2.4%(+2.29)#50 | 1.9%(+2.82)#1,552 |
| 4. | 80204 | 4.4% | 2.4%(+1.99)#53 | 1.9%(+2.52)#1,782 |
| 5. | 80211 | 4.0% | 2.4%(+1.55)#63 | 1.9%(+2.08)#2,197 |
| 6. | 80202 | 3.9% | 2.4%(+1.46)#65 | 1.9%(+1.99)#2,293 |
| 7. | 80212 | 3.6% | 2.4%(+1.20)#82 | 1.9%(+1.73)#2,636 |
| 8. | 80247 | 3.4% | 2.4%(+0.986)#90 | 1.9%(+1.52)#3,010 |
| 9. | 80230 | 3.3% | 2.4%(+0.913)#94 | 1.9%(+1.44)#3,147 |
| 10. | 80205 | 3.3% | 2.4%(+0.885)#98 | 1.9%(+1.41)#3,194 |
| 11. | 80218 | 3.3% | 2.4%(+0.835)#100 | 1.9%(+1.36)#3,307 |
| 12. | 80206 | 3.1% | 2.4%(+0.666)#107 | 1.9%(+1.20)#3,655 |
| 13. | 80234 | 3.0% | 2.4%(+0.614)#113 | 1.9%(+1.14)#3,793 |
| 14. | 80220 | 2.9% | 2.4%(+0.505)#121 | 1.9%(+1.04)#4,089 |
| 15. | 80237 | 2.9% | 2.4%(+0.499)#122 | 1.9%(+1.03)#4,109 |
| 16. | 80222 | 2.8% | 2.4%(+0.404)#125 | 1.9%(+0.934)#4,365 |
| 17. | 80227 | 2.7% | 2.4%(+0.239)#142 | 1.9%(+0.769)#4,893 |
| 18. | 80216 | 2.7% | 2.4%(+0.237)#143 | 1.9%(+0.767)#4,903 |
| 19. | 80239 | 2.6% | 2.4%(+0.198)#149 | 1.9%(+0.728)#5,035 |
| 20. | 80207 | 2.6% | 2.4%(+0.175)#152 | 1.9%(+0.705)#5,116 |
| 21. | 80215 | 2.6% | 2.4%(+0.172)#153 | 1.9%(+0.703)#5,124 |
| 22. | 80203 | 2.5% | 2.4%(+0.116)#154 | 1.9%(+0.647)#5,334 |
| 23. | 80224 | 2.5% | 2.4%(+0.087)#155 | 1.9%(+0.617)#5,457 |
| 24. | 80226 | 2.3% | 2.4%(-0.116)#174 | 1.9%(+0.414)#6,283 |
| 25. | 80260 | 2.3% | 2.4%(-0.135)#177 | 1.9%(+0.396)#6,363 |
| 26. | 80228 | 2.1% | 2.4%(-0.349)#196 | 1.9%(+0.181)#7,457 |
| 27. | 80233 | 2.0% | 2.4%(-0.384)#202 | 1.9%(+0.147)#7,649 |
| 28. | 80236 | 2.0% | 2.4%(-0.388)#203 | 1.9%(+0.143)#7,665 |
| 29. | 80231 | 2.0% | 2.4%(-0.421)#204 | 1.9%(+0.109)#7,827 |
| 30. | 80219 | 2.0% | 2.4%(-0.426)#207 | 1.9%(+0.104)#7,867 |
| 31. | 80238 | 2.0% | 2.4%(-0.442)#209 | 1.9%(+0.089)#7,945 |
| 32. | 80232 | 1.9% | 2.4%(-0.475)#212 | 1.9%(+0.055)#8,140 |
| 33. | 80235 | 1.9% | 2.4%(-0.544)#221 | 1.9%(-0.014)#8,614 |
| 34. | 80229 | 1.7% | 2.4%(-0.705)#242 | 1.9%(-0.175)#9,647 |
| 35. | 80223 | 1.3% | 2.4%(-1.10)#280 | 1.9%(-0.565)#12,522 |
| 36. | 80214 | 1.3% | 2.4%(-1.13)#284 | 1.9%(-0.597)#12,761 |
| 37. | 80221 | 1.1% | 2.4%(-1.30)#299 | 1.9%(-0.767)#14,069 |
| 38. | 80249 | 0.94% | 2.4%(-1.48)#318 | 1.9%(-0.954)#15,658 |
1
Common Questions
What are the Top 10 Zip Codes with the Highest Percentage of Population Employed in Real Estate, Rental & Leasing in Denver, CO?
Top 10 Zip Codes with the Highest Percentage of Population Employed in Real Estate, Rental & Leasing in Denver, CO are:
What zip code has the Highest Percentage of Population Employed in Real Estate, Rental & Leasing in Denver, CO?
80209 has the Highest Percentage of Population Employed in Real Estate, Rental & Leasing in Denver, CO with 5.6%.
What is the Percentage of Population Employed in Real Estate, Rental & Leasing in Denver, CO?
Percentage of Population Employed in Real Estate, Rental & Leasing in Denver is 3.0%.
What is the Percentage of Population Employed in Real Estate, Rental & Leasing in Colorado?
Percentage of Population Employed in Real Estate, Rental & Leasing in Colorado is 2.4%.
What is the Percentage of Population Employed in Real Estate, Rental & Leasing in the United States?
Percentage of Population Employed in Real Estate, Rental & Leasing in the United States is 1.9%.