Zip Codes with the Highest Percentage of Population Employed in Community & Social Service in Denver, CO
RELATED REPORTS & OPTIONS
Community & Social Service
Denver
Compare Zip Codes
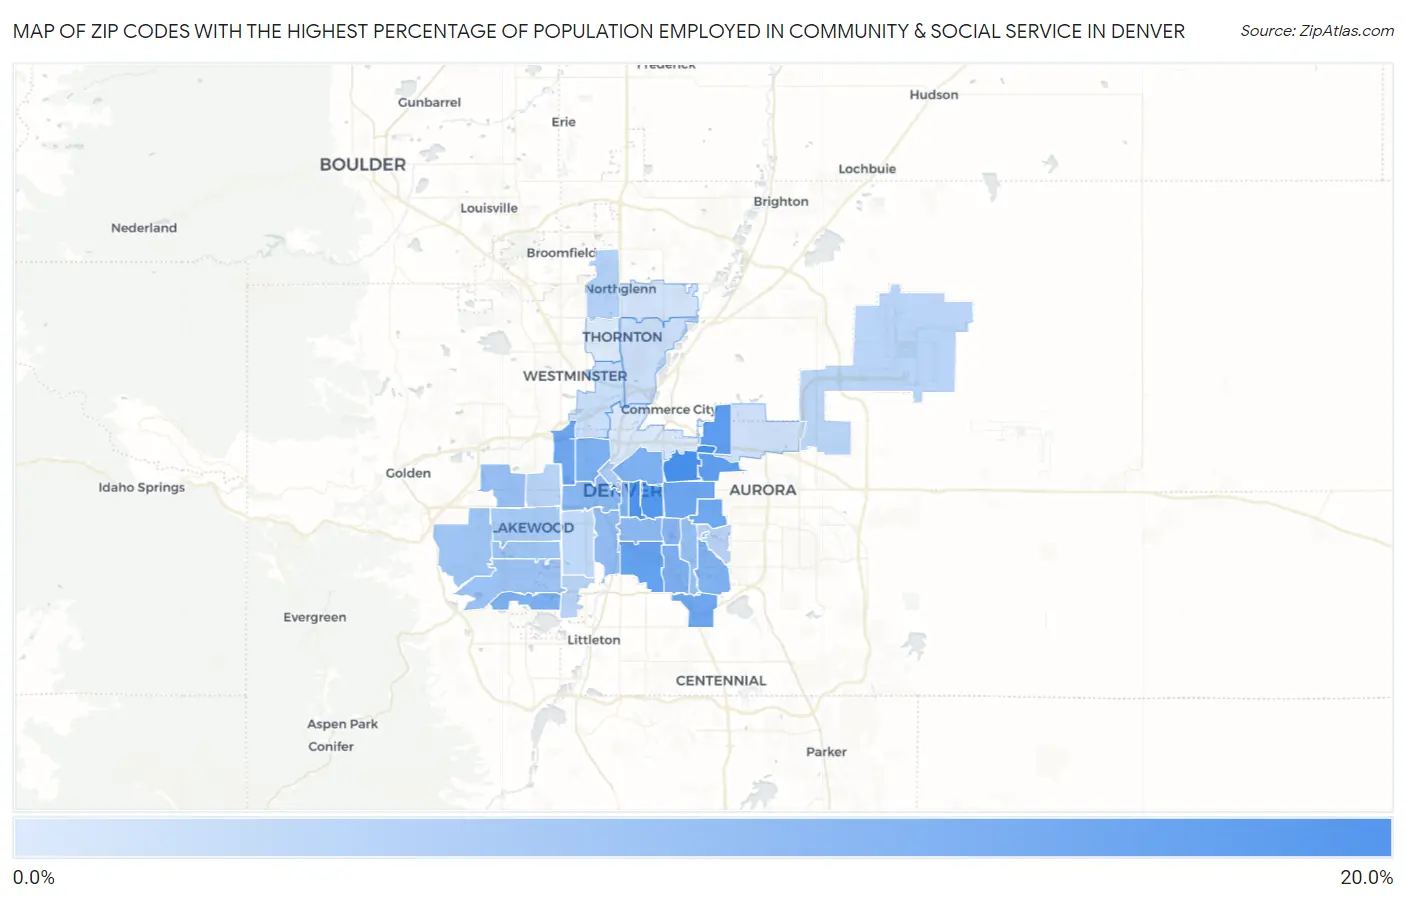
Map of Zip Codes with the Highest Percentage of Population Employed in Community & Social Service in Denver
5.2%
19.4%
Zip Codes with the Highest Percentage of Population Employed in Community & Social Service in Denver, CO
| Zip Code | % Employed | vs State | vs National | |
| 1. | 80207 | 19.4% | 11.2%(+8.18)#31 | 11.2%(+8.21)#2,228 |
| 2. | 80218 | 19.0% | 11.2%(+7.72)#36 | 11.2%(+7.75)#2,408 |
| 3. | 80206 | 18.2% | 11.2%(+6.93)#41 | 11.2%(+6.95)#2,739 |
| 4. | 80290 | 17.2% | 11.2%(+5.92)#47 | 11.2%(+5.95)#3,273 |
| 5. | 80238 | 17.0% | 11.2%(+5.80)#51 | 11.2%(+5.83)#3,353 |
| 6. | 80210 | 16.8% | 11.2%(+5.52)#61 | 11.2%(+5.55)#3,537 |
| 7. | 80220 | 15.8% | 11.2%(+4.58)#73 | 11.2%(+4.61)#4,217 |
| 8. | 80212 | 15.6% | 11.2%(+4.37)#77 | 11.2%(+4.40)#4,406 |
| 9. | 80230 | 15.5% | 11.2%(+4.31)#80 | 11.2%(+4.33)#4,453 |
| 10. | 80237 | 15.5% | 11.2%(+4.27)#82 | 11.2%(+4.30)#4,491 |
| 11. | 80235 | 14.2% | 11.2%(+2.96)#110 | 11.2%(+2.98)#5,835 |
| 12. | 80211 | 14.2% | 11.2%(+2.92)#111 | 11.2%(+2.94)#5,880 |
| 13. | 80205 | 14.1% | 11.2%(+2.88)#112 | 11.2%(+2.91)#5,941 |
| 14. | 80222 | 14.0% | 11.2%(+2.74)#115 | 11.2%(+2.76)#6,117 |
| 15. | 80203 | 13.8% | 11.2%(+2.53)#121 | 11.2%(+2.56)#6,383 |
| 16. | 80231 | 13.6% | 11.2%(+2.39)#126 | 11.2%(+2.41)#6,575 |
| 17. | 80246 | 13.3% | 11.2%(+2.06)#133 | 11.2%(+2.09)#7,073 |
| 18. | 80204 | 13.1% | 11.2%(+1.82)#138 | 11.2%(+1.85)#7,457 |
| 19. | 80209 | 12.7% | 11.2%(+1.49)#148 | 11.2%(+1.52)#8,010 |
| 20. | 80223 | 12.2% | 11.2%(+0.935)#161 | 11.2%(+0.961)#9,010 |
| 21. | 80224 | 11.7% | 11.2%(+0.454)#183 | 11.2%(+0.479)#10,016 |
| 22. | 80215 | 11.5% | 11.2%(+0.291)#189 | 11.2%(+0.317)#10,383 |
| 23. | 80227 | 11.1% | 11.2%(-0.172)#208 | 11.2%(-0.147)#11,468 |
| 24. | 80232 | 10.9% | 11.2%(-0.312)#212 | 11.2%(-0.286)#11,818 |
| 25. | 80228 | 10.8% | 11.2%(-0.426)#218 | 11.2%(-0.401)#12,086 |
| 26. | 80226 | 9.9% | 11.2%(-1.32)#256 | 11.2%(-1.29)#14,337 |
| 27. | 80202 | 9.9% | 11.2%(-1.33)#257 | 11.2%(-1.31)#14,375 |
| 28. | 80234 | 8.9% | 11.2%(-2.38)#297 | 11.2%(-2.35)#17,200 |
| 29. | 80247 | 8.6% | 11.2%(-2.65)#310 | 11.2%(-2.63)#17,932 |
| 30. | 80236 | 8.6% | 11.2%(-2.67)#311 | 11.2%(-2.64)#17,984 |
| 31. | 80214 | 8.6% | 11.2%(-2.68)#312 | 11.2%(-2.65)#18,003 |
| 32. | 80249 | 8.4% | 11.2%(-2.87)#322 | 11.2%(-2.84)#18,536 |
| 33. | 80219 | 7.9% | 11.2%(-3.33)#343 | 11.2%(-3.30)#19,838 |
| 34. | 80221 | 7.1% | 11.2%(-4.14)#361 | 11.2%(-4.11)#21,891 |
| 35. | 80229 | 6.8% | 11.2%(-4.41)#367 | 11.2%(-4.39)#22,563 |
| 36. | 80239 | 6.7% | 11.2%(-4.57)#373 | 11.2%(-4.55)#22,882 |
| 37. | 80233 | 6.2% | 11.2%(-5.00)#387 | 11.2%(-4.97)#23,862 |
| 38. | 80216 | 5.7% | 11.2%(-5.54)#401 | 11.2%(-5.51)#24,971 |
| 39. | 80260 | 5.2% | 11.2%(-6.04)#406 | 11.2%(-6.02)#25,868 |
1
Common Questions
What are the Top 10 Zip Codes with the Highest Percentage of Population Employed in Community & Social Service in Denver, CO?
Top 10 Zip Codes with the Highest Percentage of Population Employed in Community & Social Service in Denver, CO are:
What zip code has the Highest Percentage of Population Employed in Community & Social Service in Denver, CO?
80207 has the Highest Percentage of Population Employed in Community & Social Service in Denver, CO with 19.4%.
What is the Percentage of Population Employed in Community & Social Service in Denver, CO?
Percentage of Population Employed in Community & Social Service in Denver is 13.1%.
What is the Percentage of Population Employed in Community & Social Service in Colorado?
Percentage of Population Employed in Community & Social Service in Colorado is 11.2%.
What is the Percentage of Population Employed in Community & Social Service in the United States?
Percentage of Population Employed in Community & Social Service in the United States is 11.2%.