Zip Codes with the Highest Percentage of Population Employed in Professional & Scientific Services in Denver, CO
RELATED REPORTS & OPTIONS
Professional & Scientific Services
Denver
Compare Zip Codes
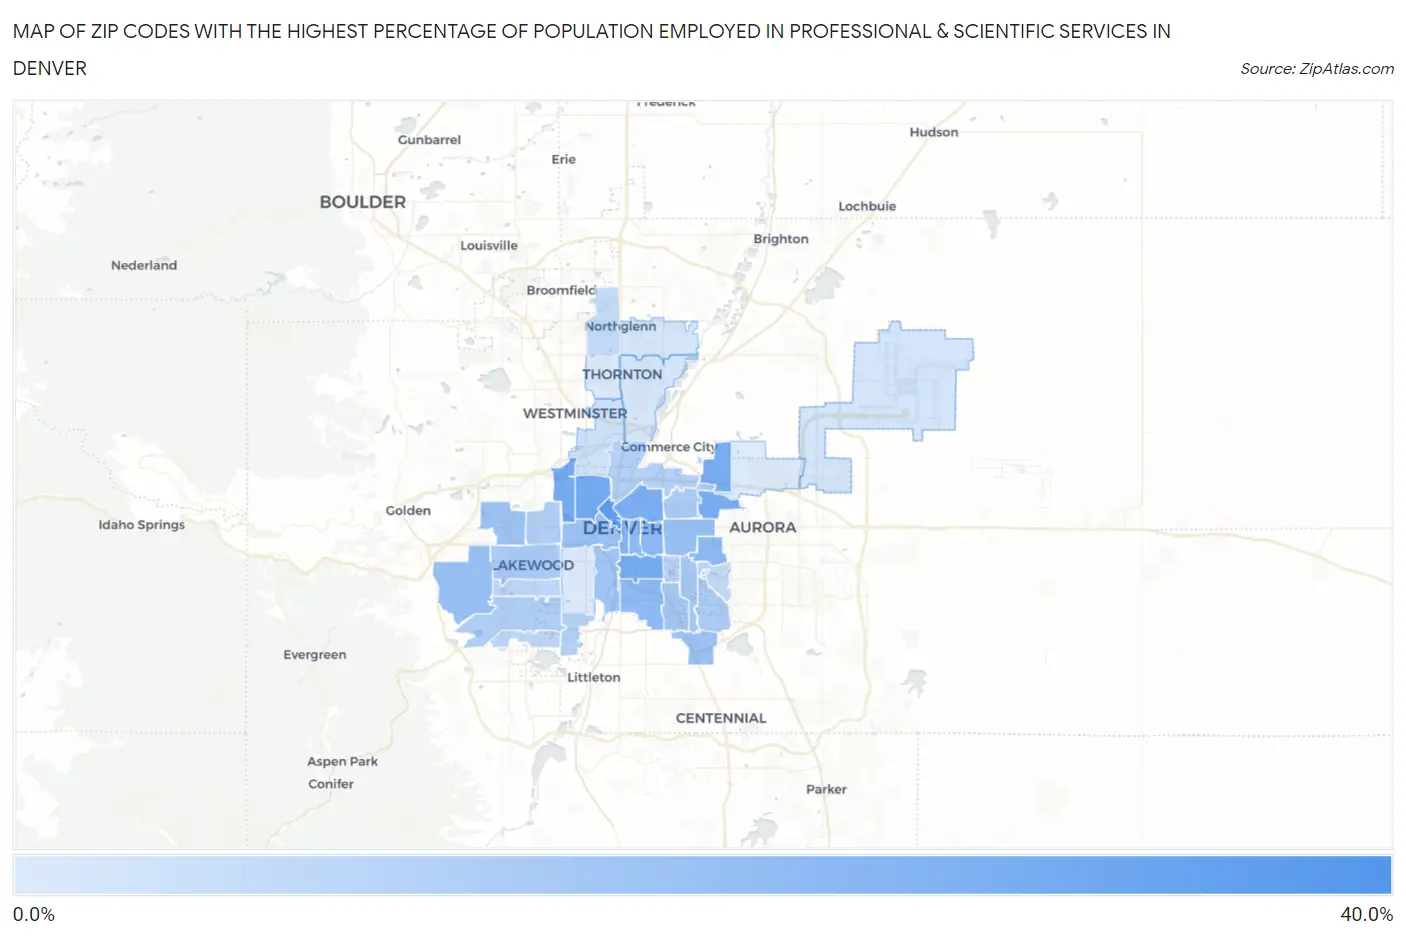
Map of Zip Codes with the Highest Percentage of Population Employed in Professional & Scientific Services in Denver
4.4%
31.1%
Zip Codes with the Highest Percentage of Population Employed in Professional & Scientific Services in Denver, CO
| Zip Code | % Employed | vs State | vs National | |
| 1. | 80290 | 31.1% | 10.6%(+20.4)#6 | 7.8%(+23.2)#200 |
| 2. | 80202 | 25.9% | 10.6%(+15.3)#8 | 7.8%(+18.1)#377 |
| 3. | 80211 | 22.8% | 10.6%(+12.1)#12 | 7.8%(+14.9)#595 |
| 4. | 80212 | 22.2% | 10.6%(+11.5)#14 | 7.8%(+14.3)#649 |
| 5. | 80209 | 21.7% | 10.6%(+11.1)#16 | 7.8%(+13.9)#699 |
| 6. | 80205 | 21.2% | 10.6%(+10.5)#17 | 7.8%(+13.3)#757 |
| 7. | 80238 | 21.1% | 10.6%(+10.5)#18 | 7.8%(+13.3)#760 |
| 8. | 80203 | 19.3% | 10.6%(+8.70)#22 | 7.8%(+11.5)#968 |
| 9. | 80206 | 18.2% | 10.6%(+7.61)#29 | 7.8%(+10.4)#1,116 |
| 10. | 80230 | 18.0% | 10.6%(+7.40)#31 | 7.8%(+10.2)#1,154 |
| 11. | 80218 | 17.8% | 10.6%(+7.13)#32 | 7.8%(+9.92)#1,195 |
| 12. | 80210 | 17.5% | 10.6%(+6.90)#36 | 7.8%(+9.69)#1,247 |
| 13. | 80228 | 16.0% | 10.6%(+5.40)#53 | 7.8%(+8.19)#1,601 |
| 14. | 80220 | 15.9% | 10.6%(+5.22)#55 | 7.8%(+8.00)#1,650 |
| 15. | 80237 | 15.4% | 10.6%(+4.74)#65 | 7.8%(+7.52)#1,785 |
| 16. | 80204 | 15.1% | 10.6%(+4.44)#67 | 7.8%(+7.22)#1,874 |
| 17. | 80215 | 14.6% | 10.6%(+3.96)#74 | 7.8%(+6.75)#2,056 |
| 18. | 80223 | 14.2% | 10.6%(+3.60)#77 | 7.8%(+6.39)#2,186 |
| 19. | 80224 | 13.4% | 10.6%(+2.73)#89 | 7.8%(+5.51)#2,558 |
| 20. | 80222 | 13.3% | 10.6%(+2.71)#90 | 7.8%(+5.49)#2,565 |
| 21. | 80207 | 12.9% | 10.6%(+2.23)#95 | 7.8%(+5.01)#2,767 |
| 22. | 80226 | 12.6% | 10.6%(+1.93)#100 | 7.8%(+4.72)#2,908 |
| 23. | 80231 | 12.2% | 10.6%(+1.52)#107 | 7.8%(+4.31)#3,112 |
| 24. | 80214 | 11.5% | 10.6%(+0.859)#121 | 7.8%(+3.64)#3,514 |
| 25. | 80227 | 11.4% | 10.6%(+0.742)#124 | 7.8%(+3.53)#3,590 |
| 26. | 80216 | 11.2% | 10.6%(+0.610)#128 | 7.8%(+3.39)#3,674 |
| 27. | 80236 | 10.6% | 10.6%(+0.011)#139 | 7.8%(+2.79)#4,070 |
| 28. | 80246 | 10.4% | 10.6%(-0.247)#147 | 7.8%(+2.54)#4,292 |
| 29. | 80235 | 9.8% | 10.6%(-0.858)#161 | 7.8%(+1.93)#4,766 |
| 30. | 80232 | 9.4% | 10.6%(-1.24)#168 | 7.8%(+1.55)#5,100 |
| 31. | 80234 | 8.5% | 10.6%(-2.16)#188 | 7.8%(+0.621)#6,059 |
| 32. | 80247 | 8.4% | 10.6%(-2.22)#190 | 7.8%(+0.559)#6,127 |
| 33. | 80221 | 6.5% | 10.6%(-4.10)#239 | 7.8%(-1.32)#8,989 |
| 34. | 80249 | 6.0% | 10.6%(-4.64)#256 | 7.8%(-1.85)#9,988 |
| 35. | 80229 | 5.5% | 10.6%(-5.12)#274 | 7.8%(-2.33)#11,063 |
| 36. | 80233 | 5.4% | 10.6%(-5.19)#278 | 7.8%(-2.41)#11,222 |
| 37. | 80219 | 4.8% | 10.6%(-5.87)#297 | 7.8%(-3.08)#12,928 |
| 38. | 80260 | 4.5% | 10.6%(-6.13)#303 | 7.8%(-3.35)#13,679 |
| 39. | 80239 | 4.4% | 10.6%(-6.26)#311 | 7.8%(-3.47)#14,025 |
1
Common Questions
What are the Top 10 Zip Codes with the Highest Percentage of Population Employed in Professional & Scientific Services in Denver, CO?
Top 10 Zip Codes with the Highest Percentage of Population Employed in Professional & Scientific Services in Denver, CO are:
What zip code has the Highest Percentage of Population Employed in Professional & Scientific Services in Denver, CO?
80290 has the Highest Percentage of Population Employed in Professional & Scientific Services in Denver, CO with 31.1%.
What is the Percentage of Population Employed in Professional & Scientific Services in Denver, CO?
Percentage of Population Employed in Professional & Scientific Services in Denver is 14.9%.
What is the Percentage of Population Employed in Professional & Scientific Services in Colorado?
Percentage of Population Employed in Professional & Scientific Services in Colorado is 10.6%.
What is the Percentage of Population Employed in Professional & Scientific Services in the United States?
Percentage of Population Employed in Professional & Scientific Services in the United States is 7.8%.