Zip Codes with the Highest Percentage of Population Employed in Farming, Fishing & Forestry in Denver, CO
RELATED REPORTS & OPTIONS
Farming, Fishing & Forestry
Denver
Compare Zip Codes
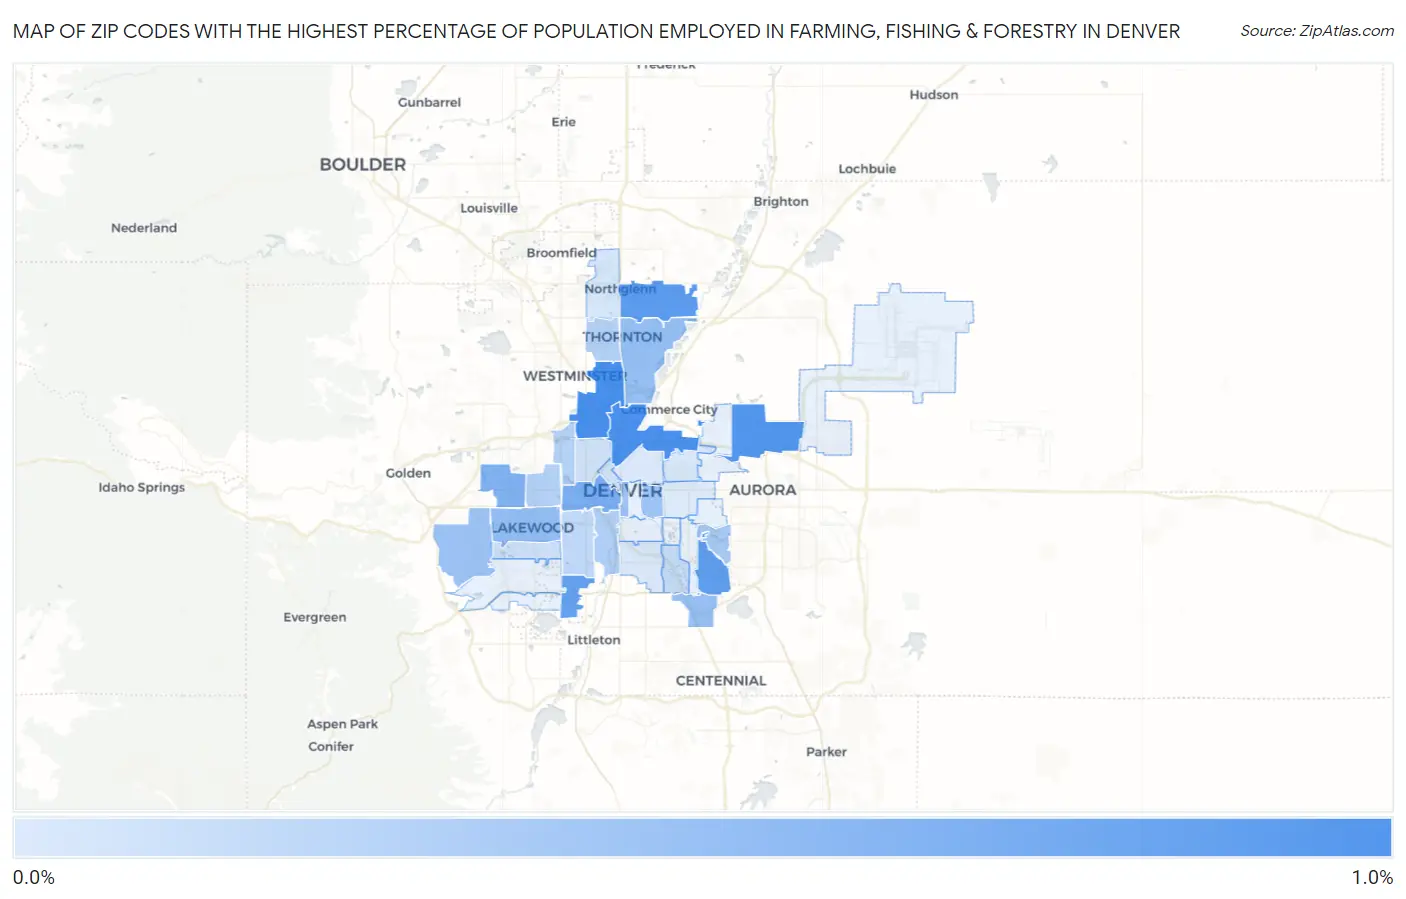
Map of Zip Codes with the Highest Percentage of Population Employed in Farming, Fishing & Forestry in Denver
0.038%
0.92%
Zip Codes with the Highest Percentage of Population Employed in Farming, Fishing & Forestry in Denver, CO
| Zip Code | % Employed | vs State | vs National | |
| 1. | 80221 | 0.92% | 0.49%(+0.435)#161 | 0.61%(+0.316)#10,117 |
| 2. | 80216 | 0.91% | 0.49%(+0.423)#162 | 0.61%(+0.304)#10,180 |
| 3. | 80239 | 0.86% | 0.49%(+0.371)#164 | 0.61%(+0.253)#10,464 |
| 4. | 80233 | 0.79% | 0.49%(+0.306)#171 | 0.61%(+0.188)#10,826 |
| 5. | 80231 | 0.77% | 0.49%(+0.286)#172 | 0.61%(+0.167)#10,951 |
| 6. | 80236 | 0.74% | 0.49%(+0.257)#174 | 0.61%(+0.139)#11,106 |
| 7. | 80204 | 0.62% | 0.49%(+0.133)#182 | 0.61%(+0.015)#11,884 |
| 8. | 80215 | 0.58% | 0.49%(+0.095)#186 | 0.61%(-0.023)#12,189 |
| 9. | 80226 | 0.48% | 0.49%(-0.009)#207 | 0.61%(-0.127)#13,042 |
| 10. | 80229 | 0.45% | 0.49%(-0.034)#210 | 0.61%(-0.153)#13,259 |
| 11. | 80237 | 0.44% | 0.49%(-0.048)#216 | 0.61%(-0.166)#13,391 |
| 12. | 80228 | 0.43% | 0.49%(-0.054)#217 | 0.61%(-0.172)#13,462 |
| 13. | 80203 | 0.41% | 0.49%(-0.082)#221 | 0.61%(-0.200)#13,702 |
| 14. | 80206 | 0.40% | 0.49%(-0.088)#224 | 0.61%(-0.206)#13,759 |
| 15. | 80247 | 0.35% | 0.49%(-0.133)#232 | 0.61%(-0.251)#14,212 |
| 16. | 80223 | 0.30% | 0.49%(-0.187)#243 | 0.61%(-0.305)#14,823 |
| 17. | 80260 | 0.28% | 0.49%(-0.205)#247 | 0.61%(-0.323)#15,039 |
| 18. | 80214 | 0.28% | 0.49%(-0.205)#248 | 0.61%(-0.323)#15,040 |
| 19. | 80212 | 0.27% | 0.49%(-0.212)#250 | 0.61%(-0.331)#15,117 |
| 20. | 80219 | 0.21% | 0.49%(-0.279)#268 | 0.61%(-0.397)#16,009 |
| 21. | 80222 | 0.17% | 0.49%(-0.319)#276 | 0.61%(-0.438)#16,613 |
| 22. | 80232 | 0.14% | 0.49%(-0.349)#292 | 0.61%(-0.467)#17,131 |
| 23. | 80211 | 0.12% | 0.49%(-0.367)#296 | 0.61%(-0.485)#17,418 |
| 24. | 80202 | 0.12% | 0.49%(-0.371)#297 | 0.61%(-0.489)#17,487 |
| 25. | 80234 | 0.077% | 0.49%(-0.410)#304 | 0.61%(-0.528)#18,172 |
| 26. | 80207 | 0.067% | 0.49%(-0.420)#308 | 0.61%(-0.539)#18,353 |
| 27. | 80210 | 0.058% | 0.49%(-0.429)#309 | 0.61%(-0.547)#18,510 |
| 28. | 80205 | 0.052% | 0.49%(-0.436)#313 | 0.61%(-0.554)#18,634 |
| 29. | 80220 | 0.038% | 0.49%(-0.450)#316 | 0.61%(-0.568)#18,850 |
1
Common Questions
What are the Top 10 Zip Codes with the Highest Percentage of Population Employed in Farming, Fishing & Forestry in Denver, CO?
Top 10 Zip Codes with the Highest Percentage of Population Employed in Farming, Fishing & Forestry in Denver, CO are:
What zip code has the Highest Percentage of Population Employed in Farming, Fishing & Forestry in Denver, CO?
80221 has the Highest Percentage of Population Employed in Farming, Fishing & Forestry in Denver, CO with 0.92%.
What is the Percentage of Population Employed in Farming, Fishing & Forestry in Denver, CO?
Percentage of Population Employed in Farming, Fishing & Forestry in Denver is 0.24%.
What is the Percentage of Population Employed in Farming, Fishing & Forestry in Colorado?
Percentage of Population Employed in Farming, Fishing & Forestry in Colorado is 0.49%.
What is the Percentage of Population Employed in Farming, Fishing & Forestry in the United States?
Percentage of Population Employed in Farming, Fishing & Forestry in the United States is 0.61%.