Zip Codes with the Highest Percentage of Population Employed in Cleaning & Maintenance in Denver, CO
RELATED REPORTS & OPTIONS
Cleaning & Maintenance
Denver
Compare Zip Codes
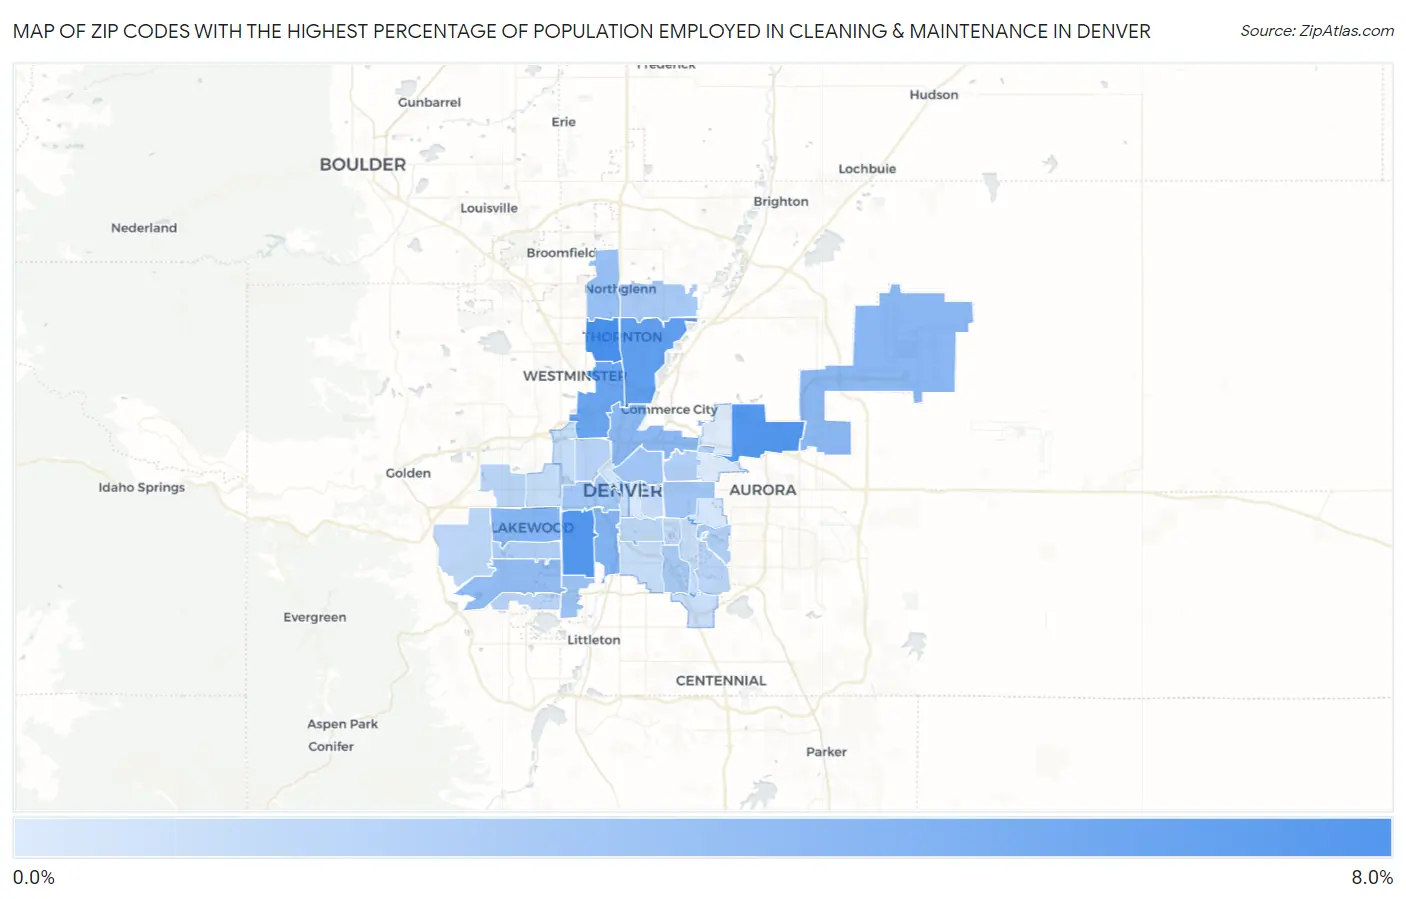
Map of Zip Codes with the Highest Percentage of Population Employed in Cleaning & Maintenance in Denver
0.14%
7.1%
Zip Codes with the Highest Percentage of Population Employed in Cleaning & Maintenance in Denver, CO
| Zip Code | % Employed | vs State | vs National | |
| 1. | 80260 | 7.1% | 2.9%(+4.23)#46 | 3.5%(+3.64)#3,937 |
| 2. | 80219 | 6.6% | 2.9%(+3.69)#63 | 3.5%(+3.10)#4,651 |
| 3. | 80239 | 6.5% | 2.9%(+3.64)#64 | 3.5%(+3.05)#4,715 |
| 4. | 80229 | 5.9% | 2.9%(+3.04)#78 | 3.5%(+2.45)#5,795 |
| 5. | 80221 | 5.4% | 2.9%(+2.55)#90 | 3.5%(+1.96)#6,829 |
| 6. | 80223 | 4.4% | 2.9%(+1.47)#128 | 3.5%(+0.876)#9,956 |
| 7. | 80226 | 4.1% | 2.9%(+1.26)#146 | 3.5%(+0.667)#10,743 |
| 8. | 80216 | 4.0% | 2.9%(+1.10)#155 | 3.5%(+0.510)#11,385 |
| 9. | 80249 | 3.9% | 2.9%(+1.04)#157 | 3.5%(+0.450)#11,591 |
| 10. | 80227 | 3.6% | 2.9%(+0.727)#168 | 3.5%(+0.137)#12,890 |
| 11. | 80234 | 3.4% | 2.9%(+0.463)#181 | 3.5%(-0.126)#14,087 |
| 12. | 80236 | 3.2% | 2.9%(+0.257)#201 | 3.5%(-0.332)#15,128 |
| 13. | 80220 | 2.9% | 2.9%(+0.020)#208 | 3.5%(-0.569)#16,348 |
| 14. | 80205 | 2.9% | 2.9%(-0.018)#214 | 3.5%(-0.607)#16,544 |
| 15. | 80204 | 2.8% | 2.9%(-0.113)#219 | 3.5%(-0.702)#17,022 |
| 16. | 80233 | 2.7% | 2.9%(-0.190)#226 | 3.5%(-0.779)#17,426 |
| 17. | 80222 | 2.6% | 2.9%(-0.326)#237 | 3.5%(-0.916)#18,144 |
| 18. | 80232 | 2.3% | 2.9%(-0.631)#259 | 3.5%(-1.22)#19,722 |
| 19. | 80247 | 2.2% | 2.9%(-0.736)#267 | 3.5%(-1.32)#20,293 |
| 20. | 80207 | 2.1% | 2.9%(-0.773)#270 | 3.5%(-1.36)#20,476 |
| 21. | 80235 | 1.8% | 2.9%(-1.10)#294 | 3.5%(-1.69)#22,086 |
| 22. | 80211 | 1.8% | 2.9%(-1.11)#298 | 3.5%(-1.70)#22,180 |
| 23. | 80215 | 1.7% | 2.9%(-1.15)#302 | 3.5%(-1.74)#22,328 |
| 24. | 80231 | 1.7% | 2.9%(-1.20)#306 | 3.5%(-1.79)#22,555 |
| 25. | 80209 | 1.6% | 2.9%(-1.28)#311 | 3.5%(-1.87)#22,945 |
| 26. | 80228 | 1.6% | 2.9%(-1.29)#313 | 3.5%(-1.88)#22,993 |
| 27. | 80246 | 1.4% | 2.9%(-1.54)#326 | 3.5%(-2.13)#24,140 |
| 28. | 80206 | 1.3% | 2.9%(-1.58)#331 | 3.5%(-2.17)#24,331 |
| 29. | 80214 | 1.2% | 2.9%(-1.68)#336 | 3.5%(-2.27)#24,736 |
| 30. | 80212 | 1.2% | 2.9%(-1.69)#338 | 3.5%(-2.28)#24,773 |
| 31. | 80210 | 1.1% | 2.9%(-1.75)#343 | 3.5%(-2.34)#24,979 |
| 32. | 80224 | 1.1% | 2.9%(-1.76)#344 | 3.5%(-2.35)#25,024 |
| 33. | 80203 | 1.1% | 2.9%(-1.79)#347 | 3.5%(-2.38)#25,155 |
| 34. | 80237 | 1.0% | 2.9%(-1.85)#353 | 3.5%(-2.44)#25,373 |
| 35. | 80230 | 0.60% | 2.9%(-2.30)#380 | 3.5%(-2.89)#26,730 |
| 36. | 80202 | 0.57% | 2.9%(-2.33)#383 | 3.5%(-2.91)#26,814 |
| 37. | 80218 | 0.40% | 2.9%(-2.50)#392 | 3.5%(-3.09)#27,208 |
| 38. | 80238 | 0.14% | 2.9%(-2.75)#396 | 3.5%(-3.34)#27,552 |
1
Common Questions
What are the Top 10 Zip Codes with the Highest Percentage of Population Employed in Cleaning & Maintenance in Denver, CO?
Top 10 Zip Codes with the Highest Percentage of Population Employed in Cleaning & Maintenance in Denver, CO are:
What zip code has the Highest Percentage of Population Employed in Cleaning & Maintenance in Denver, CO?
80260 has the Highest Percentage of Population Employed in Cleaning & Maintenance in Denver, CO with 7.1%.
What is the Percentage of Population Employed in Cleaning & Maintenance in Denver, CO?
Percentage of Population Employed in Cleaning & Maintenance in Denver is 2.7%.
What is the Percentage of Population Employed in Cleaning & Maintenance in Colorado?
Percentage of Population Employed in Cleaning & Maintenance in Colorado is 2.9%.
What is the Percentage of Population Employed in Cleaning & Maintenance in the United States?
Percentage of Population Employed in Cleaning & Maintenance in the United States is 3.5%.