Zip Codes with the Highest Percentage of Households Heated by Bottled Gas / Liquid Propane in Denver, CO
RELATED REPORTS & OPTIONS
Bottled Gas / LP Heating
Denver
Compare Zip Codes
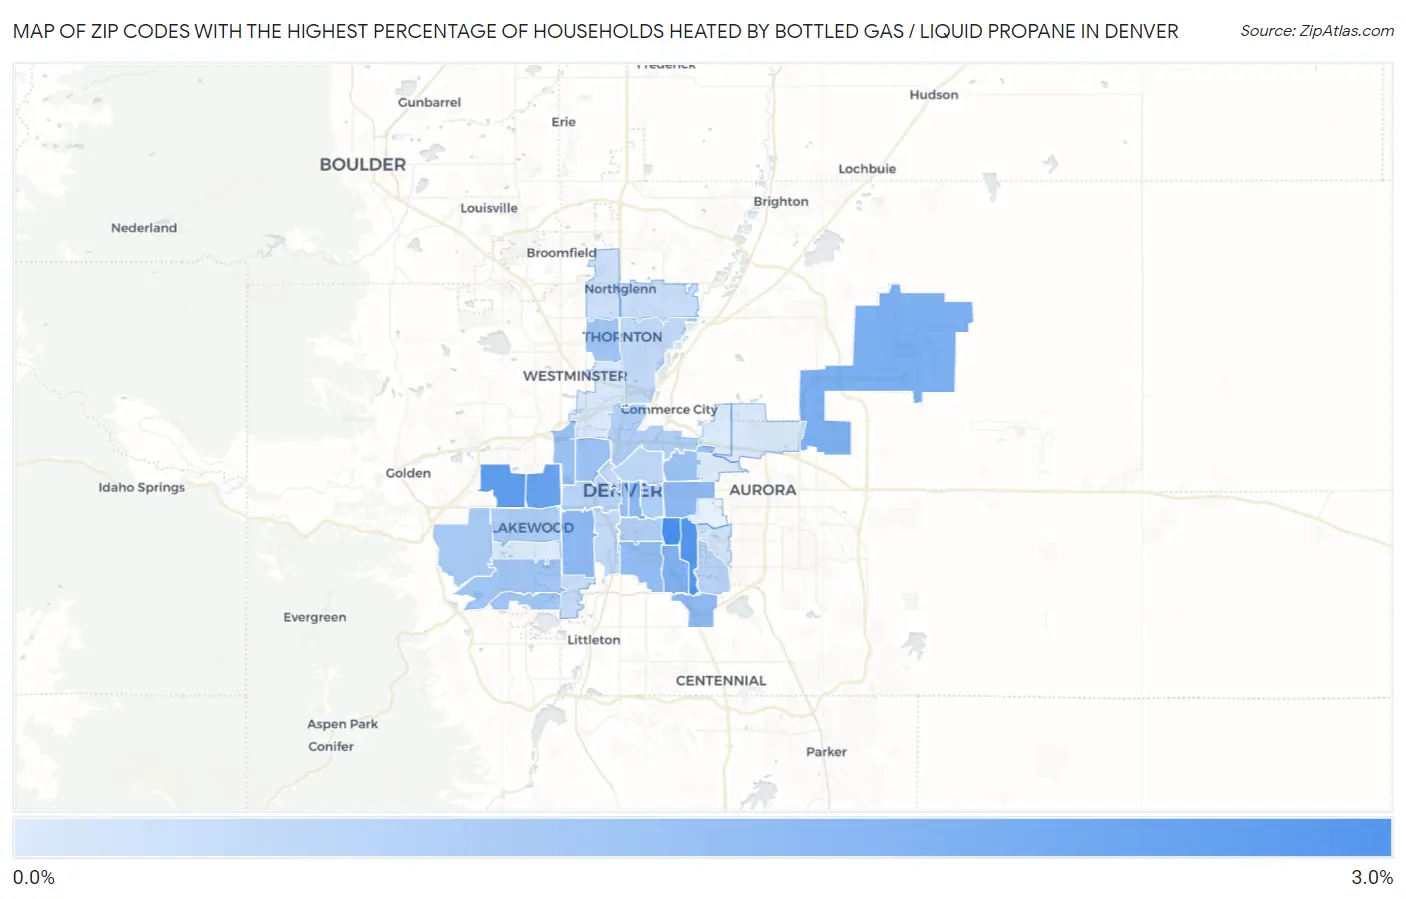
Map of Zip Codes with the Highest Percentage of Households Heated by Bottled Gas / Liquid Propane in Denver
0.20%
3.0%
Zip Codes with the Highest Percentage of Households Heated by Bottled Gas / Liquid Propane in Denver, CO
| Zip Code | Bottled Gas / LP Heating | vs State | vs National | |
| 1. | 80246 | 3.0% | 4.8%(-1.80)#326 | 4.9%(-1.90)#21,064 |
| 2. | 80224 | 2.8% | 4.8%(-2.00)#329 | 4.9%(-2.10)#21,394 |
| 3. | 80215 | 2.5% | 4.8%(-2.30)#338 | 4.9%(-2.40)#21,980 |
| 4. | 80214 | 2.4% | 4.8%(-2.40)#342 | 4.9%(-2.50)#22,173 |
| 5. | 80249 | 2.0% | 4.8%(-2.80)#356 | 4.9%(-2.90)#23,137 |
| 6. | 80222 | 1.9% | 4.8%(-2.90)#360 | 4.9%(-3.00)#23,492 |
| 7. | 80218 | 1.8% | 4.8%(-3.00)#363 | 4.9%(-3.10)#23,803 |
| 8. | 80219 | 1.7% | 4.8%(-3.10)#364 | 4.9%(-3.20)#23,934 |
| 9. | 80220 | 1.7% | 4.8%(-3.10)#365 | 4.9%(-3.20)#24,003 |
| 10. | 80237 | 1.7% | 4.8%(-3.10)#369 | 4.9%(-3.20)#24,079 |
| 11. | 80210 | 1.6% | 4.8%(-3.20)#372 | 4.9%(-3.30)#24,335 |
| 12. | 80211 | 1.4% | 4.8%(-3.40)#383 | 4.9%(-3.50)#25,058 |
| 13. | 80207 | 1.4% | 4.8%(-3.40)#387 | 4.9%(-3.50)#25,149 |
| 14. | 80203 | 1.4% | 4.8%(-3.40)#388 | 4.9%(-3.50)#25,161 |
| 15. | 80212 | 1.4% | 4.8%(-3.40)#389 | 4.9%(-3.50)#25,172 |
| 16. | 80260 | 1.3% | 4.8%(-3.50)#396 | 4.9%(-3.60)#25,423 |
| 17. | 80227 | 1.3% | 4.8%(-3.50)#397 | 4.9%(-3.60)#25,424 |
| 18. | 80235 | 1.3% | 4.8%(-3.50)#404 | 4.9%(-3.60)#25,643 |
| 19. | 80228 | 1.2% | 4.8%(-3.60)#407 | 4.9%(-3.70)#25,828 |
| 20. | 80226 | 1.1% | 4.8%(-3.70)#417 | 4.9%(-3.80)#26,238 |
| 21. | 80206 | 1.1% | 4.8%(-3.70)#418 | 4.9%(-3.80)#26,297 |
| 22. | 80209 | 1.0% | 4.8%(-3.80)#427 | 4.9%(-3.90)#26,706 |
| 23. | 80216 | 1.0% | 4.8%(-3.80)#428 | 4.9%(-3.90)#26,795 |
| 24. | 80204 | 0.90% | 4.8%(-3.90)#437 | 4.9%(-4.00)#27,054 |
| 25. | 80231 | 0.90% | 4.8%(-3.90)#438 | 4.9%(-4.00)#27,056 |
| 26. | 80205 | 0.80% | 4.8%(-4.00)#441 | 4.9%(-4.10)#27,447 |
| 27. | 80229 | 0.70% | 4.8%(-4.10)#447 | 4.9%(-4.20)#27,749 |
| 28. | 80223 | 0.70% | 4.8%(-4.10)#455 | 4.9%(-4.20)#27,945 |
| 29. | 80202 | 0.70% | 4.8%(-4.10)#456 | 4.9%(-4.20)#27,960 |
| 30. | 80233 | 0.60% | 4.8%(-4.20)#458 | 4.9%(-4.30)#28,135 |
| 31. | 80236 | 0.60% | 4.8%(-4.20)#462 | 4.9%(-4.30)#28,346 |
| 32. | 80234 | 0.50% | 4.8%(-4.30)#464 | 4.9%(-4.40)#28,578 |
| 33. | 80247 | 0.40% | 4.8%(-4.40)#468 | 4.9%(-4.50)#28,898 |
| 34. | 80239 | 0.30% | 4.8%(-4.50)#471 | 4.9%(-4.60)#29,099 |
| 35. | 80221 | 0.30% | 4.8%(-4.50)#472 | 4.9%(-4.60)#29,107 |
| 36. | 80238 | 0.20% | 4.8%(-4.60)#475 | 4.9%(-4.70)#29,377 |
| 37. | 80232 | 0.20% | 4.8%(-4.60)#476 | 4.9%(-4.70)#29,408 |
1
Common Questions
What are the Top 10 Zip Codes with the Highest Percentage of Households Heated by Bottled Gas / Liquid Propane in Denver, CO?
Top 10 Zip Codes with the Highest Percentage of Households Heated by Bottled Gas / Liquid Propane in Denver, CO are:
What zip code has the Highest Percentage of Households Heated by Bottled Gas / Liquid Propane in Denver, CO?
80246 has the Highest Percentage of Households Heated by Bottled Gas / Liquid Propane in Denver, CO with 3.0%.
What is the Percentage of Households Heated by Bottled Gas / Liquid Propane in Denver, CO?
Percentage of Households Heated by Bottled Gas / Liquid Propane in Denver is 1.3%.
What is the Percentage of Households Heated by Bottled Gas / Liquid Propane in Colorado?
Percentage of Households Heated by Bottled Gas / Liquid Propane in Colorado is 4.8%.
What is the Percentage of Households Heated by Bottled Gas / Liquid Propane in the United States?
Percentage of Households Heated by Bottled Gas / Liquid Propane in the United States is 4.9%.