Zip Codes with the Highest Percentage of Population Employed in Community & Social Service in Alaska
RELATED REPORTS & OPTIONS
Community & Social Service
Alaska
Compare Zip Codes
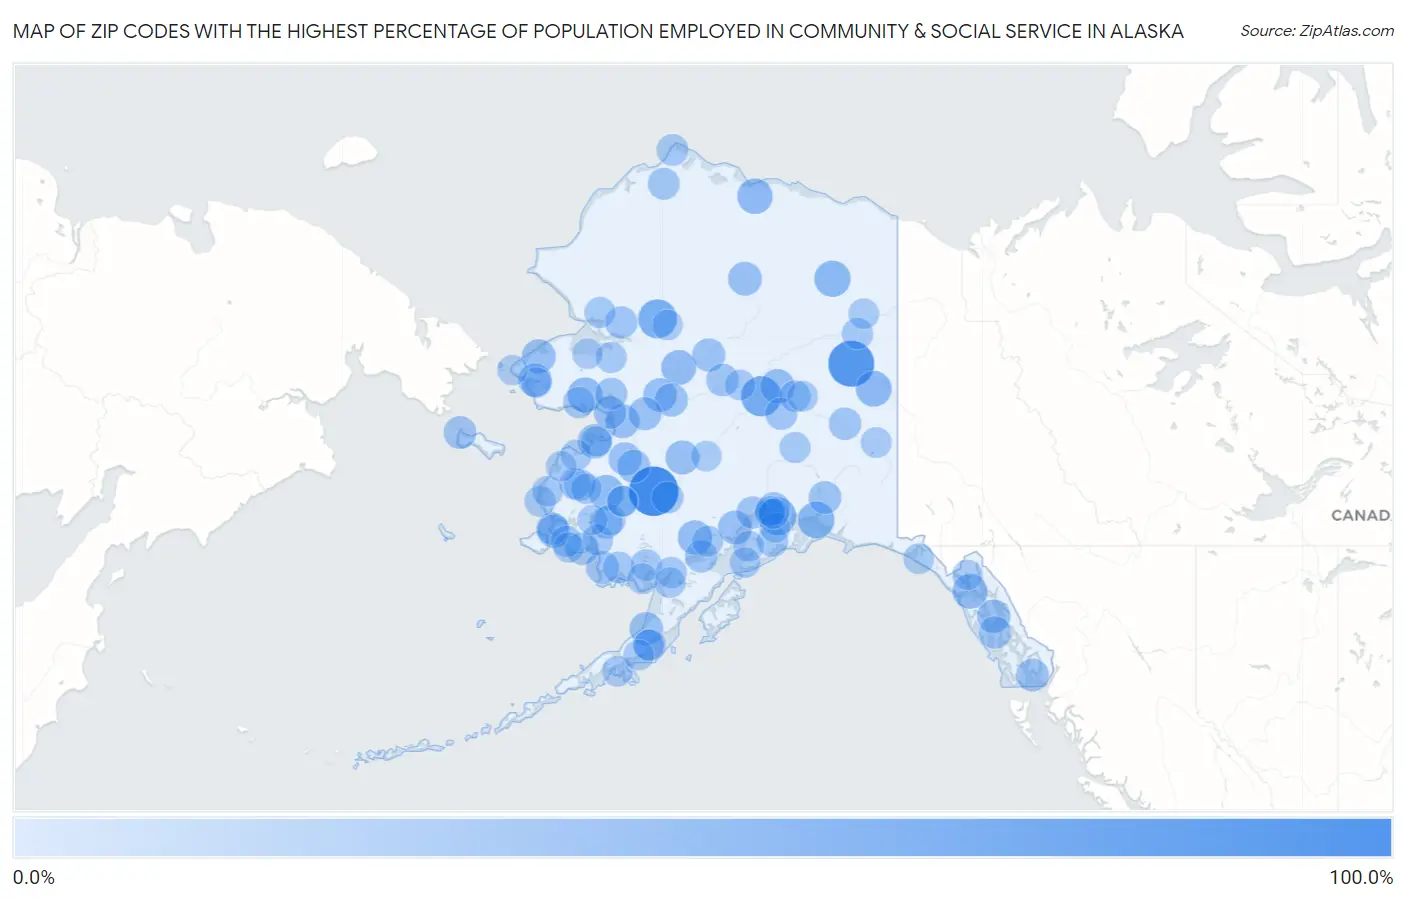
Map of Zip Codes with the Highest Percentage of Population Employed in Community & Social Service in Alaska
0.0%
100.0%
Zip Codes with the Highest Percentage of Population Employed in Community & Social Service in Alaska
| Zip Code | % Employed | vs State | vs National | |
| 1. | 99575 | 100.0% | 11.3%(+88.7)#1 | 11.2%(+88.8)#19 |
| 2. | 99733 | 83.3% | 11.3%(+72.0)#2 | 11.2%(+72.1)#36 |
| 3. | 99756 | 57.1% | 11.3%(+45.8)#3 | 11.2%(+45.9)#99 |
| 4. | 99786 | 50.7% | 11.3%(+39.4)#4 | 11.2%(+39.5)#151 |
| 5. | 99540 | 45.3% | 11.3%(+34.0)#5 | 11.2%(+34.1)#220 |
| 6. | 99677 | 40.0% | 11.3%(+28.7)#6 | 11.2%(+28.8)#290 |
| 7. | 99722 | 38.9% | 11.3%(+27.6)#7 | 11.2%(+27.7)#303 |
| 8. | 99738 | 37.1% | 11.3%(+25.8)#8 | 11.2%(+25.9)#349 |
| 9. | 99789 | 35.1% | 11.3%(+23.7)#9 | 11.2%(+23.8)#391 |
| 10. | 99739 | 33.3% | 11.3%(+22.0)#10 | 11.2%(+22.1)#433 |
| 11. | 99657 | 33.3% | 11.3%(+22.0)#11 | 11.2%(+22.1)#441 |
| 12. | 99826 | 33.2% | 11.3%(+21.9)#12 | 11.2%(+22.0)#446 |
| 13. | 99746 | 32.8% | 11.3%(+21.4)#13 | 11.2%(+21.5)#459 |
| 14. | 99758 | 30.8% | 11.3%(+19.4)#14 | 11.2%(+19.6)#550 |
| 15. | 99671 | 30.6% | 11.3%(+19.2)#15 | 11.2%(+19.4)#558 |
| 16. | 99640 | 30.4% | 11.3%(+19.1)#16 | 11.2%(+19.2)#566 |
| 17. | 99684 | 29.0% | 11.3%(+17.6)#17 | 11.2%(+17.8)#634 |
| 18. | 99772 | 28.8% | 11.3%(+17.4)#18 | 11.2%(+17.6)#645 |
| 19. | 99635 | 28.7% | 11.3%(+17.4)#19 | 11.2%(+17.5)#654 |
| 20. | 99675 | 28.6% | 11.3%(+17.2)#20 | 11.2%(+17.4)#662 |
| 21. | 99721 | 28.1% | 11.3%(+16.7)#21 | 11.2%(+16.9)#686 |
| 22. | 99785 | 27.2% | 11.3%(+15.8)#22 | 11.2%(+15.9)#754 |
| 23. | 99754 | 26.8% | 11.3%(+15.5)#23 | 11.2%(+15.6)#795 |
| 24. | 99549 | 26.3% | 11.3%(+15.0)#24 | 11.2%(+15.1)#836 |
| 25. | 99820 | 26.1% | 11.3%(+14.8)#25 | 11.2%(+14.9)#858 |
| 26. | 99741 | 25.9% | 11.3%(+14.6)#26 | 11.2%(+14.7)#879 |
| 27. | 99590 | 25.4% | 11.3%(+14.1)#27 | 11.2%(+14.2)#930 |
| 28. | 99748 | 25.2% | 11.3%(+13.9)#28 | 11.2%(+14.0)#944 |
| 29. | 99637 | 25.0% | 11.3%(+13.7)#29 | 11.2%(+13.8)#974 |
| 30. | 99665 | 25.0% | 11.3%(+13.7)#30 | 11.2%(+13.8)#980 |
| 31. | 99745 | 25.0% | 11.3%(+13.7)#31 | 11.2%(+13.8)#984 |
| 32. | 99505 | 24.4% | 11.3%(+13.1)#32 | 11.2%(+13.2)#1,051 |
| 33. | 99589 | 23.9% | 11.3%(+12.6)#33 | 11.2%(+12.7)#1,119 |
| 34. | 99926 | 23.5% | 11.3%(+12.2)#34 | 11.2%(+12.3)#1,182 |
| 35. | 99742 | 23.4% | 11.3%(+12.1)#35 | 11.2%(+12.2)#1,216 |
| 36. | 99573 | 23.0% | 11.3%(+11.7)#36 | 11.2%(+11.8)#1,277 |
| 37. | 99768 | 22.8% | 11.3%(+11.5)#37 | 11.2%(+11.6)#1,314 |
| 38. | 99771 | 22.5% | 11.3%(+11.2)#38 | 11.2%(+11.3)#1,366 |
| 39. | 99622 | 22.4% | 11.3%(+11.1)#39 | 11.2%(+11.2)#1,386 |
| 40. | 99830 | 22.3% | 11.3%(+11.0)#40 | 11.2%(+11.1)#1,402 |
| 41. | 99706 | 22.2% | 11.3%(+10.9)#41 | 11.2%(+11.0)#1,429 |
| 42. | 99606 | 22.1% | 11.3%(+10.8)#42 | 11.2%(+10.9)#1,453 |
| 43. | 99749 | 21.3% | 11.3%(+9.97)#43 | 11.2%(+10.1)#1,634 |
| 44. | 99744 | 21.3% | 11.3%(+9.95)#44 | 11.2%(+10.1)#1,642 |
| 45. | 99682 | 21.1% | 11.3%(+9.77)#45 | 11.2%(+9.88)#1,688 |
| 46. | 99681 | 20.4% | 11.3%(+9.11)#46 | 11.2%(+9.22)#1,894 |
| 47. | 99621 | 20.4% | 11.3%(+9.07)#47 | 11.2%(+9.18)#1,909 |
| 48. | 99753 | 20.0% | 11.3%(+8.67)#48 | 11.2%(+8.79)#2,016 |
| 49. | 99668 | 20.0% | 11.3%(+8.67)#49 | 11.2%(+8.79)#2,026 |
| 50. | 99564 | 20.0% | 11.3%(+8.67)#50 | 11.2%(+8.79)#2,030 |
| 51. | 99791 | 19.6% | 11.3%(+8.24)#51 | 11.2%(+8.35)#2,180 |
| 52. | 99678 | 18.9% | 11.3%(+7.55)#52 | 11.2%(+7.66)#2,444 |
| 53. | 99555 | 18.8% | 11.3%(+7.42)#53 | 11.2%(+7.54)#2,496 |
| 54. | 99723 | 18.6% | 11.3%(+7.26)#54 | 11.2%(+7.37)#2,561 |
| 55. | 99658 | 18.3% | 11.3%(+7.02)#55 | 11.2%(+7.13)#2,656 |
| 56. | 99632 | 18.2% | 11.3%(+6.85)#56 | 11.2%(+6.97)#2,728 |
| 57. | 99709 | 18.0% | 11.3%(+6.65)#57 | 11.2%(+6.77)#2,823 |
| 58. | 99664 | 17.4% | 11.3%(+6.03)#58 | 11.2%(+6.14)#3,152 |
| 59. | 99788 | 17.3% | 11.3%(+5.98)#59 | 11.2%(+6.09)#3,179 |
| 60. | 99784 | 17.1% | 11.3%(+5.81)#60 | 11.2%(+5.93)#3,290 |
| 61. | 99625 | 16.7% | 11.3%(+5.34)#61 | 11.2%(+5.45)#3,611 |
| 62. | 99578 | 16.4% | 11.3%(+5.11)#62 | 11.2%(+5.22)#3,740 |
| 63. | 99653 | 16.3% | 11.3%(+5.02)#63 | 11.2%(+5.13)#3,812 |
| 64. | 99561 | 16.2% | 11.3%(+4.91)#64 | 11.2%(+5.03)#3,881 |
| 65. | 99552 | 16.1% | 11.3%(+4.76)#65 | 11.2%(+4.88)#4,006 |
| 66. | 99604 | 16.0% | 11.3%(+4.67)#66 | 11.2%(+4.79)#4,070 |
| 67. | 99752 | 15.9% | 11.3%(+4.61)#67 | 11.2%(+4.72)#4,113 |
| 68. | 99607 | 15.7% | 11.3%(+4.39)#68 | 11.2%(+4.50)#4,319 |
| 69. | 99729 | 15.6% | 11.3%(+4.30)#69 | 11.2%(+4.41)#4,401 |
| 70. | 99727 | 15.5% | 11.3%(+4.21)#70 | 11.2%(+4.33)#4,461 |
| 71. | 99620 | 15.2% | 11.3%(+3.89)#71 | 11.2%(+4.00)#4,780 |
| 72. | 99662 | 14.9% | 11.3%(+3.55)#72 | 11.2%(+3.66)#5,080 |
| 73. | 99628 | 14.9% | 11.3%(+3.54)#73 | 11.2%(+3.66)#5,086 |
| 74. | 99780 | 14.7% | 11.3%(+3.36)#74 | 11.2%(+3.48)#5,266 |
| 75. | 99661 | 14.6% | 11.3%(+3.26)#75 | 11.2%(+3.38)#5,375 |
| 76. | 99703 | 14.4% | 11.3%(+3.11)#76 | 11.2%(+3.22)#5,551 |
| 77. | 99650 | 14.3% | 11.3%(+2.96)#77 | 11.2%(+3.07)#5,717 |
| 78. | 99659 | 14.3% | 11.3%(+2.96)#78 | 11.2%(+3.07)#5,722 |
| 79. | 99670 | 14.3% | 11.3%(+2.96)#79 | 11.2%(+3.07)#5,738 |
| 80. | 99565 | 14.3% | 11.3%(+2.96)#80 | 11.2%(+3.07)#5,740 |
| 81. | 99639 | 14.2% | 11.3%(+2.88)#81 | 11.2%(+2.99)#5,824 |
| 82. | 99554 | 14.1% | 11.3%(+2.78)#82 | 11.2%(+2.90)#5,952 |
| 83. | 99740 | 14.0% | 11.3%(+2.68)#83 | 11.2%(+2.80)#6,074 |
| 84. | 99777 | 14.0% | 11.3%(+2.65)#84 | 11.2%(+2.76)#6,110 |
| 85. | 99689 | 14.0% | 11.3%(+2.65)#85 | 11.2%(+2.76)#6,116 |
| 86. | 99778 | 14.0% | 11.3%(+2.63)#86 | 11.2%(+2.74)#6,156 |
| 87. | 99773 | 13.9% | 11.3%(+2.60)#87 | 11.2%(+2.71)#6,187 |
| 88. | 99663 | 13.9% | 11.3%(+2.54)#88 | 11.2%(+2.66)#6,239 |
| 89. | 99626 | 13.8% | 11.3%(+2.52)#89 | 11.2%(+2.63)#6,278 |
| 90. | 99627 | 13.8% | 11.3%(+2.47)#90 | 11.2%(+2.58)#6,355 |
| 91. | 99648 | 13.8% | 11.3%(+2.47)#91 | 11.2%(+2.58)#6,357 |
| 92. | 99515 | 13.4% | 11.3%(+2.05)#92 | 11.2%(+2.17)#6,933 |
| 93. | 99631 | 13.4% | 11.3%(+2.04)#93 | 11.2%(+2.15)#6,947 |
| 94. | 99641 | 13.3% | 11.3%(+1.95)#94 | 11.2%(+2.06)#7,115 |
| 95. | 99736 | 13.2% | 11.3%(+1.88)#95 | 11.2%(+1.99)#7,228 |
| 96. | 99614 | 13.1% | 11.3%(+1.81)#96 | 11.2%(+1.92)#7,333 |
| 97. | 99783 | 13.1% | 11.3%(+1.80)#97 | 11.2%(+1.92)#7,344 |
| 98. | 99827 | 13.0% | 11.3%(+1.64)#98 | 11.2%(+1.75)#7,616 |
| 99. | 99517 | 12.9% | 11.3%(+1.57)#99 | 11.2%(+1.69)#7,730 |
| 100. | 99516 | 12.9% | 11.3%(+1.55)#100 | 11.2%(+1.67)#7,765 |
Common Questions
What are the Top 10 Zip Codes with the Highest Percentage of Population Employed in Community & Social Service in Alaska?
Top 10 Zip Codes with the Highest Percentage of Population Employed in Community & Social Service in Alaska are:
What zip code has the Highest Percentage of Population Employed in Community & Social Service in Alaska?
99575 has the Highest Percentage of Population Employed in Community & Social Service in Alaska with 100.0%.
What is the Percentage of Population Employed in Community & Social Service in the State of Alaska?
Percentage of Population Employed in Community & Social Service in Alaska is 11.3%.
What is the Percentage of Population Employed in Community & Social Service in the United States?
Percentage of Population Employed in Community & Social Service in the United States is 11.2%.