Zip Codes with the Highest Percentage of Population Employed in Community & Social Service in Idaho
RELATED REPORTS & OPTIONS
Community & Social Service
Idaho
Compare Zip Codes
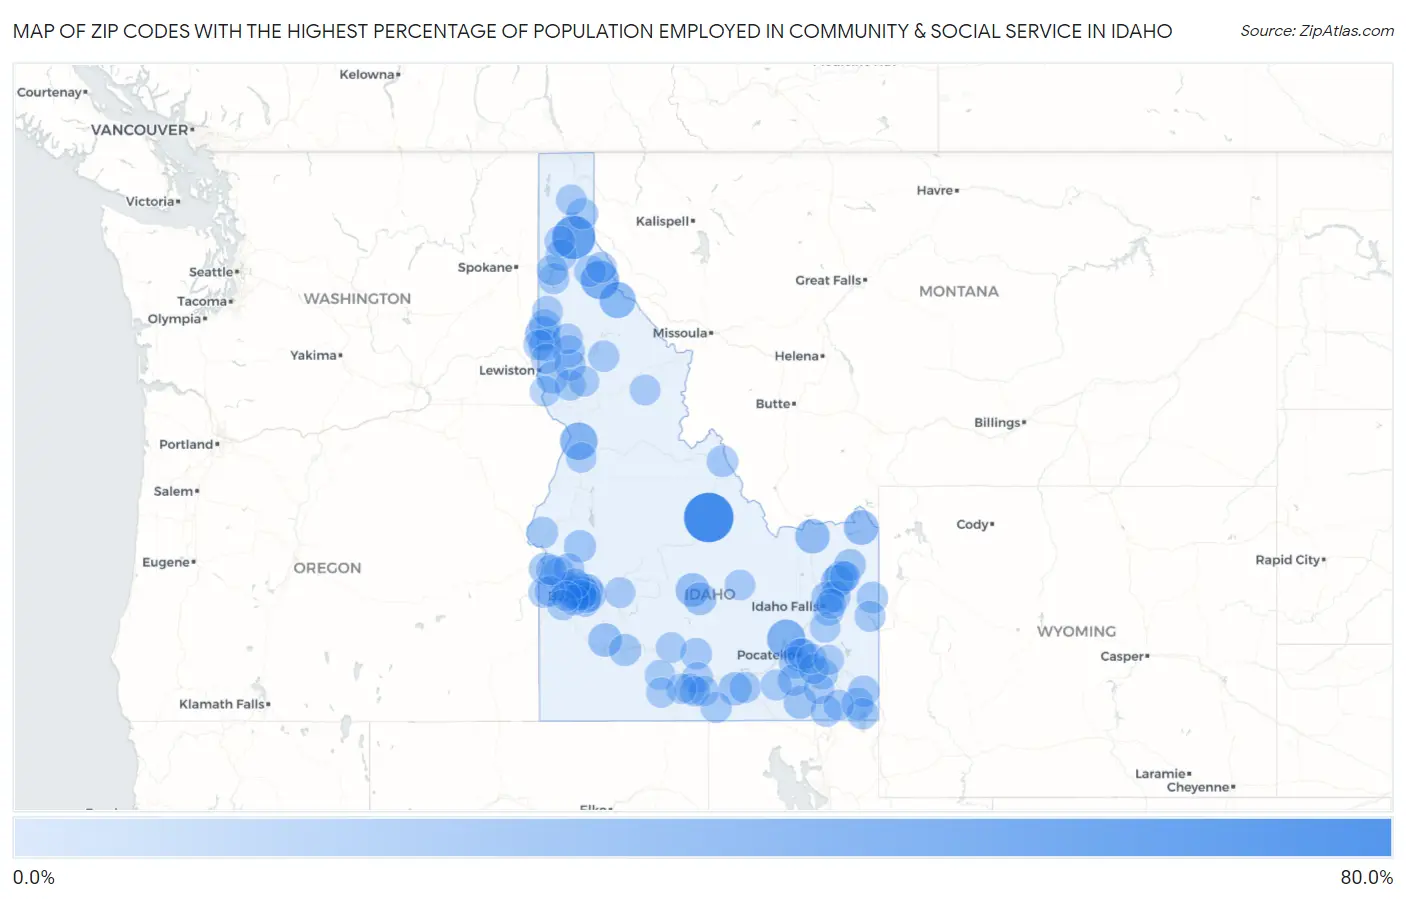
Map of Zip Codes with the Highest Percentage of Population Employed in Community & Social Service in Idaho
0.0%
80.0%
Zip Codes with the Highest Percentage of Population Employed in Community & Social Service in Idaho
| Zip Code | % Employed | vs State | vs National | |
| 1. | 83235 | 72.6% | 10.5%(+62.1)#1 | 11.2%(+61.4)#53 |
| 2. | 83803 | 51.1% | 10.5%(+40.6)#2 | 11.2%(+39.9)#146 |
| 3. | 83867 | 35.8% | 10.5%(+25.3)#3 | 11.2%(+24.6)#375 |
| 4. | 83277 | 35.4% | 10.5%(+24.9)#4 | 11.2%(+24.2)#381 |
| 5. | 83542 | 32.5% | 10.5%(+22.0)#5 | 11.2%(+21.3)#465 |
| 6. | 83802 | 28.4% | 10.5%(+17.9)#6 | 11.2%(+17.2)#672 |
| 7. | 83872 | 23.9% | 10.5%(+13.4)#7 | 11.2%(+12.7)#1,127 |
| 8. | 83429 | 23.5% | 10.5%(+13.0)#8 | 11.2%(+12.3)#1,199 |
| 9. | 83446 | 23.1% | 10.5%(+12.6)#9 | 11.2%(+11.9)#1,266 |
| 10. | 83353 | 21.0% | 10.5%(+10.5)#10 | 11.2%(+9.76)#1,717 |
| 11. | 83648 | 20.1% | 10.5%(+9.63)#11 | 11.2%(+8.93)#1,975 |
| 12. | 83448 | 19.8% | 10.5%(+9.29)#12 | 11.2%(+8.59)#2,089 |
| 13. | 83311 | 18.8% | 10.5%(+8.26)#13 | 11.2%(+7.56)#2,481 |
| 14. | 83209 | 18.5% | 10.5%(+7.94)#14 | 11.2%(+7.24)#2,612 |
| 15. | 83440 | 18.1% | 10.5%(+7.62)#15 | 11.2%(+6.92)#2,757 |
| 16. | 83333 | 17.6% | 10.5%(+7.05)#16 | 11.2%(+6.35)#3,040 |
| 17. | 83252 | 16.9% | 10.5%(+6.42)#17 | 11.2%(+5.72)#3,428 |
| 18. | 83454 | 16.5% | 10.5%(+6.03)#18 | 11.2%(+5.33)#3,669 |
| 19. | 83843 | 16.3% | 10.5%(+5.83)#19 | 11.2%(+5.13)#3,816 |
| 20. | 83712 | 15.9% | 10.5%(+5.43)#20 | 11.2%(+4.73)#4,112 |
| 21. | 83619 | 15.9% | 10.5%(+5.37)#21 | 11.2%(+4.67)#4,163 |
| 22. | 83657 | 15.9% | 10.5%(+5.36)#22 | 11.2%(+4.66)#4,169 |
| 23. | 83540 | 15.5% | 10.5%(+5.03)#23 | 11.2%(+4.33)#4,463 |
| 24. | 83627 | 15.2% | 10.5%(+4.71)#24 | 11.2%(+4.00)#4,781 |
| 25. | 83204 | 15.1% | 10.5%(+4.64)#25 | 11.2%(+3.93)#4,832 |
| 26. | 83646 | 15.1% | 10.5%(+4.62)#26 | 11.2%(+3.92)#4,845 |
| 27. | 83261 | 15.1% | 10.5%(+4.57)#27 | 11.2%(+3.87)#4,896 |
| 28. | 83714 | 14.7% | 10.5%(+4.17)#28 | 11.2%(+3.47)#5,278 |
| 29. | 83537 | 14.7% | 10.5%(+4.14)#29 | 11.2%(+3.44)#5,308 |
| 30. | 83702 | 14.5% | 10.5%(+4.01)#30 | 11.2%(+3.31)#5,457 |
| 31. | 83212 | 14.4% | 10.5%(+3.92)#31 | 11.2%(+3.22)#5,552 |
| 32. | 83421 | 14.4% | 10.5%(+3.86)#32 | 11.2%(+3.16)#5,623 |
| 33. | 83703 | 14.3% | 10.5%(+3.81)#33 | 11.2%(+3.11)#5,676 |
| 34. | 83254 | 13.9% | 10.5%(+3.36)#34 | 11.2%(+2.66)#6,240 |
| 35. | 83324 | 13.7% | 10.5%(+3.17)#35 | 11.2%(+2.47)#6,503 |
| 36. | 83462 | 13.7% | 10.5%(+3.16)#36 | 11.2%(+2.46)#6,510 |
| 37. | 83455 | 13.6% | 10.5%(+3.13)#37 | 11.2%(+2.42)#6,558 |
| 38. | 83855 | 13.5% | 10.5%(+3.01)#38 | 11.2%(+2.30)#6,722 |
| 39. | 83839 | 13.5% | 10.5%(+3.00)#39 | 11.2%(+2.29)#6,739 |
| 40. | 83836 | 13.3% | 10.5%(+2.81)#40 | 11.2%(+2.10)#7,040 |
| 41. | 83442 | 13.2% | 10.5%(+2.74)#41 | 11.2%(+2.04)#7,156 |
| 42. | 83323 | 13.0% | 10.5%(+2.50)#42 | 11.2%(+1.80)#7,537 |
| 43. | 83669 | 13.0% | 10.5%(+2.49)#43 | 11.2%(+1.78)#7,563 |
| 44. | 83272 | 13.0% | 10.5%(+2.47)#44 | 11.2%(+1.76)#7,594 |
| 45. | 83541 | 12.9% | 10.5%(+2.42)#45 | 11.2%(+1.72)#7,672 |
| 46. | 83672 | 12.7% | 10.5%(+2.24)#46 | 11.2%(+1.53)#7,988 |
| 47. | 83835 | 12.7% | 10.5%(+2.21)#47 | 11.2%(+1.51)#8,030 |
| 48. | 83546 | 12.6% | 10.5%(+2.07)#48 | 11.2%(+1.37)#8,275 |
| 49. | 83406 | 12.6% | 10.5%(+2.06)#49 | 11.2%(+1.36)#8,301 |
| 50. | 83713 | 12.5% | 10.5%(+1.99)#50 | 11.2%(+1.28)#8,434 |
| 51. | 83232 | 12.4% | 10.5%(+1.94)#51 | 11.2%(+1.23)#8,511 |
| 52. | 83523 | 12.4% | 10.5%(+1.85)#52 | 11.2%(+1.14)#8,681 |
| 53. | 83636 | 12.3% | 10.5%(+1.76)#53 | 11.2%(+1.05)#8,835 |
| 54. | 83201 | 12.2% | 10.5%(+1.72)#54 | 11.2%(+1.02)#8,901 |
| 55. | 83705 | 12.2% | 10.5%(+1.71)#55 | 11.2%(+1.00)#8,932 |
| 56. | 83346 | 12.2% | 10.5%(+1.70)#56 | 11.2%(+0.992)#8,956 |
| 57. | 83706 | 12.1% | 10.5%(+1.56)#57 | 11.2%(+0.859)#9,228 |
| 58. | 83617 | 12.1% | 10.5%(+1.54)#58 | 11.2%(+0.836)#9,264 |
| 59. | 83833 | 12.0% | 10.5%(+1.54)#59 | 11.2%(+0.834)#9,267 |
| 60. | 83271 | 11.8% | 10.5%(+1.31)#60 | 11.2%(+0.604)#9,728 |
| 61. | 83246 | 11.8% | 10.5%(+1.26)#61 | 11.2%(+0.561)#9,830 |
| 62. | 83428 | 11.8% | 10.5%(+1.25)#62 | 11.2%(+0.550)#9,858 |
| 63. | 83814 | 11.7% | 10.5%(+1.22)#63 | 11.2%(+0.517)#9,917 |
| 64. | 83234 | 11.6% | 10.5%(+1.06)#64 | 11.2%(+0.354)#10,306 |
| 65. | 83543 | 11.4% | 10.5%(+0.929)#65 | 11.2%(+0.226)#10,577 |
| 66. | 83676 | 11.4% | 10.5%(+0.857)#66 | 11.2%(+0.154)#10,742 |
| 67. | 83873 | 11.3% | 10.5%(+0.824)#67 | 11.2%(+0.121)#10,821 |
| 68. | 83704 | 11.3% | 10.5%(+0.822)#68 | 11.2%(+0.119)#10,826 |
| 69. | 83864 | 11.3% | 10.5%(+0.821)#69 | 11.2%(+0.118)#10,827 |
| 70. | 83801 | 11.3% | 10.5%(+0.756)#70 | 11.2%(+0.053)#10,971 |
| 71. | 83325 | 11.1% | 10.5%(+0.634)#71 | 11.2%(-0.069)#11,261 |
| 72. | 83341 | 11.1% | 10.5%(+0.608)#72 | 11.2%(-0.095)#11,320 |
| 73. | 83870 | 11.1% | 10.5%(+0.600)#73 | 11.2%(-0.103)#11,347 |
| 74. | 83642 | 11.0% | 10.5%(+0.475)#74 | 11.2%(-0.228)#11,677 |
| 75. | 83263 | 11.0% | 10.5%(+0.450)#75 | 11.2%(-0.253)#11,733 |
| 76. | 83539 | 10.9% | 10.5%(+0.424)#76 | 11.2%(-0.279)#11,797 |
| 77. | 83616 | 10.9% | 10.5%(+0.414)#77 | 11.2%(-0.289)#11,831 |
| 78. | 83823 | 10.9% | 10.5%(+0.365)#78 | 11.2%(-0.338)#11,955 |
| 79. | 83626 | 10.9% | 10.5%(+0.362)#79 | 11.2%(-0.341)#11,960 |
| 80. | 83255 | 10.8% | 10.5%(+0.254)#80 | 11.2%(-0.449)#12,206 |
| 81. | 83716 | 10.7% | 10.5%(+0.182)#81 | 11.2%(-0.521)#12,395 |
| 82. | 83844 | 10.7% | 10.5%(+0.174)#82 | 11.2%(-0.529)#12,413 |
| 83. | 83344 | 10.6% | 10.5%(+0.134)#83 | 11.2%(-0.568)#12,517 |
| 84. | 83655 | 10.6% | 10.5%(+0.118)#84 | 11.2%(-0.585)#12,563 |
| 85. | 83330 | 10.5% | 10.5%(-0.049)#85 | 11.2%(-0.752)#12,964 |
| 86. | 83549 | 10.5% | 10.5%(-0.057)#86 | 11.2%(-0.760)#12,981 |
| 87. | 83686 | 10.3% | 10.5%(-0.197)#87 | 11.2%(-0.900)#13,322 |
| 88. | 83250 | 10.3% | 10.5%(-0.232)#88 | 11.2%(-0.935)#13,412 |
| 89. | 83236 | 10.2% | 10.5%(-0.317)#89 | 11.2%(-1.02)#13,617 |
| 90. | 83316 | 10.1% | 10.5%(-0.365)#90 | 11.2%(-1.07)#13,749 |
| 91. | 83334 | 10.1% | 10.5%(-0.379)#91 | 11.2%(-1.08)#13,789 |
| 92. | 83451 | 10.1% | 10.5%(-0.391)#92 | 11.2%(-1.09)#13,819 |
| 93. | 83501 | 10.1% | 10.5%(-0.427)#93 | 11.2%(-1.13)#13,911 |
| 94. | 83401 | 10.1% | 10.5%(-0.427)#94 | 11.2%(-1.13)#13,912 |
| 95. | 83301 | 10.1% | 10.5%(-0.432)#95 | 11.2%(-1.13)#13,928 |
| 96. | 83245 | 10.0% | 10.5%(-0.500)#96 | 11.2%(-1.20)#14,089 |
| 97. | 83217 | 9.9% | 10.5%(-0.571)#97 | 11.2%(-1.27)#14,284 |
| 98. | 83687 | 9.9% | 10.5%(-0.608)#98 | 11.2%(-1.31)#14,380 |
| 99. | 83832 | 9.8% | 10.5%(-0.738)#99 | 11.2%(-1.44)#14,701 |
| 100. | 83321 | 9.8% | 10.5%(-0.755)#100 | 11.2%(-1.46)#14,734 |
Common Questions
What are the Top 10 Zip Codes with the Highest Percentage of Population Employed in Community & Social Service in Idaho?
Top 10 Zip Codes with the Highest Percentage of Population Employed in Community & Social Service in Idaho are:
What zip code has the Highest Percentage of Population Employed in Community & Social Service in Idaho?
83235 has the Highest Percentage of Population Employed in Community & Social Service in Idaho with 72.6%.
What is the Percentage of Population Employed in Community & Social Service in the State of Idaho?
Percentage of Population Employed in Community & Social Service in Idaho is 10.5%.
What is the Percentage of Population Employed in Community & Social Service in the United States?
Percentage of Population Employed in Community & Social Service in the United States is 11.2%.