Zip Codes with the Highest Percentage of Population Employed in Community & Social Service in Utah
RELATED REPORTS & OPTIONS
Community & Social Service
Utah
Compare Zip Codes
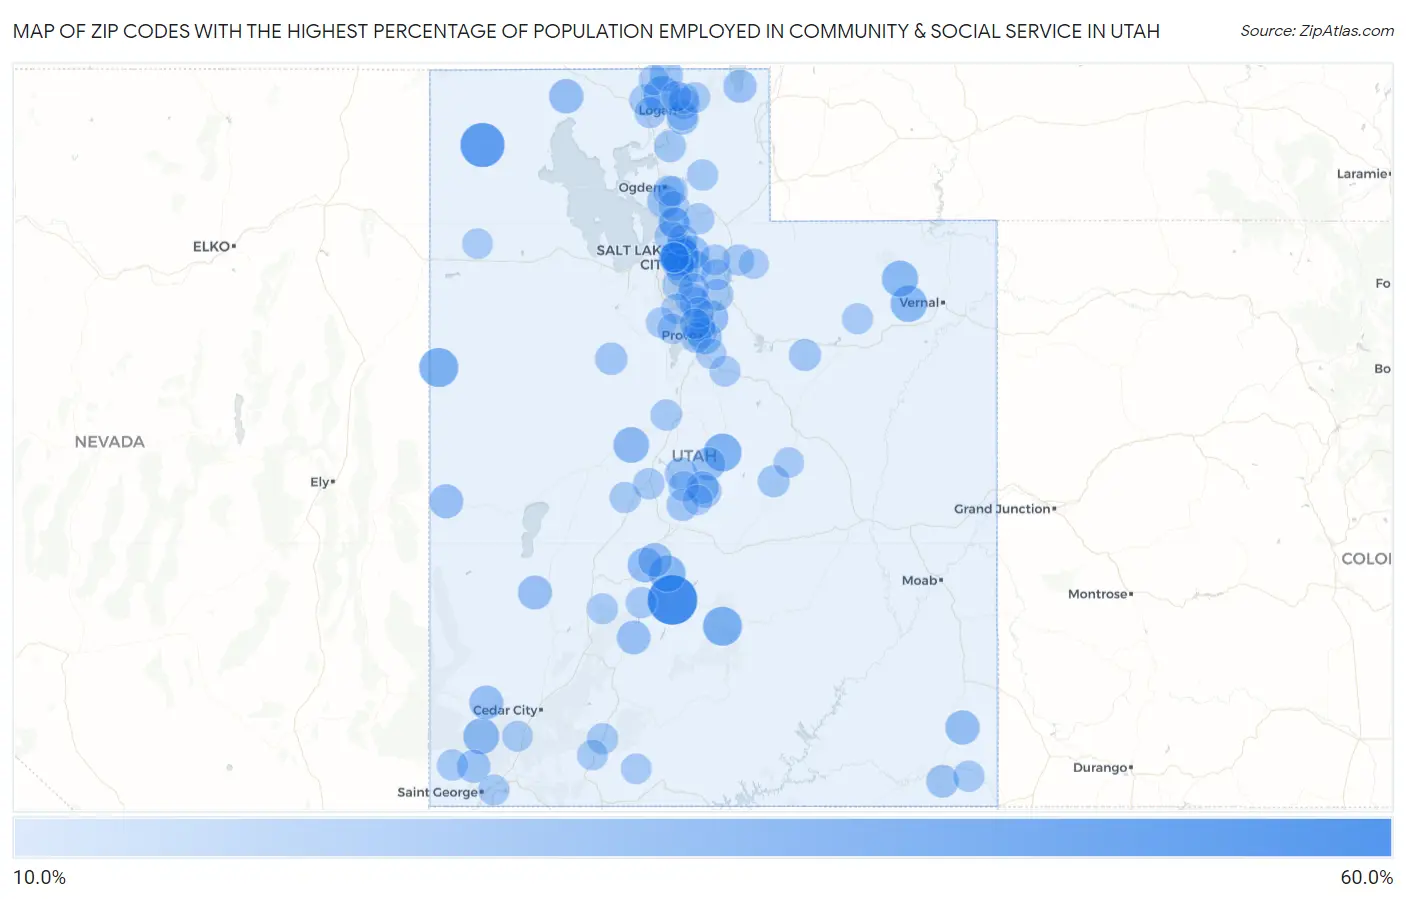
Map of Zip Codes with the Highest Percentage of Population Employed in Community & Social Service in Utah
10.0%
60.0%
Zip Codes with the Highest Percentage of Population Employed in Community & Social Service in Utah
| Zip Code | % Employed | vs State | vs National | |
| 1. | 84732 | 60.0% | 11.0%(+49.0)#1 | 11.2%(+48.8)#85 |
| 2. | 84313 | 46.4% | 11.0%(+35.4)#2 | 11.2%(+35.2)#203 |
| 3. | 84034 | 33.3% | 11.0%(+22.3)#3 | 11.2%(+22.1)#439 |
| 4. | 84773 | 33.1% | 11.0%(+22.1)#4 | 11.2%(+21.9)#449 |
| 5. | 84112 | 31.2% | 11.0%(+20.1)#5 | 11.2%(+19.9)#525 |
| 6. | 84662 | 30.5% | 11.0%(+19.5)#6 | 11.2%(+19.3)#560 |
| 7. | 84304 | 30.4% | 11.0%(+19.4)#7 | 11.2%(+19.2)#565 |
| 8. | 84744 | 27.0% | 11.0%(+16.0)#8 | 11.2%(+15.8)#771 |
| 9. | 84076 | 26.8% | 11.0%(+15.8)#9 | 11.2%(+15.6)#796 |
| 10. | 84085 | 26.5% | 11.0%(+15.4)#10 | 11.2%(+15.3)#822 |
| 11. | 84722 | 25.7% | 11.0%(+14.6)#11 | 11.2%(+14.5)#902 |
| 12. | 84638 | 25.2% | 11.0%(+14.1)#12 | 11.2%(+14.0)#951 |
| 13. | 84113 | 24.7% | 11.0%(+13.6)#13 | 11.2%(+13.4)#1,023 |
| 14. | 84724 | 22.8% | 11.0%(+11.7)#14 | 11.2%(+11.6)#1,316 |
| 15. | 84336 | 22.0% | 11.0%(+10.9)#15 | 11.2%(+10.7)#1,484 |
| 16. | 84511 | 21.7% | 11.0%(+10.6)#16 | 11.2%(+10.4)#1,551 |
| 17. | 84604 | 21.2% | 11.0%(+10.2)#17 | 11.2%(+10.0)#1,651 |
| 18. | 84751 | 21.0% | 11.0%(+9.92)#18 | 11.2%(+9.74)#1,721 |
| 19. | 84728 | 20.9% | 11.0%(+9.90)#19 | 11.2%(+9.72)#1,730 |
| 20. | 84711 | 20.8% | 11.0%(+9.78)#20 | 11.2%(+9.60)#1,775 |
| 21. | 84756 | 20.7% | 11.0%(+9.66)#21 | 11.2%(+9.48)#1,814 |
| 22. | 84723 | 20.1% | 11.0%(+9.09)#22 | 11.2%(+8.91)#1,979 |
| 23. | 84606 | 19.9% | 11.0%(+8.87)#23 | 11.2%(+8.69)#2,050 |
| 24. | 84102 | 19.7% | 11.0%(+8.69)#24 | 11.2%(+8.51)#2,117 |
| 25. | 84056 | 19.6% | 11.0%(+8.58)#25 | 11.2%(+8.40)#2,155 |
| 26. | 84108 | 19.5% | 11.0%(+8.50)#26 | 11.2%(+8.32)#2,187 |
| 27. | 84627 | 19.2% | 11.0%(+8.21)#27 | 11.2%(+8.03)#2,292 |
| 28. | 84038 | 19.0% | 11.0%(+8.02)#28 | 11.2%(+7.83)#2,380 |
| 29. | 84783 | 18.9% | 11.0%(+7.86)#29 | 11.2%(+7.68)#2,435 |
| 30. | 84308 | 18.2% | 11.0%(+7.22)#30 | 11.2%(+7.03)#2,698 |
| 31. | 84642 | 18.2% | 11.0%(+7.16)#31 | 11.2%(+6.98)#2,718 |
| 32. | 84630 | 18.0% | 11.0%(+6.99)#32 | 11.2%(+6.81)#2,800 |
| 33. | 84103 | 18.0% | 11.0%(+6.96)#33 | 11.2%(+6.78)#2,816 |
| 34. | 84512 | 17.6% | 11.0%(+6.56)#34 | 11.2%(+6.37)#3,022 |
| 35. | 84665 | 17.5% | 11.0%(+6.47)#35 | 11.2%(+6.29)#3,060 |
| 36. | 84105 | 17.2% | 11.0%(+6.21)#36 | 11.2%(+6.03)#3,222 |
| 37. | 84080 | 16.9% | 11.0%(+5.84)#37 | 11.2%(+5.65)#3,468 |
| 38. | 84124 | 16.2% | 11.0%(+5.21)#38 | 11.2%(+5.02)#3,882 |
| 39. | 84027 | 16.0% | 11.0%(+5.01)#39 | 11.2%(+4.82)#4,044 |
| 40. | 84513 | 16.0% | 11.0%(+5.00)#40 | 11.2%(+4.81)#4,054 |
| 41. | 84324 | 16.0% | 11.0%(+4.92)#41 | 11.2%(+4.74)#4,103 |
| 42. | 84622 | 15.9% | 11.0%(+4.89)#42 | 11.2%(+4.70)#4,130 |
| 43. | 84109 | 15.8% | 11.0%(+4.77)#43 | 11.2%(+4.59)#4,232 |
| 44. | 84326 | 15.7% | 11.0%(+4.62)#44 | 11.2%(+4.44)#4,374 |
| 45. | 84049 | 15.5% | 11.0%(+4.49)#45 | 11.2%(+4.31)#4,480 |
| 46. | 84004 | 15.4% | 11.0%(+4.34)#46 | 11.2%(+4.15)#4,642 |
| 47. | 84341 | 15.1% | 11.0%(+4.06)#47 | 11.2%(+3.87)#4,885 |
| 48. | 84334 | 15.0% | 11.0%(+3.97)#48 | 11.2%(+3.79)#4,966 |
| 49. | 84602 | 14.9% | 11.0%(+3.91)#49 | 11.2%(+3.72)#5,029 |
| 50. | 84025 | 14.8% | 11.0%(+3.72)#50 | 11.2%(+3.54)#5,204 |
| 51. | 84656 | 14.4% | 11.0%(+3.40)#51 | 11.2%(+3.21)#5,557 |
| 52. | 84534 | 14.4% | 11.0%(+3.37)#52 | 11.2%(+3.19)#5,589 |
| 53. | 84097 | 14.3% | 11.0%(+3.26)#53 | 11.2%(+3.08)#5,701 |
| 54. | 84408 | 14.3% | 11.0%(+3.25)#54 | 11.2%(+3.07)#5,733 |
| 55. | 84765 | 14.3% | 11.0%(+3.25)#55 | 11.2%(+3.06)#5,746 |
| 56. | 84087 | 14.3% | 11.0%(+3.23)#56 | 11.2%(+3.05)#5,767 |
| 57. | 84050 | 14.3% | 11.0%(+3.23)#57 | 11.2%(+3.04)#5,768 |
| 58. | 84317 | 14.2% | 11.0%(+3.21)#58 | 11.2%(+3.03)#5,781 |
| 59. | 84648 | 14.2% | 11.0%(+3.18)#59 | 11.2%(+2.99)#5,820 |
| 60. | 84750 | 14.2% | 11.0%(+3.12)#60 | 11.2%(+2.94)#5,887 |
| 61. | 84106 | 14.1% | 11.0%(+3.10)#61 | 11.2%(+2.92)#5,927 |
| 62. | 84710 | 14.1% | 11.0%(+3.05)#62 | 11.2%(+2.87)#5,988 |
| 63. | 84061 | 14.0% | 11.0%(+2.98)#63 | 11.2%(+2.80)#6,077 |
| 64. | 84309 | 13.9% | 11.0%(+2.89)#64 | 11.2%(+2.70)#6,197 |
| 65. | 84636 | 13.9% | 11.0%(+2.86)#65 | 11.2%(+2.67)#6,223 |
| 66. | 84060 | 13.8% | 11.0%(+2.76)#66 | 11.2%(+2.58)#6,359 |
| 67. | 84098 | 13.7% | 11.0%(+2.65)#67 | 11.2%(+2.47)#6,498 |
| 68. | 84780 | 13.6% | 11.0%(+2.58)#68 | 11.2%(+2.40)#6,594 |
| 69. | 84001 | 13.5% | 11.0%(+2.44)#69 | 11.2%(+2.25)#6,794 |
| 70. | 84332 | 13.4% | 11.0%(+2.39)#70 | 11.2%(+2.21)#6,865 |
| 71. | 84010 | 13.4% | 11.0%(+2.37)#71 | 11.2%(+2.19)#6,893 |
| 72. | 84713 | 13.3% | 11.0%(+2.23)#72 | 11.2%(+2.05)#7,138 |
| 73. | 84660 | 13.2% | 11.0%(+2.16)#73 | 11.2%(+1.98)#7,249 |
| 74. | 84003 | 13.2% | 11.0%(+2.16)#74 | 11.2%(+1.97)#7,255 |
| 75. | 84729 | 13.2% | 11.0%(+2.13)#75 | 11.2%(+1.94)#7,307 |
| 76. | 84094 | 13.1% | 11.0%(+2.11)#76 | 11.2%(+1.93)#7,330 |
| 77. | 84037 | 13.1% | 11.0%(+2.05)#77 | 11.2%(+1.87)#7,423 |
| 78. | 84634 | 13.1% | 11.0%(+2.03)#78 | 11.2%(+1.85)#7,460 |
| 79. | 84092 | 13.0% | 11.0%(+1.93)#79 | 11.2%(+1.75)#7,623 |
| 80. | 84318 | 13.0% | 11.0%(+1.92)#80 | 11.2%(+1.74)#7,636 |
| 81. | 84720 | 12.9% | 11.0%(+1.90)#81 | 11.2%(+1.71)#7,680 |
| 82. | 84601 | 12.9% | 11.0%(+1.87)#82 | 11.2%(+1.68)#7,735 |
| 83. | 84321 | 12.8% | 11.0%(+1.81)#83 | 11.2%(+1.63)#7,815 |
| 84. | 84741 | 12.8% | 11.0%(+1.77)#84 | 11.2%(+1.59)#7,880 |
| 85. | 84062 | 12.8% | 11.0%(+1.73)#85 | 11.2%(+1.55)#7,948 |
| 86. | 84005 | 12.7% | 11.0%(+1.69)#86 | 11.2%(+1.50)#8,035 |
| 87. | 84083 | 12.7% | 11.0%(+1.62)#87 | 11.2%(+1.44)#8,152 |
| 88. | 84040 | 12.6% | 11.0%(+1.57)#88 | 11.2%(+1.38)#8,240 |
| 89. | 84518 | 12.5% | 11.0%(+1.51)#89 | 11.2%(+1.33)#8,343 |
| 90. | 84305 | 12.5% | 11.0%(+1.43)#90 | 11.2%(+1.25)#8,489 |
| 91. | 84043 | 12.4% | 11.0%(+1.41)#91 | 11.2%(+1.23)#8,515 |
| 92. | 84045 | 12.3% | 11.0%(+1.31)#92 | 11.2%(+1.13)#8,701 |
| 93. | 84664 | 12.3% | 11.0%(+1.30)#93 | 11.2%(+1.12)#8,729 |
| 94. | 84057 | 12.3% | 11.0%(+1.23)#94 | 11.2%(+1.04)#8,853 |
| 95. | 84111 | 12.3% | 11.0%(+1.22)#95 | 11.2%(+1.04)#8,867 |
| 96. | 84335 | 12.2% | 11.0%(+1.14)#96 | 11.2%(+0.954)#9,023 |
| 97. | 84403 | 12.2% | 11.0%(+1.12)#97 | 11.2%(+0.941)#9,042 |
| 98. | 84101 | 12.1% | 11.0%(+1.09)#98 | 11.2%(+0.909)#9,104 |
| 99. | 84643 | 12.1% | 11.0%(+1.06)#99 | 11.2%(+0.874)#9,196 |
| 100. | 84055 | 12.0% | 11.0%(+1.01)#100 | 11.2%(+0.828)#9,286 |
Common Questions
What are the Top 10 Zip Codes with the Highest Percentage of Population Employed in Community & Social Service in Utah?
Top 10 Zip Codes with the Highest Percentage of Population Employed in Community & Social Service in Utah are:
What zip code has the Highest Percentage of Population Employed in Community & Social Service in Utah?
84732 has the Highest Percentage of Population Employed in Community & Social Service in Utah with 60.0%.
What is the Percentage of Population Employed in Community & Social Service in the State of Utah?
Percentage of Population Employed in Community & Social Service in Utah is 11.0%.
What is the Percentage of Population Employed in Community & Social Service in the United States?
Percentage of Population Employed in Community & Social Service in the United States is 11.2%.