Zip Codes with the Highest Percentage of Population Employed in Community & Social Service in Rhode Island
RELATED REPORTS & OPTIONS
Community & Social Service
Rhode Island
Compare Zip Codes
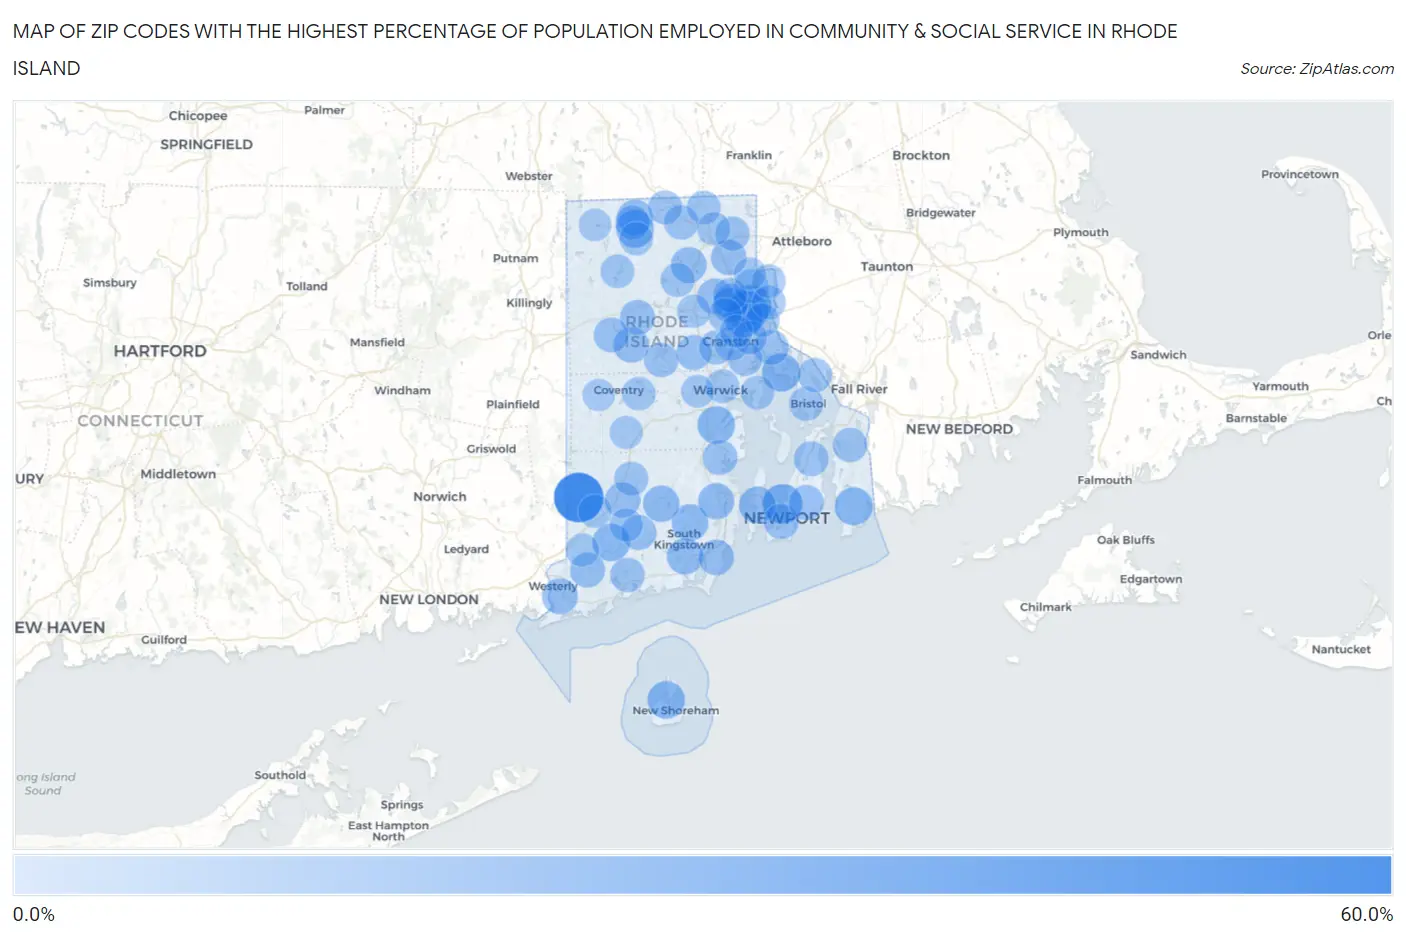
Map of Zip Codes with the Highest Percentage of Population Employed in Community & Social Service in Rhode Island
0.0%
60.0%
Zip Codes with the Highest Percentage of Population Employed in Community & Social Service in Rhode Island
| Zip Code | % Employed | vs State | vs National | |
| 1. | 02873 | 57.1% | 12.9%(+44.3)#1 | 11.2%(+45.9)#98 |
| 2. | 02912 | 31.8% | 12.9%(+19.0)#2 | 11.2%(+20.6)#491 |
| 3. | 02906 | 28.8% | 12.9%(+15.9)#3 | 11.2%(+17.6)#646 |
| 4. | 02841 | 27.3% | 12.9%(+14.5)#4 | 11.2%(+16.1)#739 |
| 5. | 02903 | 26.0% | 12.9%(+13.1)#5 | 11.2%(+14.8)#871 |
| 6. | 02806 | 23.8% | 12.9%(+11.0)#6 | 11.2%(+12.6)#1,136 |
| 7. | 02858 | 22.3% | 12.9%(+9.45)#7 | 11.2%(+11.1)#1,398 |
| 8. | 02837 | 22.3% | 12.9%(+9.42)#8 | 11.2%(+11.1)#1,403 |
| 9. | 02807 | 21.4% | 12.9%(+8.53)#9 | 11.2%(+10.2)#1,615 |
| 10. | 02894 | 21.3% | 12.9%(+8.47)#10 | 11.2%(+10.1)#1,629 |
| 11. | 02818 | 21.3% | 12.9%(+8.44)#11 | 11.2%(+10.1)#1,633 |
| 12. | 02835 | 19.4% | 12.9%(+6.56)#12 | 11.2%(+8.21)#2,229 |
| 13. | 02881 | 18.8% | 12.9%(+5.94)#13 | 11.2%(+7.59)#2,468 |
| 14. | 02892 | 18.0% | 12.9%(+5.18)#14 | 11.2%(+6.83)#2,794 |
| 15. | 02879 | 17.6% | 12.9%(+4.69)#15 | 11.2%(+6.34)#3,044 |
| 16. | 02874 | 17.3% | 12.9%(+4.47)#16 | 11.2%(+6.12)#3,167 |
| 17. | 02891 | 16.8% | 12.9%(+3.99)#17 | 11.2%(+5.63)#3,479 |
| 18. | 02917 | 16.6% | 12.9%(+3.71)#18 | 11.2%(+5.35)#3,655 |
| 19. | 02826 | 16.2% | 12.9%(+3.31)#19 | 11.2%(+4.96)#3,933 |
| 20. | 02882 | 15.9% | 12.9%(+3.06)#20 | 11.2%(+4.71)#4,125 |
| 21. | 02911 | 15.7% | 12.9%(+2.85)#21 | 11.2%(+4.49)#4,327 |
| 22. | 02918 | 15.7% | 12.9%(+2.84)#22 | 11.2%(+4.48)#4,336 |
| 23. | 02815 | 15.7% | 12.9%(+2.80)#23 | 11.2%(+4.45)#4,366 |
| 24. | 02865 | 15.4% | 12.9%(+2.59)#24 | 11.2%(+4.24)#4,561 |
| 25. | 02898 | 15.0% | 12.9%(+2.10)#25 | 11.2%(+3.75)#4,999 |
| 26. | 02908 | 14.6% | 12.9%(+1.74)#26 | 11.2%(+3.39)#5,361 |
| 27. | 02875 | 14.6% | 12.9%(+1.70)#27 | 11.2%(+3.34)#5,420 |
| 28. | 02840 | 14.5% | 12.9%(+1.60)#28 | 11.2%(+3.25)#5,510 |
| 29. | 02857 | 14.1% | 12.9%(+1.25)#29 | 11.2%(+2.89)#5,957 |
| 30. | 02921 | 14.0% | 12.9%(+1.16)#30 | 11.2%(+2.81)#6,066 |
| 31. | 02808 | 14.0% | 12.9%(+1.11)#31 | 11.2%(+2.75)#6,130 |
| 32. | 02915 | 13.8% | 12.9%(+0.978)#32 | 11.2%(+2.63)#6,286 |
| 33. | 02842 | 13.8% | 12.9%(+0.915)#33 | 11.2%(+2.56)#6,378 |
| 34. | 02852 | 13.8% | 12.9%(+0.914)#34 | 11.2%(+2.56)#6,379 |
| 35. | 02825 | 13.7% | 12.9%(+0.803)#35 | 11.2%(+2.45)#6,522 |
| 36. | 02871 | 13.3% | 12.9%(+0.482)#36 | 11.2%(+2.13)#6,983 |
| 37. | 02878 | 12.4% | 12.9%(-0.461)#37 | 11.2%(+1.19)#8,594 |
| 38. | 02813 | 12.4% | 12.9%(-0.472)#38 | 11.2%(+1.18)#8,611 |
| 39. | 02831 | 12.4% | 12.9%(-0.473)#39 | 11.2%(+1.17)#8,616 |
| 40. | 02896 | 12.3% | 12.9%(-0.526)#40 | 11.2%(+1.12)#8,720 |
| 41. | 02888 | 12.2% | 12.9%(-0.633)#41 | 11.2%(+1.01)#8,910 |
| 42. | 02920 | 12.0% | 12.9%(-0.868)#42 | 11.2%(+0.780)#9,387 |
| 43. | 02864 | 12.0% | 12.9%(-0.892)#43 | 11.2%(+0.755)#9,435 |
| 44. | 02830 | 11.9% | 12.9%(-0.938)#44 | 11.2%(+0.709)#9,534 |
| 45. | 02809 | 11.9% | 12.9%(-0.999)#45 | 11.2%(+0.649)#9,638 |
| 46. | 02822 | 11.7% | 12.9%(-1.17)#46 | 11.2%(+0.477)#10,020 |
| 47. | 02910 | 11.3% | 12.9%(-1.56)#47 | 11.2%(+0.092)#10,872 |
| 48. | 02876 | 11.3% | 12.9%(-1.57)#48 | 11.2%(+0.076)#10,907 |
| 49. | 02885 | 11.2% | 12.9%(-1.69)#49 | 11.2%(-0.039)#11,192 |
| 50. | 02860 | 11.1% | 12.9%(-1.74)#50 | 11.2%(-0.092)#11,311 |
| 51. | 02904 | 11.0% | 12.9%(-1.88)#51 | 11.2%(-0.233)#11,688 |
| 52. | 02828 | 11.0% | 12.9%(-1.91)#52 | 11.2%(-0.264)#11,757 |
| 53. | 02905 | 10.7% | 12.9%(-2.18)#53 | 11.2%(-0.531)#12,420 |
| 54. | 02814 | 10.3% | 12.9%(-2.53)#54 | 11.2%(-0.883)#13,283 |
| 55. | 02909 | 10.1% | 12.9%(-2.74)#55 | 11.2%(-1.09)#13,816 |
| 56. | 02916 | 10.1% | 12.9%(-2.77)#56 | 11.2%(-1.12)#13,889 |
| 57. | 02886 | 10.1% | 12.9%(-2.77)#57 | 11.2%(-1.12)#13,896 |
| 58. | 02895 | 10.1% | 12.9%(-2.80)#58 | 11.2%(-1.15)#13,977 |
| 59. | 02914 | 9.9% | 12.9%(-3.00)#59 | 11.2%(-1.35)#14,498 |
| 60. | 02816 | 9.8% | 12.9%(-3.10)#60 | 11.2%(-1.45)#14,720 |
| 61. | 02861 | 9.7% | 12.9%(-3.15)#61 | 11.2%(-1.50)#14,828 |
| 62. | 02889 | 9.7% | 12.9%(-3.18)#62 | 11.2%(-1.54)#14,910 |
| 63. | 02839 | 9.5% | 12.9%(-3.36)#63 | 11.2%(-1.71)#15,416 |
| 64. | 02812 | 9.4% | 12.9%(-3.51)#64 | 11.2%(-1.86)#15,812 |
| 65. | 02832 | 9.3% | 12.9%(-3.58)#65 | 11.2%(-1.94)#16,039 |
| 66. | 02804 | 9.3% | 12.9%(-3.59)#66 | 11.2%(-1.94)#16,063 |
| 67. | 02838 | 9.1% | 12.9%(-3.72)#67 | 11.2%(-2.07)#16,423 |
| 68. | 02919 | 9.0% | 12.9%(-3.87)#68 | 11.2%(-2.22)#16,826 |
| 69. | 02817 | 8.6% | 12.9%(-4.22)#69 | 11.2%(-2.57)#17,785 |
| 70. | 02907 | 8.2% | 12.9%(-4.64)#70 | 11.2%(-2.99)#18,957 |
| 71. | 02893 | 8.0% | 12.9%(-4.82)#71 | 11.2%(-3.17)#19,443 |
| 72. | 02859 | 7.0% | 12.9%(-5.90)#72 | 11.2%(-4.25)#22,227 |
| 73. | 02863 | 6.3% | 12.9%(-6.55)#73 | 11.2%(-4.90)#23,699 |
| 74. | 02827 | 6.3% | 12.9%(-6.55)#74 | 11.2%(-4.90)#23,702 |
1
Common Questions
What are the Top 10 Zip Codes with the Highest Percentage of Population Employed in Community & Social Service in Rhode Island?
Top 10 Zip Codes with the Highest Percentage of Population Employed in Community & Social Service in Rhode Island are:
What zip code has the Highest Percentage of Population Employed in Community & Social Service in Rhode Island?
02873 has the Highest Percentage of Population Employed in Community & Social Service in Rhode Island with 57.1%.
What is the Percentage of Population Employed in Community & Social Service in the State of Rhode Island?
Percentage of Population Employed in Community & Social Service in Rhode Island is 12.9%.
What is the Percentage of Population Employed in Community & Social Service in the United States?
Percentage of Population Employed in Community & Social Service in the United States is 11.2%.