Zip Codes with the Highest Percentage of Population Employed in Community & Social Service in Arkansas
RELATED REPORTS & OPTIONS
Community & Social Service
Arkansas
Compare Zip Codes
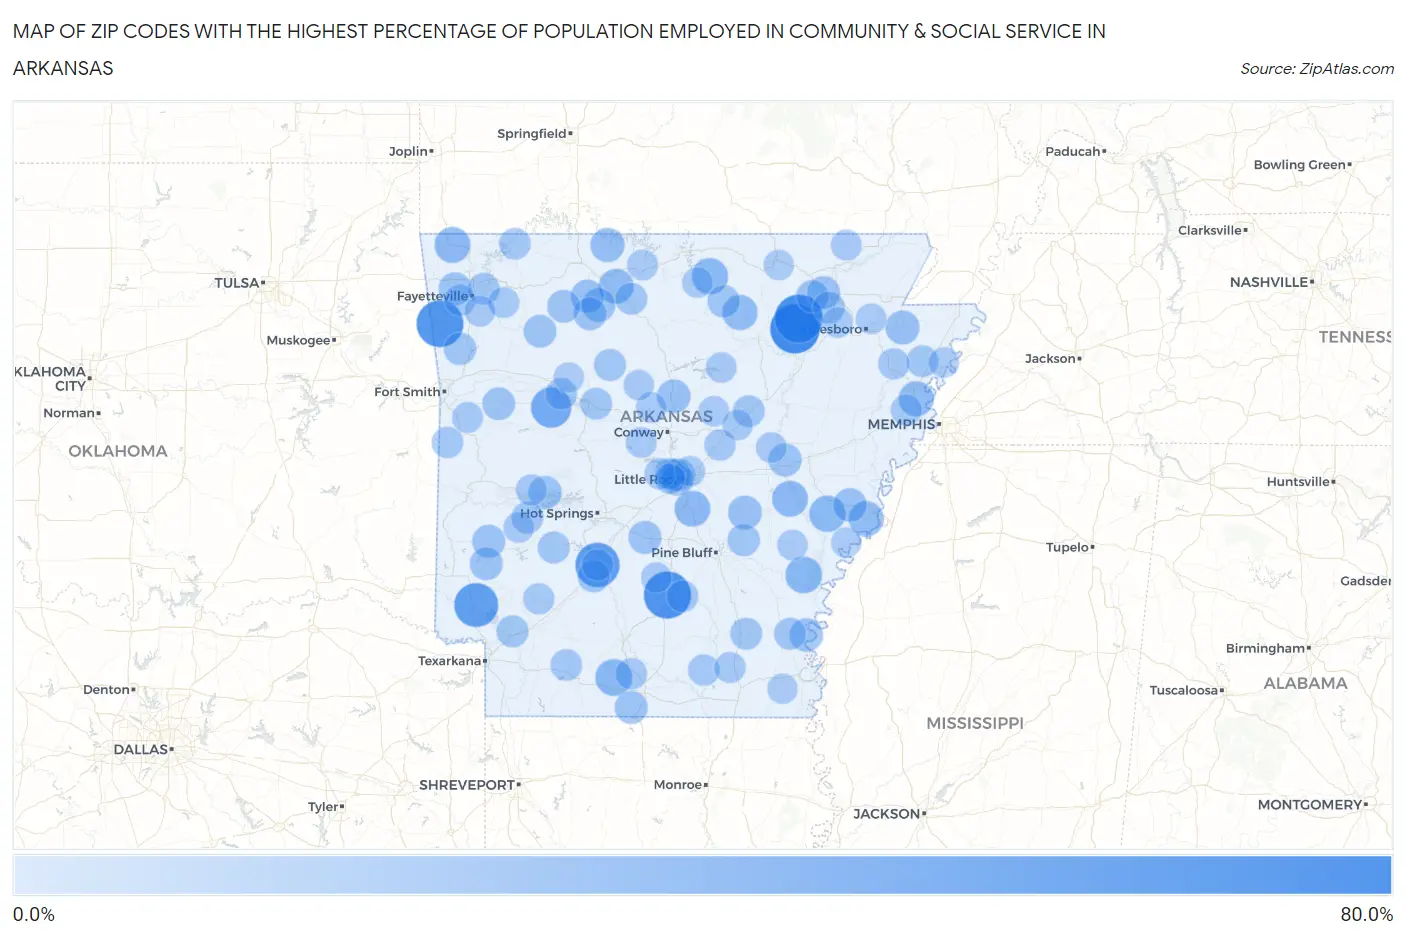
Map of Zip Codes with the Highest Percentage of Population Employed in Community & Social Service in Arkansas
0.0%
80.0%
Zip Codes with the Highest Percentage of Population Employed in Community & Social Service in Arkansas
| Zip Code | % Employed | vs State | vs National | |
| 1. | 72524 | 60.3% | 10.4%(+49.9)#1 | 11.2%(+49.1)#82 |
| 2. | 72572 | 57.0% | 10.4%(+46.6)#2 | 11.2%(+45.8)#102 |
| 3. | 71748 | 54.5% | 10.4%(+44.1)#3 | 11.2%(+43.3)#118 |
| 4. | 72749 | 53.6% | 10.4%(+43.2)#4 | 11.2%(+42.4)#121 |
| 5. | 71999 | 47.3% | 10.4%(+36.9)#5 | 11.2%(+36.1)#186 |
| 6. | 71823 | 46.4% | 10.4%(+36.0)#6 | 11.2%(+35.2)#202 |
| 7. | 72851 | 38.0% | 10.4%(+27.6)#7 | 11.2%(+26.8)#328 |
| 8. | 71758 | 28.9% | 10.4%(+18.5)#8 | 11.2%(+17.7)#635 |
| 9. | 72166 | 28.4% | 10.4%(+18.0)#9 | 11.2%(+17.2)#669 |
| 10. | 72383 | 27.8% | 10.4%(+17.4)#10 | 11.2%(+16.6)#710 |
| 11. | 72566 | 27.7% | 10.4%(+17.3)#11 | 11.2%(+16.5)#712 |
| 12. | 72739 | 26.9% | 10.4%(+16.5)#12 | 11.2%(+15.7)#790 |
| 13. | 72134 | 26.8% | 10.4%(+16.3)#13 | 11.2%(+15.5)#801 |
| 14. | 72180 | 26.7% | 10.4%(+16.3)#14 | 11.2%(+15.5)#808 |
| 15. | 72561 | 25.2% | 10.4%(+14.8)#15 | 11.2%(+14.0)#945 |
| 16. | 72342 | 25.1% | 10.4%(+14.6)#16 | 11.2%(+13.8)#967 |
| 17. | 72325 | 25.0% | 10.4%(+14.6)#17 | 11.2%(+13.8)#987 |
| 18. | 72633 | 24.4% | 10.4%(+13.9)#18 | 11.2%(+13.1)#1,060 |
| 19. | 72644 | 22.7% | 10.4%(+12.3)#19 | 11.2%(+11.5)#1,321 |
| 20. | 72414 | 22.2% | 10.4%(+11.8)#20 | 11.2%(+11.0)#1,424 |
| 21. | 72072 | 21.7% | 10.4%(+11.3)#21 | 11.2%(+10.5)#1,532 |
| 22. | 72039 | 21.4% | 10.4%(+11.0)#22 | 11.2%(+10.2)#1,605 |
| 23. | 72374 | 21.4% | 10.4%(+11.0)#23 | 11.2%(+10.2)#1,608 |
| 24. | 72640 | 20.8% | 10.4%(+10.4)#24 | 11.2%(+9.62)#1,765 |
| 25. | 71630 | 20.7% | 10.4%(+10.3)#25 | 11.2%(+9.48)#1,813 |
| 26. | 72648 | 20.6% | 10.4%(+10.2)#26 | 11.2%(+9.36)#1,844 |
| 27. | 72017 | 20.5% | 10.4%(+10.1)#27 | 11.2%(+9.26)#1,876 |
| 28. | 71970 | 20.4% | 10.4%(+9.98)#28 | 11.2%(+9.18)#1,910 |
| 29. | 71971 | 20.2% | 10.4%(+9.83)#29 | 11.2%(+9.02)#1,942 |
| 30. | 72128 | 20.2% | 10.4%(+9.80)#30 | 11.2%(+8.99)#1,952 |
| 31. | 72704 | 19.8% | 10.4%(+9.39)#31 | 11.2%(+8.58)#2,091 |
| 32. | 71833 | 19.7% | 10.4%(+9.32)#32 | 11.2%(+8.52)#2,113 |
| 33. | 71749 | 19.7% | 10.4%(+9.26)#33 | 11.2%(+8.46)#2,137 |
| 34. | 72457 | 19.7% | 10.4%(+9.25)#34 | 11.2%(+8.44)#2,142 |
| 35. | 72683 | 19.6% | 10.4%(+9.18)#35 | 11.2%(+8.38)#2,163 |
| 36. | 72670 | 19.5% | 10.4%(+9.14)#36 | 11.2%(+8.33)#2,184 |
| 37. | 72928 | 19.5% | 10.4%(+9.07)#37 | 11.2%(+8.27)#2,205 |
| 38. | 72752 | 19.4% | 10.4%(+9.03)#38 | 11.2%(+8.23)#2,217 |
| 39. | 72207 | 19.3% | 10.4%(+8.93)#39 | 11.2%(+8.13)#2,259 |
| 40. | 72458 | 19.0% | 10.4%(+8.59)#40 | 11.2%(+7.79)#2,395 |
| 41. | 72934 | 18.7% | 10.4%(+8.28)#41 | 11.2%(+7.47)#2,514 |
| 42. | 72556 | 18.3% | 10.4%(+7.86)#42 | 11.2%(+7.06)#2,683 |
| 43. | 71923 | 18.2% | 10.4%(+7.82)#43 | 11.2%(+7.01)#2,704 |
| 44. | 72004 | 18.2% | 10.4%(+7.74)#44 | 11.2%(+6.94)#2,743 |
| 45. | 72843 | 17.7% | 10.4%(+7.32)#45 | 11.2%(+6.51)#2,957 |
| 46. | 71838 | 17.7% | 10.4%(+7.25)#46 | 11.2%(+6.45)#2,990 |
| 47. | 72445 | 17.6% | 10.4%(+7.24)#47 | 11.2%(+6.43)#3,003 |
| 48. | 71921 | 17.6% | 10.4%(+7.17)#48 | 11.2%(+6.37)#3,024 |
| 49. | 72675 | 17.4% | 10.4%(+6.98)#49 | 11.2%(+6.18)#3,123 |
| 50. | 71960 | 17.2% | 10.4%(+6.83)#50 | 11.2%(+6.02)#3,226 |
| 51. | 72703 | 17.2% | 10.4%(+6.79)#51 | 11.2%(+5.98)#3,249 |
| 52. | 71654 | 17.2% | 10.4%(+6.78)#52 | 11.2%(+5.98)#3,255 |
| 53. | 71655 | 17.1% | 10.4%(+6.66)#53 | 11.2%(+5.86)#3,329 |
| 54. | 72330 | 17.0% | 10.4%(+6.63)#54 | 11.2%(+5.82)#3,356 |
| 55. | 72143 | 17.0% | 10.4%(+6.58)#55 | 11.2%(+5.78)#3,382 |
| 56. | 72227 | 17.0% | 10.4%(+6.57)#56 | 11.2%(+5.76)#3,395 |
| 57. | 72802 | 16.9% | 10.4%(+6.53)#57 | 11.2%(+5.73)#3,419 |
| 58. | 71652 | 16.7% | 10.4%(+6.32)#58 | 11.2%(+5.52)#3,549 |
| 59. | 71770 | 16.7% | 10.4%(+6.26)#59 | 11.2%(+5.45)#3,584 |
| 60. | 72845 | 16.7% | 10.4%(+6.26)#60 | 11.2%(+5.45)#3,588 |
| 61. | 72205 | 16.5% | 10.4%(+6.13)#61 | 11.2%(+5.32)#3,670 |
| 62. | 72631 | 16.4% | 10.4%(+6.01)#62 | 11.2%(+5.21)#3,748 |
| 63. | 71998 | 16.4% | 10.4%(+6.00)#63 | 11.2%(+5.20)#3,753 |
| 64. | 72730 | 16.4% | 10.4%(+5.96)#64 | 11.2%(+5.15)#3,794 |
| 65. | 71762 | 16.3% | 10.4%(+5.92)#65 | 11.2%(+5.12)#3,820 |
| 66. | 72938 | 16.2% | 10.4%(+5.83)#66 | 11.2%(+5.03)#3,876 |
| 67. | 71647 | 16.1% | 10.4%(+5.74)#67 | 11.2%(+4.93)#3,954 |
| 68. | 72365 | 16.0% | 10.4%(+5.56)#68 | 11.2%(+4.76)#4,090 |
| 69. | 71825 | 15.8% | 10.4%(+5.42)#69 | 11.2%(+4.61)#4,211 |
| 70. | 72007 | 15.8% | 10.4%(+5.37)#70 | 11.2%(+4.56)#4,271 |
| 71. | 72212 | 15.8% | 10.4%(+5.36)#71 | 11.2%(+4.56)#4,273 |
| 72. | 72223 | 15.6% | 10.4%(+5.15)#72 | 11.2%(+4.35)#4,441 |
| 73. | 72327 | 15.3% | 10.4%(+4.91)#73 | 11.2%(+4.11)#4,685 |
| 74. | 71642 | 15.3% | 10.4%(+4.90)#74 | 11.2%(+4.09)#4,695 |
| 75. | 72936 | 15.2% | 10.4%(+4.77)#75 | 11.2%(+3.96)#4,810 |
| 76. | 71969 | 15.1% | 10.4%(+4.71)#76 | 11.2%(+3.90)#4,857 |
| 77. | 72773 | 15.0% | 10.4%(+4.59)#77 | 11.2%(+3.79)#4,960 |
| 78. | 72701 | 14.9% | 10.4%(+4.47)#78 | 11.2%(+3.67)#5,073 |
| 79. | 72070 | 14.9% | 10.4%(+4.46)#79 | 11.2%(+3.66)#5,083 |
| 80. | 71935 | 14.7% | 10.4%(+4.28)#80 | 11.2%(+3.48)#5,267 |
| 81. | 72444 | 14.7% | 10.4%(+4.25)#81 | 11.2%(+3.45)#5,303 |
| 82. | 72687 | 14.6% | 10.4%(+4.21)#82 | 11.2%(+3.40)#5,346 |
| 83. | 72157 | 14.6% | 10.4%(+4.14)#83 | 11.2%(+3.34)#5,430 |
| 84. | 72040 | 14.4% | 10.4%(+4.03)#84 | 11.2%(+3.23)#5,544 |
| 85. | 72581 | 14.4% | 10.4%(+4.00)#85 | 11.2%(+3.19)#5,582 |
| 86. | 72405 | 14.3% | 10.4%(+3.93)#86 | 11.2%(+3.12)#5,661 |
| 87. | 71725 | 14.3% | 10.4%(+3.88)#87 | 11.2%(+3.07)#5,726 |
| 88. | 72427 | 14.3% | 10.4%(+3.88)#88 | 11.2%(+3.07)#5,736 |
| 89. | 72042 | 14.2% | 10.4%(+3.79)#89 | 11.2%(+2.99)#5,829 |
| 90. | 72136 | 14.2% | 10.4%(+3.77)#90 | 11.2%(+2.97)#5,853 |
| 91. | 72519 | 14.2% | 10.4%(+3.76)#91 | 11.2%(+2.96)#5,865 |
| 92. | 72030 | 14.1% | 10.4%(+3.72)#92 | 11.2%(+2.91)#5,932 |
| 93. | 72102 | 14.0% | 10.4%(+3.63)#93 | 11.2%(+2.83)#6,037 |
| 94. | 72116 | 13.9% | 10.4%(+3.45)#94 | 11.2%(+2.65)#6,260 |
| 95. | 72211 | 13.8% | 10.4%(+3.40)#95 | 11.2%(+2.59)#6,334 |
| 96. | 71663 | 13.8% | 10.4%(+3.38)#96 | 11.2%(+2.58)#6,351 |
| 97. | 72846 | 13.8% | 10.4%(+3.34)#97 | 11.2%(+2.54)#6,417 |
| 98. | 72333 | 13.7% | 10.4%(+3.33)#98 | 11.2%(+2.53)#6,432 |
| 99. | 72542 | 13.6% | 10.4%(+3.21)#99 | 11.2%(+2.40)#6,593 |
| 100. | 72395 | 13.6% | 10.4%(+3.15)#100 | 11.2%(+2.34)#6,672 |
Common Questions
What are the Top 10 Zip Codes with the Highest Percentage of Population Employed in Community & Social Service in Arkansas?
Top 10 Zip Codes with the Highest Percentage of Population Employed in Community & Social Service in Arkansas are:
What zip code has the Highest Percentage of Population Employed in Community & Social Service in Arkansas?
72524 has the Highest Percentage of Population Employed in Community & Social Service in Arkansas with 60.3%.
What is the Percentage of Population Employed in Community & Social Service in the State of Arkansas?
Percentage of Population Employed in Community & Social Service in Arkansas is 10.4%.
What is the Percentage of Population Employed in Community & Social Service in the United States?
Percentage of Population Employed in Community & Social Service in the United States is 11.2%.