Zip Codes with the Highest Percentage of Population Employed in Community & Social Service in Colorado
RELATED REPORTS & OPTIONS
Community & Social Service
Colorado
Compare Zip Codes
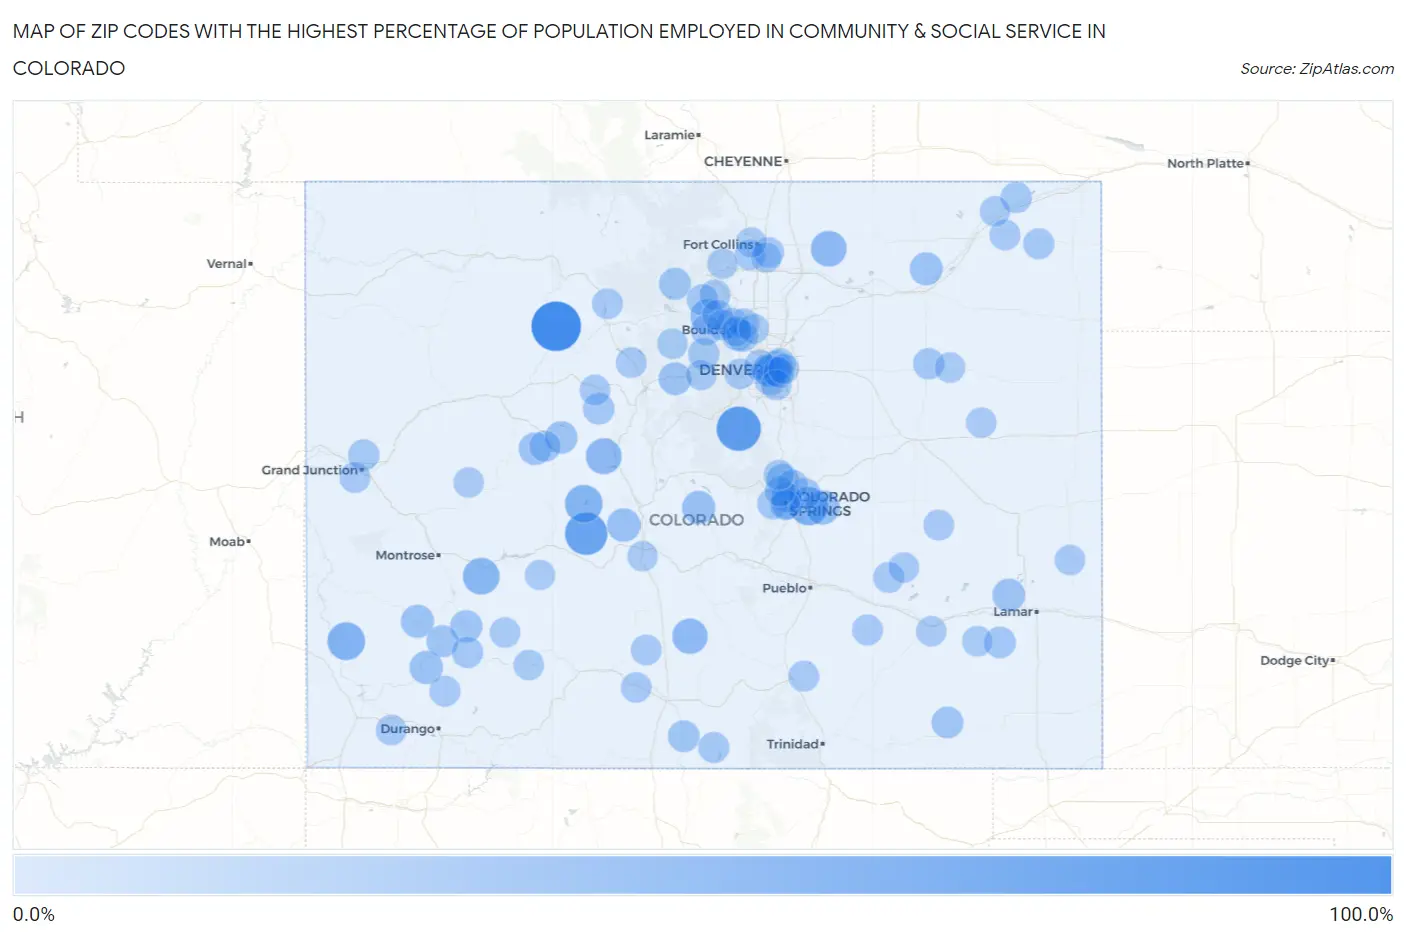
Map of Zip Codes with the Highest Percentage of Population Employed in Community & Social Service in Colorado
0.0%
100.0%
Zip Codes with the Highest Percentage of Population Employed in Community & Social Service in Colorado
| Zip Code | % Employed | vs State | vs National | |
| 1. | 80479 | 100.0% | 11.2%(+88.8)#1 | 11.2%(+88.8)#25 |
| 2. | 80425 | 76.0% | 11.2%(+64.8)#2 | 11.2%(+64.8)#46 |
| 3. | 81237 | 67.2% | 11.2%(+55.9)#3 | 11.2%(+55.9)#62 |
| 4. | 80929 | 50.0% | 11.2%(+38.8)#4 | 11.2%(+38.8)#160 |
| 5. | 81325 | 46.7% | 11.2%(+35.4)#5 | 11.2%(+35.5)#198 |
| 6. | 81210 | 46.1% | 11.2%(+34.8)#6 | 11.2%(+34.9)#208 |
| 7. | 81220 | 42.5% | 11.2%(+31.3)#7 | 11.2%(+31.3)#254 |
| 8. | 81251 | 38.5% | 11.2%(+27.2)#8 | 11.2%(+27.2)#317 |
| 9. | 80622 | 38.1% | 11.2%(+26.9)#9 | 11.2%(+26.9)#325 |
| 10. | 81131 | 36.4% | 11.2%(+25.2)#10 | 11.2%(+25.2)#362 |
| 11. | 80930 | 31.7% | 11.2%(+20.5)#11 | 11.2%(+20.5)#503 |
| 12. | 80481 | 30.9% | 11.2%(+19.7)#12 | 11.2%(+19.7)#544 |
| 13. | 81236 | 28.6% | 11.2%(+17.3)#13 | 11.2%(+17.4)#657 |
| 14. | 80820 | 27.6% | 11.2%(+16.4)#14 | 11.2%(+16.4)#718 |
| 15. | 81332 | 27.3% | 11.2%(+16.1)#15 | 11.2%(+16.1)#741 |
| 16. | 81430 | 26.6% | 11.2%(+15.3)#16 | 11.2%(+15.3)#817 |
| 17. | 80750 | 26.1% | 11.2%(+14.9)#17 | 11.2%(+14.9)#856 |
| 18. | 80476 | 25.2% | 11.2%(+14.0)#18 | 11.2%(+14.0)#942 |
| 19. | 81092 | 24.9% | 11.2%(+13.7)#19 | 11.2%(+13.7)#990 |
| 20. | 81654 | 24.4% | 11.2%(+13.2)#20 | 11.2%(+13.2)#1,054 |
| 21. | 81656 | 24.1% | 11.2%(+12.8)#21 | 11.2%(+12.9)#1,098 |
| 22. | 81427 | 23.0% | 11.2%(+11.7)#22 | 11.2%(+11.8)#1,280 |
| 23. | 80840 | 21.9% | 11.2%(+10.7)#23 | 11.2%(+10.7)#1,490 |
| 24. | 81426 | 21.4% | 11.2%(+10.2)#24 | 11.2%(+10.2)#1,609 |
| 25. | 80447 | 21.4% | 11.2%(+10.2)#25 | 11.2%(+10.2)#1,612 |
| 26. | 80305 | 21.1% | 11.2%(+9.87)#26 | 11.2%(+9.90)#1,683 |
| 27. | 81151 | 20.7% | 11.2%(+9.44)#27 | 11.2%(+9.47)#1,817 |
| 28. | 81049 | 20.6% | 11.2%(+9.35)#28 | 11.2%(+9.37)#1,840 |
| 29. | 81044 | 20.5% | 11.2%(+9.27)#29 | 11.2%(+9.30)#1,862 |
| 30. | 81645 | 19.9% | 11.2%(+8.69)#30 | 11.2%(+8.72)#2,041 |
| 31. | 80207 | 19.4% | 11.2%(+8.18)#31 | 11.2%(+8.21)#2,228 |
| 32. | 80304 | 19.4% | 11.2%(+8.16)#32 | 11.2%(+8.19)#2,234 |
| 33. | 80510 | 19.3% | 11.2%(+8.04)#33 | 11.2%(+8.06)#2,281 |
| 34. | 80757 | 19.2% | 11.2%(+7.95)#34 | 11.2%(+7.98)#2,313 |
| 35. | 81433 | 19.0% | 11.2%(+7.79)#35 | 11.2%(+7.82)#2,385 |
| 36. | 80218 | 19.0% | 11.2%(+7.72)#36 | 11.2%(+7.75)#2,408 |
| 37. | 80303 | 18.8% | 11.2%(+7.56)#37 | 11.2%(+7.59)#2,467 |
| 38. | 80726 | 18.8% | 11.2%(+7.51)#38 | 11.2%(+7.54)#2,492 |
| 39. | 81506 | 18.7% | 11.2%(+7.42)#39 | 11.2%(+7.44)#2,531 |
| 40. | 80422 | 18.4% | 11.2%(+7.18)#40 | 11.2%(+7.21)#2,622 |
| 41. | 80206 | 18.2% | 11.2%(+6.93)#41 | 11.2%(+6.95)#2,739 |
| 42. | 80938 | 18.1% | 11.2%(+6.84)#42 | 11.2%(+6.87)#2,777 |
| 43. | 80903 | 17.9% | 11.2%(+6.63)#43 | 11.2%(+6.66)#2,892 |
| 44. | 81615 | 17.8% | 11.2%(+6.55)#44 | 11.2%(+6.57)#2,921 |
| 45. | 80731 | 17.3% | 11.2%(+6.10)#45 | 11.2%(+6.12)#3,164 |
| 46. | 81152 | 17.3% | 11.2%(+6.06)#46 | 11.2%(+6.09)#3,183 |
| 47. | 80290 | 17.2% | 11.2%(+5.92)#47 | 11.2%(+5.95)#3,273 |
| 48. | 80466 | 17.1% | 11.2%(+5.88)#48 | 11.2%(+5.91)#3,303 |
| 49. | 81062 | 17.1% | 11.2%(+5.87)#49 | 11.2%(+5.89)#3,311 |
| 50. | 81039 | 17.1% | 11.2%(+5.84)#50 | 11.2%(+5.87)#3,325 |
| 51. | 80238 | 17.0% | 11.2%(+5.80)#51 | 11.2%(+5.83)#3,353 |
| 52. | 80829 | 17.0% | 11.2%(+5.78)#52 | 11.2%(+5.81)#3,370 |
| 53. | 81089 | 17.0% | 11.2%(+5.75)#53 | 11.2%(+5.77)#3,386 |
| 54. | 80920 | 16.9% | 11.2%(+5.71)#54 | 11.2%(+5.73)#3,416 |
| 55. | 81301 | 16.9% | 11.2%(+5.66)#55 | 11.2%(+5.68)#3,450 |
| 56. | 80540 | 16.9% | 11.2%(+5.64)#56 | 11.2%(+5.67)#3,464 |
| 57. | 80459 | 16.9% | 11.2%(+5.61)#57 | 11.2%(+5.64)#3,476 |
| 58. | 81507 | 16.8% | 11.2%(+5.61)#58 | 11.2%(+5.63)#3,480 |
| 59. | 80302 | 16.8% | 11.2%(+5.59)#59 | 11.2%(+5.61)#3,493 |
| 60. | 80526 | 16.8% | 11.2%(+5.53)#60 | 11.2%(+5.56)#3,532 |
| 61. | 80210 | 16.8% | 11.2%(+5.52)#61 | 11.2%(+5.55)#3,537 |
| 62. | 80728 | 16.6% | 11.2%(+5.40)#62 | 11.2%(+5.42)#3,624 |
| 63. | 81125 | 16.6% | 11.2%(+5.33)#63 | 11.2%(+5.35)#3,656 |
| 64. | 81620 | 16.6% | 11.2%(+5.32)#64 | 11.2%(+5.35)#3,659 |
| 65. | 80301 | 16.4% | 11.2%(+5.14)#65 | 11.2%(+5.16)#3,784 |
| 66. | 80498 | 16.3% | 11.2%(+5.01)#66 | 11.2%(+5.04)#3,868 |
| 67. | 80547 | 16.2% | 11.2%(+4.96)#67 | 11.2%(+4.99)#3,917 |
| 68. | 80823 | 16.1% | 11.2%(+4.89)#68 | 11.2%(+4.91)#3,974 |
| 69. | 80455 | 16.0% | 11.2%(+4.73)#69 | 11.2%(+4.75)#4,092 |
| 70. | 80907 | 16.0% | 11.2%(+4.72)#70 | 11.2%(+4.75)#4,098 |
| 71. | 81328 | 15.9% | 11.2%(+4.68)#71 | 11.2%(+4.71)#4,129 |
| 72. | 81063 | 15.9% | 11.2%(+4.65)#72 | 11.2%(+4.68)#4,157 |
| 73. | 80220 | 15.8% | 11.2%(+4.58)#73 | 11.2%(+4.61)#4,217 |
| 74. | 81144 | 15.8% | 11.2%(+4.51)#74 | 11.2%(+4.54)#4,290 |
| 75. | 81054 | 15.7% | 11.2%(+4.47)#75 | 11.2%(+4.50)#4,321 |
| 76. | 80482 | 15.7% | 11.2%(+4.46)#76 | 11.2%(+4.49)#4,330 |
| 77. | 80212 | 15.6% | 11.2%(+4.37)#77 | 11.2%(+4.40)#4,406 |
| 78. | 80401 | 15.6% | 11.2%(+4.35)#78 | 11.2%(+4.38)#4,417 |
| 79. | 80310 | 15.6% | 11.2%(+4.33)#79 | 11.2%(+4.36)#4,430 |
| 80. | 80230 | 15.5% | 11.2%(+4.31)#80 | 11.2%(+4.33)#4,453 |
| 81. | 81071 | 15.5% | 11.2%(+4.29)#81 | 11.2%(+4.32)#4,470 |
| 82. | 80237 | 15.5% | 11.2%(+4.27)#82 | 11.2%(+4.30)#4,491 |
| 83. | 80515 | 15.5% | 11.2%(+4.22)#83 | 11.2%(+4.25)#4,545 |
| 84. | 80528 | 15.4% | 11.2%(+4.21)#84 | 11.2%(+4.23)#4,563 |
| 85. | 81050 | 15.4% | 11.2%(+4.19)#85 | 11.2%(+4.22)#4,576 |
| 86. | 81235 | 15.4% | 11.2%(+4.17)#86 | 11.2%(+4.19)#4,596 |
| 87. | 80740 | 15.4% | 11.2%(+4.14)#87 | 11.2%(+4.17)#4,623 |
| 88. | 80045 | 15.3% | 11.2%(+4.10)#88 | 11.2%(+4.12)#4,668 |
| 89. | 80452 | 15.3% | 11.2%(+4.06)#89 | 11.2%(+4.08)#4,702 |
| 90. | 80815 | 15.2% | 11.2%(+4.01)#90 | 11.2%(+4.04)#4,752 |
| 91. | 80521 | 15.2% | 11.2%(+3.97)#91 | 11.2%(+4.00)#4,787 |
| 92. | 80905 | 15.1% | 11.2%(+3.89)#92 | 11.2%(+3.91)#4,848 |
| 93. | 81428 | 15.1% | 11.2%(+3.85)#93 | 11.2%(+3.87)#4,887 |
| 94. | 80736 | 15.1% | 11.2%(+3.81)#94 | 11.2%(+3.84)#4,914 |
| 95. | 80919 | 15.0% | 11.2%(+3.79)#95 | 11.2%(+3.82)#4,934 |
| 96. | 81130 | 15.0% | 11.2%(+3.77)#96 | 11.2%(+3.80)#4,947 |
| 97. | 81242 | 15.0% | 11.2%(+3.77)#97 | 11.2%(+3.79)#4,953 |
| 98. | 80026 | 14.9% | 11.2%(+3.68)#98 | 11.2%(+3.71)#5,037 |
| 99. | 80921 | 14.8% | 11.2%(+3.53)#99 | 11.2%(+3.56)#5,186 |
| 100. | 81230 | 14.6% | 11.2%(+3.37)#100 | 11.2%(+3.39)#5,357 |
Common Questions
What are the Top 10 Zip Codes with the Highest Percentage of Population Employed in Community & Social Service in Colorado?
Top 10 Zip Codes with the Highest Percentage of Population Employed in Community & Social Service in Colorado are:
What zip code has the Highest Percentage of Population Employed in Community & Social Service in Colorado?
80479 has the Highest Percentage of Population Employed in Community & Social Service in Colorado with 100.0%.
What is the Percentage of Population Employed in Community & Social Service in the State of Colorado?
Percentage of Population Employed in Community & Social Service in Colorado is 11.2%.
What is the Percentage of Population Employed in Community & Social Service in the United States?
Percentage of Population Employed in Community & Social Service in the United States is 11.2%.