Zip Codes with the Highest Percentage of Population Employed in Community & Social Service in Georgia
RELATED REPORTS & OPTIONS
Community & Social Service
Georgia
Compare Zip Codes
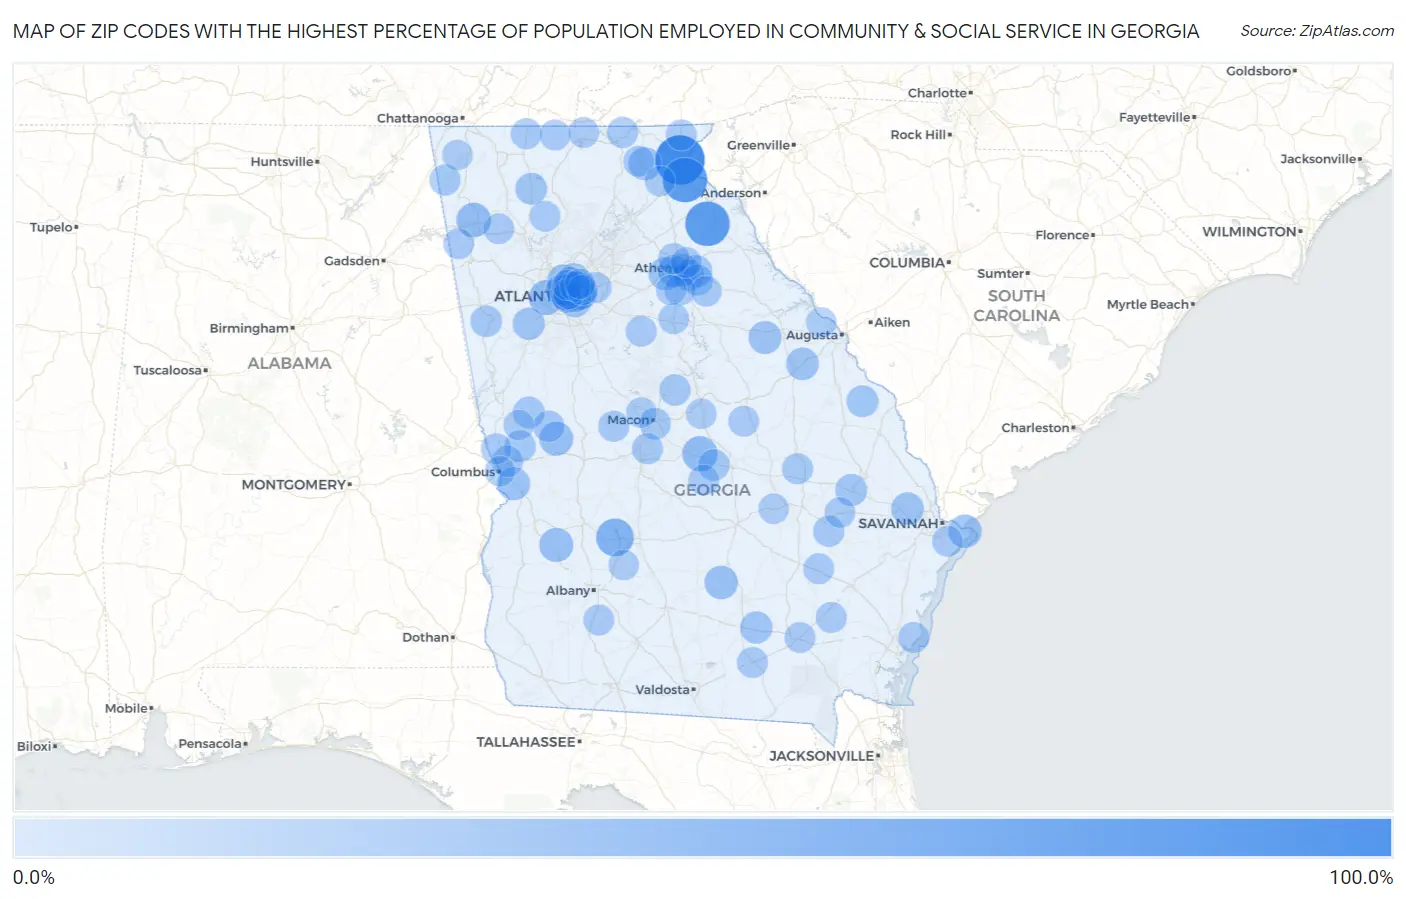
Map of Zip Codes with the Highest Percentage of Population Employed in Community & Social Service in Georgia
0.0%
100.0%
Zip Codes with the Highest Percentage of Population Employed in Community & Social Service in Georgia
| Zip Code | % Employed | vs State | vs National | |
| 1. | 30573 | 85.5% | 11.0%(+74.5)#1 | 11.2%(+74.2)#33 |
| 2. | 30598 | 66.7% | 11.0%(+55.7)#2 | 11.2%(+55.5)#64 |
| 3. | 30639 | 66.7% | 11.0%(+55.7)#3 | 11.2%(+55.5)#65 |
| 4. | 31735 | 41.3% | 11.0%(+30.3)#4 | 11.2%(+30.1)#272 |
| 5. | 31003 | 31.8% | 11.0%(+20.9)#5 | 11.2%(+20.6)#497 |
| 6. | 30332 | 31.0% | 11.0%(+20.0)#6 | 11.2%(+19.7)#536 |
| 7. | 30336 | 30.4% | 11.0%(+19.5)#7 | 11.2%(+19.2)#567 |
| 8. | 30149 | 29.7% | 11.0%(+18.7)#8 | 11.2%(+18.5)#603 |
| 9. | 39877 | 27.2% | 11.0%(+16.2)#9 | 11.2%(+16.0)#746 |
| 10. | 31827 | 27.0% | 11.0%(+16.0)#10 | 11.2%(+15.7)#779 |
| 11. | 31798 | 25.5% | 11.0%(+14.6)#11 | 11.2%(+14.3)#915 |
| 12. | 30030 | 25.3% | 11.0%(+14.3)#12 | 11.2%(+14.0)#939 |
| 13. | 31328 | 25.1% | 11.0%(+14.2)#13 | 11.2%(+13.9)#955 |
| 14. | 30327 | 25.0% | 11.0%(+14.1)#14 | 11.2%(+13.8)#969 |
| 15. | 30571 | 24.1% | 11.0%(+13.2)#15 | 11.2%(+12.9)#1,091 |
| 16. | 31905 | 23.6% | 11.0%(+12.7)#16 | 11.2%(+12.4)#1,161 |
| 17. | 30807 | 23.5% | 11.0%(+12.5)#17 | 11.2%(+12.3)#1,201 |
| 18. | 30622 | 23.4% | 11.0%(+12.5)#18 | 11.2%(+12.2)#1,207 |
| 19. | 31307 | 23.1% | 11.0%(+12.1)#19 | 11.2%(+11.9)#1,264 |
| 20. | 30818 | 22.5% | 11.0%(+11.5)#20 | 11.2%(+11.3)#1,365 |
| 21. | 30307 | 22.3% | 11.0%(+11.3)#21 | 11.2%(+11.0)#1,405 |
| 22. | 30306 | 21.2% | 11.0%(+10.2)#22 | 11.2%(+9.94)#1,673 |
| 23. | 30268 | 21.0% | 11.0%(+10.0)#23 | 11.2%(+9.74)#1,722 |
| 24. | 31624 | 20.8% | 11.0%(+9.90)#24 | 11.2%(+9.64)#1,756 |
| 25. | 30316 | 20.7% | 11.0%(+9.78)#25 | 11.2%(+9.52)#1,799 |
| 26. | 30683 | 20.5% | 11.0%(+9.51)#26 | 11.2%(+9.25)#1,881 |
| 27. | 30452 | 20.2% | 11.0%(+9.20)#27 | 11.2%(+8.94)#1,969 |
| 28. | 30602 | 20.1% | 11.0%(+9.19)#28 | 11.2%(+8.93)#1,974 |
| 29. | 30606 | 20.1% | 11.0%(+9.17)#29 | 11.2%(+8.91)#1,980 |
| 30. | 30002 | 19.8% | 11.0%(+8.82)#30 | 11.2%(+8.56)#2,100 |
| 31. | 30033 | 19.6% | 11.0%(+8.68)#31 | 11.2%(+8.42)#2,150 |
| 32. | 30456 | 19.6% | 11.0%(+8.64)#32 | 11.2%(+8.38)#2,164 |
| 33. | 30317 | 19.6% | 11.0%(+8.63)#33 | 11.2%(+8.37)#2,166 |
| 34. | 30734 | 19.5% | 11.0%(+8.52)#34 | 11.2%(+8.25)#2,208 |
| 35. | 31830 | 19.2% | 11.0%(+8.27)#35 | 11.2%(+8.01)#2,300 |
| 36. | 30605 | 19.1% | 11.0%(+8.19)#36 | 11.2%(+7.93)#2,337 |
| 37. | 30322 | 19.1% | 11.0%(+8.10)#37 | 11.2%(+7.84)#2,373 |
| 38. | 31201 | 18.9% | 11.0%(+7.96)#38 | 11.2%(+7.70)#2,428 |
| 39. | 31807 | 18.8% | 11.0%(+7.85)#39 | 11.2%(+7.59)#2,466 |
| 40. | 30118 | 18.5% | 11.0%(+7.53)#40 | 11.2%(+7.27)#2,599 |
| 41. | 31022 | 18.4% | 11.0%(+7.44)#41 | 11.2%(+7.18)#2,640 |
| 42. | 30324 | 18.3% | 11.0%(+7.37)#42 | 11.2%(+7.11)#2,665 |
| 43. | 30363 | 18.2% | 11.0%(+7.22)#43 | 11.2%(+6.96)#2,735 |
| 44. | 30309 | 18.1% | 11.0%(+7.14)#44 | 11.2%(+6.87)#2,775 |
| 45. | 31836 | 18.0% | 11.0%(+7.00)#45 | 11.2%(+6.74)#2,834 |
| 46. | 31033 | 17.8% | 11.0%(+6.87)#46 | 11.2%(+6.61)#2,910 |
| 47. | 30318 | 17.7% | 11.0%(+6.72)#47 | 11.2%(+6.46)#2,986 |
| 48. | 30607 | 17.5% | 11.0%(+6.52)#48 | 11.2%(+6.26)#3,074 |
| 49. | 30319 | 17.2% | 11.0%(+6.29)#49 | 11.2%(+6.03)#3,221 |
| 50. | 30453 | 17.2% | 11.0%(+6.23)#50 | 11.2%(+5.97)#3,260 |
| 51. | 31028 | 17.1% | 11.0%(+6.17)#51 | 11.2%(+5.91)#3,302 |
| 52. | 30731 | 17.0% | 11.0%(+6.09)#52 | 11.2%(+5.83)#3,352 |
| 53. | 30582 | 17.0% | 11.0%(+6.08)#53 | 11.2%(+5.82)#3,361 |
| 54. | 31909 | 17.0% | 11.0%(+6.04)#54 | 11.2%(+5.77)#3,385 |
| 55. | 30313 | 16.7% | 11.0%(+5.75)#55 | 11.2%(+5.49)#3,563 |
| 56. | 30448 | 16.7% | 11.0%(+5.71)#56 | 11.2%(+5.45)#3,612 |
| 57. | 31066 | 16.6% | 11.0%(+5.66)#57 | 11.2%(+5.40)#3,637 |
| 58. | 30619 | 16.6% | 11.0%(+5.64)#58 | 11.2%(+5.38)#3,640 |
| 59. | 30711 | 16.5% | 11.0%(+5.51)#59 | 11.2%(+5.24)#3,729 |
| 60. | 31634 | 16.4% | 11.0%(+5.40)#60 | 11.2%(+5.14)#3,800 |
| 61. | 30677 | 16.3% | 11.0%(+5.33)#61 | 11.2%(+5.07)#3,851 |
| 62. | 31522 | 16.2% | 11.0%(+5.29)#62 | 11.2%(+5.03)#3,879 |
| 63. | 30601 | 16.2% | 11.0%(+5.28)#63 | 11.2%(+5.02)#3,883 |
| 64. | 31563 | 16.2% | 11.0%(+5.27)#64 | 11.2%(+5.01)#3,892 |
| 65. | 30326 | 16.2% | 11.0%(+5.27)#65 | 11.2%(+5.01)#3,893 |
| 66. | 30055 | 16.2% | 11.0%(+5.25)#66 | 11.2%(+4.99)#3,912 |
| 67. | 30562 | 16.2% | 11.0%(+5.24)#67 | 11.2%(+4.98)#3,926 |
| 68. | 31716 | 16.2% | 11.0%(+5.21)#68 | 11.2%(+4.95)#3,941 |
| 69. | 31557 | 16.1% | 11.0%(+5.19)#69 | 11.2%(+4.93)#3,959 |
| 70. | 31089 | 16.1% | 11.0%(+5.14)#70 | 11.2%(+4.88)#3,999 |
| 71. | 30545 | 16.0% | 11.0%(+5.07)#71 | 11.2%(+4.81)#4,057 |
| 72. | 30183 | 16.0% | 11.0%(+5.03)#72 | 11.2%(+4.76)#4,079 |
| 73. | 30312 | 15.9% | 11.0%(+4.99)#73 | 11.2%(+4.73)#4,109 |
| 74. | 30650 | 15.8% | 11.0%(+4.86)#74 | 11.2%(+4.60)#4,229 |
| 75. | 30541 | 15.8% | 11.0%(+4.85)#75 | 11.2%(+4.59)#4,237 |
| 76. | 30308 | 15.8% | 11.0%(+4.81)#76 | 11.2%(+4.55)#4,280 |
| 77. | 31501 | 15.7% | 11.0%(+4.73)#77 | 11.2%(+4.47)#4,352 |
| 78. | 30667 | 15.6% | 11.0%(+4.70)#78 | 11.2%(+4.44)#4,379 |
| 79. | 30145 | 15.5% | 11.0%(+4.58)#79 | 11.2%(+4.32)#4,473 |
| 80. | 31411 | 15.5% | 11.0%(+4.50)#80 | 11.2%(+4.24)#4,553 |
| 81. | 30124 | 15.4% | 11.0%(+4.49)#81 | 11.2%(+4.23)#4,573 |
| 82. | 30559 | 15.4% | 11.0%(+4.44)#82 | 11.2%(+4.18)#4,603 |
| 83. | 31808 | 15.4% | 11.0%(+4.40)#83 | 11.2%(+4.14)#4,659 |
| 84. | 30087 | 15.3% | 11.0%(+4.31)#84 | 11.2%(+4.05)#4,742 |
| 85. | 31012 | 15.2% | 11.0%(+4.29)#85 | 11.2%(+4.03)#4,757 |
| 86. | 30414 | 15.1% | 11.0%(+4.14)#86 | 11.2%(+3.88)#4,882 |
| 87. | 30305 | 14.8% | 11.0%(+3.82)#87 | 11.2%(+3.56)#5,184 |
| 88. | 30535 | 14.7% | 11.0%(+3.78)#88 | 11.2%(+3.52)#5,229 |
| 89. | 30621 | 14.7% | 11.0%(+3.72)#89 | 11.2%(+3.46)#5,288 |
| 90. | 30707 | 14.6% | 11.0%(+3.67)#90 | 11.2%(+3.41)#5,333 |
| 91. | 31796 | 14.5% | 11.0%(+3.57)#91 | 11.2%(+3.31)#5,452 |
| 92. | 31054 | 14.5% | 11.0%(+3.57)#92 | 11.2%(+3.31)#5,455 |
| 93. | 31823 | 14.5% | 11.0%(+3.50)#93 | 11.2%(+3.24)#5,531 |
| 94. | 30329 | 14.4% | 11.0%(+3.49)#94 | 11.2%(+3.23)#5,542 |
| 95. | 31901 | 14.4% | 11.0%(+3.46)#95 | 11.2%(+3.20)#5,573 |
| 96. | 31210 | 14.3% | 11.0%(+3.39)#96 | 11.2%(+3.13)#5,657 |
| 97. | 30079 | 14.3% | 11.0%(+3.38)#97 | 11.2%(+3.12)#5,669 |
| 98. | 30445 | 14.3% | 11.0%(+3.35)#98 | 11.2%(+3.09)#5,697 |
| 99. | 30809 | 14.3% | 11.0%(+3.34)#99 | 11.2%(+3.08)#5,698 |
| 100. | 30345 | 14.3% | 11.0%(+3.31)#100 | 11.2%(+3.05)#5,757 |
Common Questions
What are the Top 10 Zip Codes with the Highest Percentage of Population Employed in Community & Social Service in Georgia?
Top 10 Zip Codes with the Highest Percentage of Population Employed in Community & Social Service in Georgia are:
What zip code has the Highest Percentage of Population Employed in Community & Social Service in Georgia?
30573 has the Highest Percentage of Population Employed in Community & Social Service in Georgia with 85.5%.
What is the Percentage of Population Employed in Community & Social Service in the State of Georgia?
Percentage of Population Employed in Community & Social Service in Georgia is 11.0%.
What is the Percentage of Population Employed in Community & Social Service in the United States?
Percentage of Population Employed in Community & Social Service in the United States is 11.2%.