Staves, AR Map & Demographics
Staves Map
Staves Overview
$53,932
PER CAPITA INCOME
$167,841
AVG FAMILY INCOME
0.37
INEQUALITY / GINI INDEX
145
TOTAL POPULATION
111
MALE POPULATION
34
FEMALE POPULATION
326.47
MALES / 100 FEMALES
30.63
FEMALES / 100 MALES
57.2
MEDIAN AGE
3.0
AVG FAMILY SIZE
2.1
AVG HOUSEHOLD SIZE
64
LABOR FORCE [ PEOPLE ]
44.1%
PERCENT IN LABOR FORCE
Income in Staves
Income Overview in Staves
| Characteristic | Number | Measure |
| Per Capita Income | 145 | $53,932 |
| Median Family Income | 38 | $167,841 |
| Mean Family Income | 38 | $144,747 |
| Median Household Income | 69 | $0 |
| Mean Household Income | 69 | $106,654 |
| Income Deficit | 38 | $0 |
| Wage / Income Gap (%) | 145 | 0.00% |
| Wage / Income Gap ($) | 145 | 100.00¢ per $1 |
| Gini / Inequality Index | 145 | 0.37 |
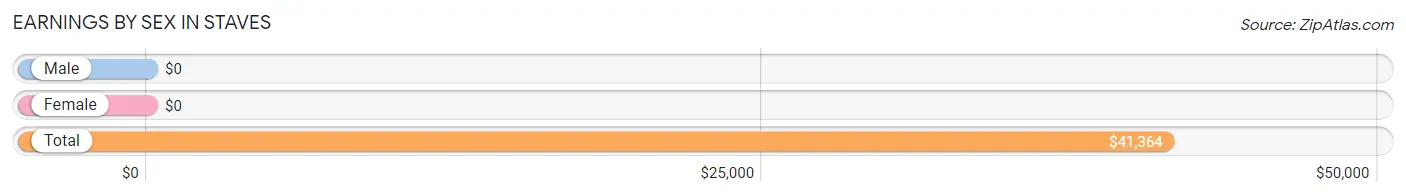
Earnings by Sex in Staves
| Sex | Number | Average Earnings |
| Male | 42 (65.6%) | $0 |
| Female | 22 (34.4%) | $0 |
| Total | 64 (100.0%) | $41,364 |
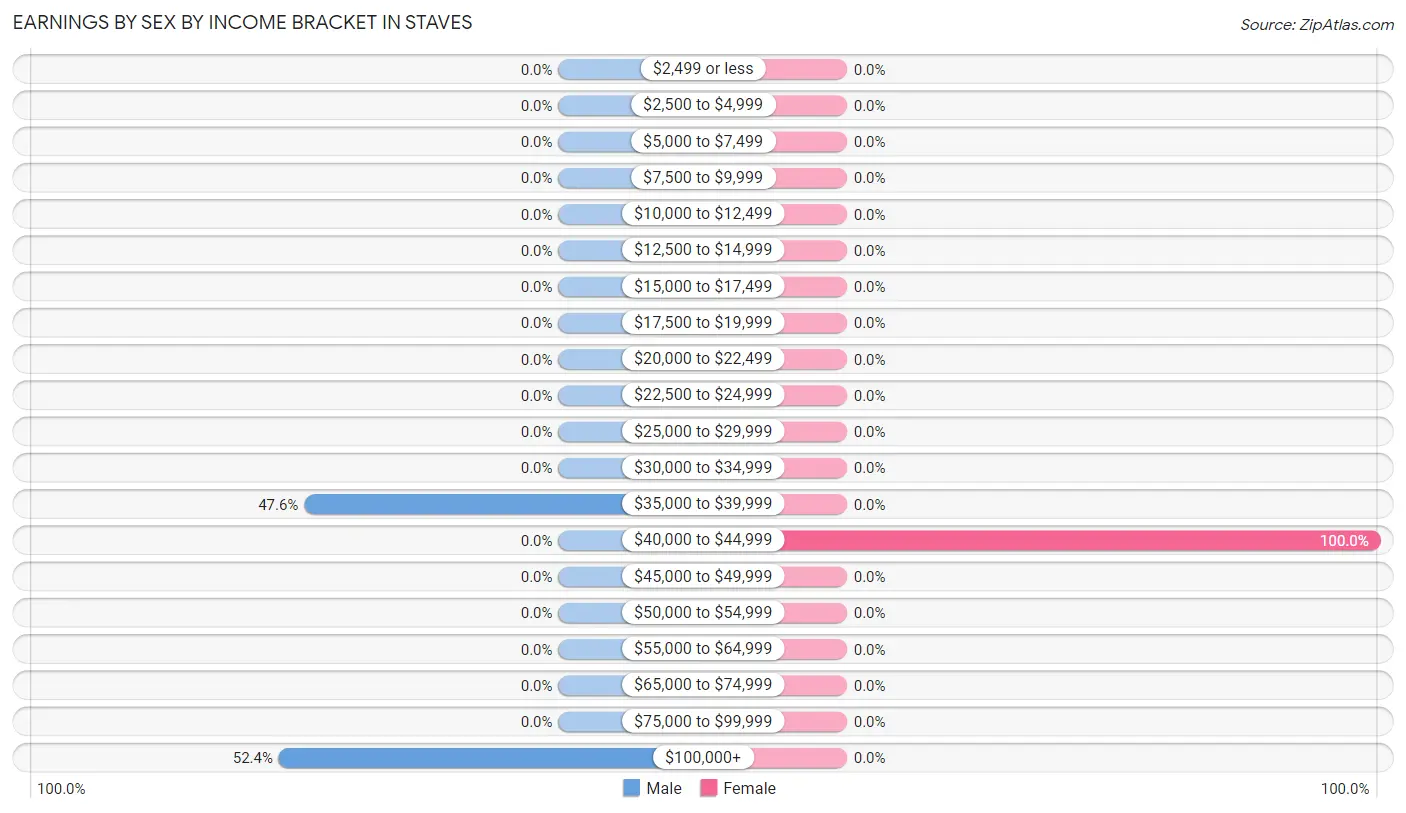
Earnings by Sex by Income Bracket in Staves
The most common earnings brackets in Staves are $100,000+ for men (22 | 52.4%) and $40,000 to $44,999 for women (22 | 100.0%).
| Income | Male | Female |
| $2,499 or less | 0 (0.0%) | 0 (0.0%) |
| $2,500 to $4,999 | 0 (0.0%) | 0 (0.0%) |
| $5,000 to $7,499 | 0 (0.0%) | 0 (0.0%) |
| $7,500 to $9,999 | 0 (0.0%) | 0 (0.0%) |
| $10,000 to $12,499 | 0 (0.0%) | 0 (0.0%) |
| $12,500 to $14,999 | 0 (0.0%) | 0 (0.0%) |
| $15,000 to $17,499 | 0 (0.0%) | 0 (0.0%) |
| $17,500 to $19,999 | 0 (0.0%) | 0 (0.0%) |
| $20,000 to $22,499 | 0 (0.0%) | 0 (0.0%) |
| $22,500 to $24,999 | 0 (0.0%) | 0 (0.0%) |
| $25,000 to $29,999 | 0 (0.0%) | 0 (0.0%) |
| $30,000 to $34,999 | 0 (0.0%) | 0 (0.0%) |
| $35,000 to $39,999 | 20 (47.6%) | 0 (0.0%) |
| $40,000 to $44,999 | 0 (0.0%) | 22 (100.0%) |
| $45,000 to $49,999 | 0 (0.0%) | 0 (0.0%) |
| $50,000 to $54,999 | 0 (0.0%) | 0 (0.0%) |
| $55,000 to $64,999 | 0 (0.0%) | 0 (0.0%) |
| $65,000 to $74,999 | 0 (0.0%) | 0 (0.0%) |
| $75,000 to $99,999 | 0 (0.0%) | 0 (0.0%) |
| $100,000+ | 22 (52.4%) | 0 (0.0%) |
| Total | 42 (100.0%) | 22 (100.0%) |
Earnings by Sex by Educational Attainment in Staves
| Educational Attainment | Male Income | Female Income |
| Less than High School | - | - |
| High School Diploma | - | - |
| College or Associate's Degree | - | - |
| Bachelor's Degree | - | - |
| Graduate Degree | - | - |
| Total | - | - |
Family Income in Staves
Family Income Brackets in Staves
According to the Staves family income data, there are 22 families falling into the $150,000 to $199,999 income range, which is the most common income bracket and makes up 57.9% of all families.
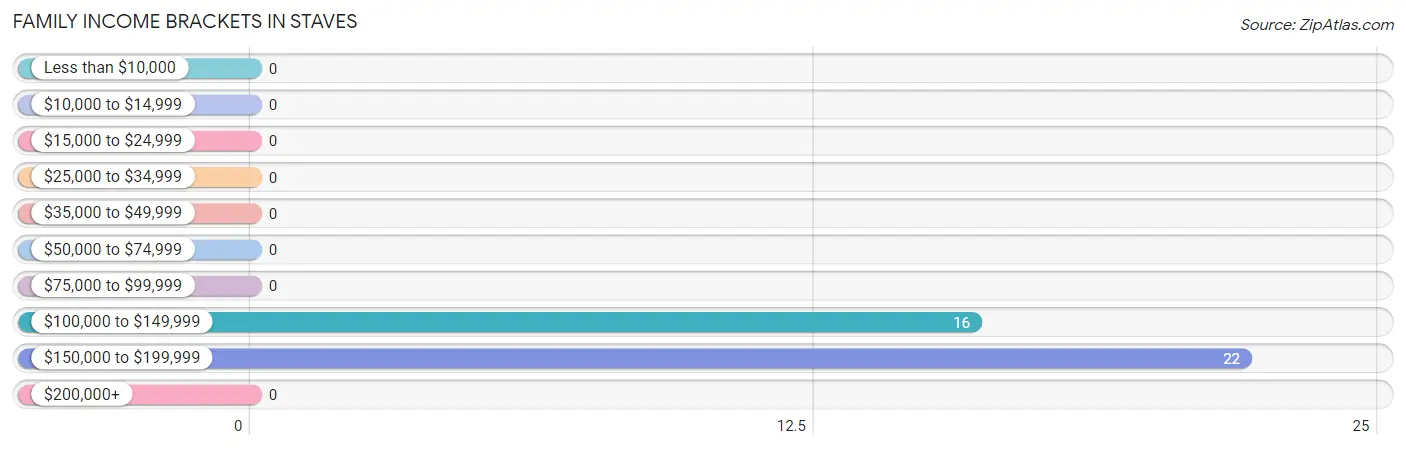
| Income Bracket | # Families | % Families |
| Less than $10,000 | 0 | 0.0% |
| $10,000 to $14,999 | 0 | 0.0% |
| $15,000 to $24,999 | 0 | 0.0% |
| $25,000 to $34,999 | 0 | 0.0% |
| $35,000 to $49,999 | 0 | 0.0% |
| $50,000 to $74,999 | 0 | 0.0% |
| $75,000 to $99,999 | 0 | 0.0% |
| $100,000 to $149,999 | 16 | 42.1% |
| $150,000 to $199,999 | 22 | 57.9% |
| $200,000+ | 0 | 0.0% |
Family Income by Famaliy Size in Staves
| Income Bracket | # Families | Median Income |
| 2-Person Families | 16 (42.1%) | $0 |
| 3-Person Families | 22 (57.9%) | $0 |
| 4-Person Families | 0 (0.0%) | $0 |
| 5-Person Families | 0 (0.0%) | $0 |
| 6-Person Families | 0 (0.0%) | $0 |
| 7+ Person Families | 0 (0.0%) | $0 |
| Total | 38 (100.0%) | $167,841 |
Family Income by Number of Earners in Staves
| Number of Earners | # Families | Median Income |
| No Earners | 8 (21.0%) | $0 |
| 1 Earner | 8 (21.0%) | $0 |
| 2 Earners | 22 (57.9%) | $0 |
| 3+ Earners | 0 (0.0%) | $0 |
| Total | 38 (100.0%) | $167,841 |
Household Income in Staves
Household Income Brackets in Staves
With 27 households falling in the category, the $25,000 to $34,999 income range is the most frequent in Staves, accounting for 39.1% of all households.
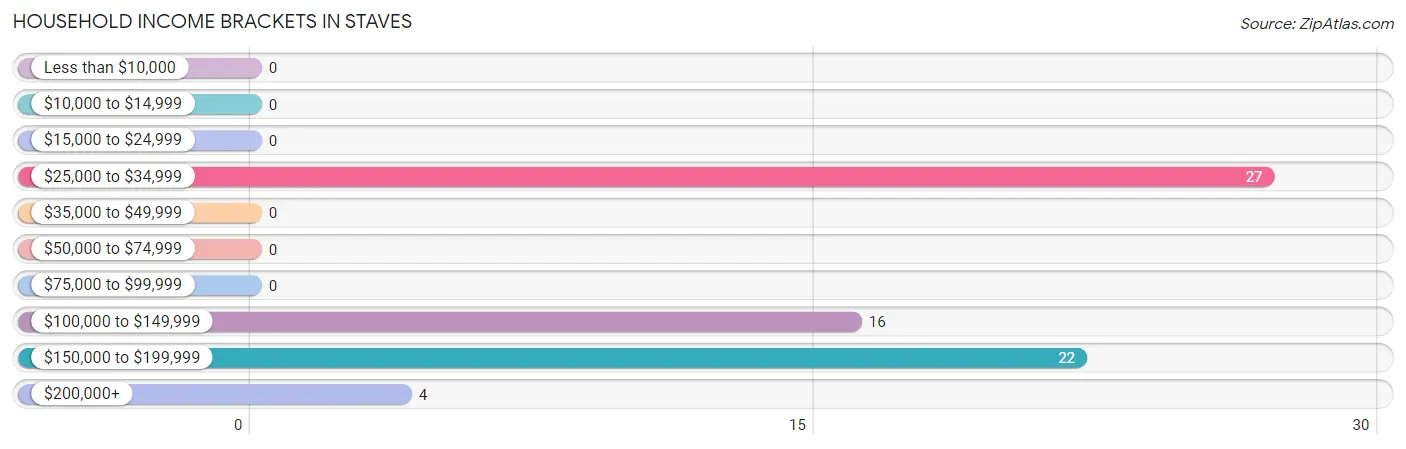
| Income Bracket | # Households | % Households |
| Less than $10,000 | 0 | 0.0% |
| $10,000 to $14,999 | 0 | 0.0% |
| $15,000 to $24,999 | 0 | 0.0% |
| $25,000 to $34,999 | 27 | 39.1% |
| $35,000 to $49,999 | 0 | 0.0% |
| $50,000 to $74,999 | 0 | 0.0% |
| $75,000 to $99,999 | 0 | 0.0% |
| $100,000 to $149,999 | 16 | 23.2% |
| $150,000 to $199,999 | 22 | 31.9% |
| $200,000+ | 4 | 5.8% |
Household Income by Householder Age in Staves
| Income Bracket | # Households | Median Income |
| 15 to 24 Years | 0 (0.0%) | $0 |
| 25 to 44 Years | 0 (0.0%) | $0 |
| 45 to 64 Years | 26 (37.7%) | $0 |
| 65+ Years | 43 (62.3%) | $0 |
| Total | 69 (100.0%) | $0 |
Poverty in Staves
Income Below Poverty by Sex and Age in Staves
| Age Bracket | Male | Female |
| Under 5 Years | 0 (0.0%) | 0 (0.0%) |
| 5 Years | 0 (0.0%) | 0 (0.0%) |
| 6 to 11 Years | 0 (0.0%) | 0 (0.0%) |
| 12 to 14 Years | 0 (0.0%) | 0 (0.0%) |
| 15 Years | 0 (0.0%) | 0 (0.0%) |
| 16 and 17 Years | 0 (0.0%) | 0 (0.0%) |
| 18 to 24 Years | 0 (0.0%) | 0 (0.0%) |
| 25 to 34 Years | 0 (0.0%) | 0 (0.0%) |
| 35 to 44 Years | 0 (0.0%) | 0 (0.0%) |
| 45 to 54 Years | 0 (0.0%) | 0 (0.0%) |
| 55 to 64 Years | 0 (0.0%) | 0 (0.0%) |
| 65 to 74 Years | 0 (0.0%) | 0 (0.0%) |
| 75 Years and over | 0 (0.0%) | 0 (0.0%) |
| Total | 0 (0.0%) | 0 (0.0%) |
Income Above Poverty by Sex and Age in Staves
According to the poverty statistics in Staves, males aged 16 and 17 years and females aged 45 to 54 years are the age groups that are most secure financially, with 100.0% of males and 100.0% of females in these age groups living above the poverty line.
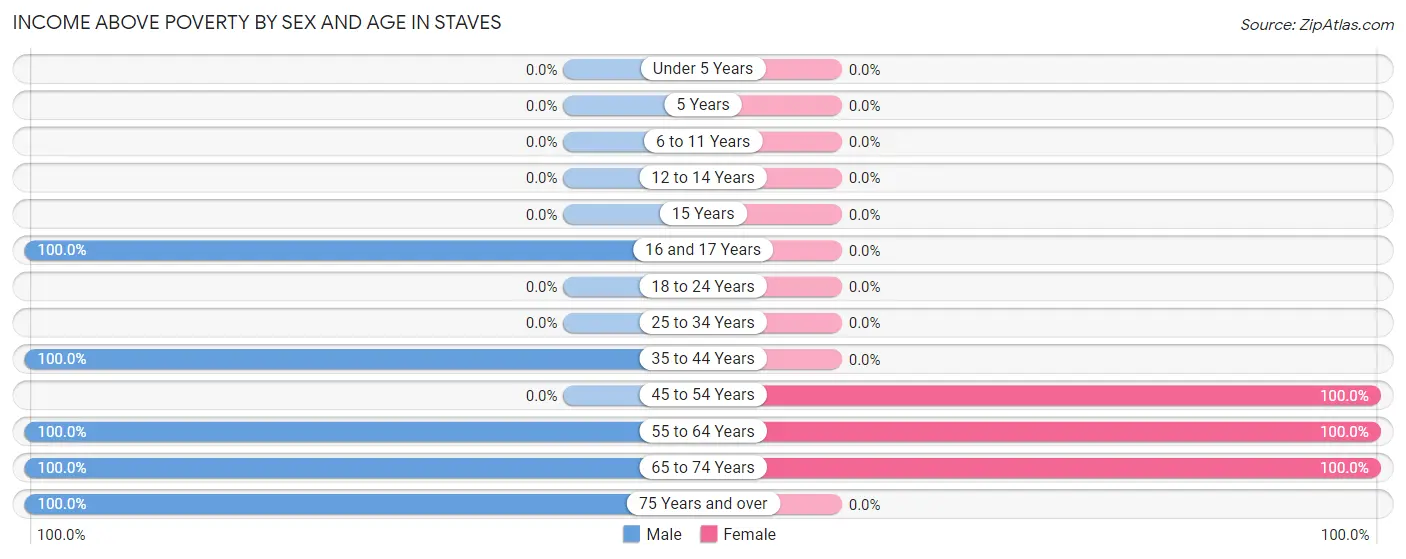
| Age Bracket | Male | Female |
| Under 5 Years | 0 (0.0%) | 0 (0.0%) |
| 5 Years | 0 (0.0%) | 0 (0.0%) |
| 6 to 11 Years | 0 (0.0%) | 0 (0.0%) |
| 12 to 14 Years | 0 (0.0%) | 0 (0.0%) |
| 15 Years | 0 (0.0%) | 0 (0.0%) |
| 16 and 17 Years | 26 (100.0%) | 0 (0.0%) |
| 18 to 24 Years | 0 (0.0%) | 0 (0.0%) |
| 25 to 34 Years | 0 (0.0%) | 0 (0.0%) |
| 35 to 44 Years | 20 (100.0%) | 0 (0.0%) |
| 45 to 54 Years | 0 (0.0%) | 22 (100.0%) |
| 55 to 64 Years | 22 (100.0%) | 4 (100.0%) |
| 65 to 74 Years | 16 (100.0%) | 8 (100.0%) |
| 75 Years and over | 27 (100.0%) | 0 (0.0%) |
| Total | 111 (100.0%) | 34 (100.0%) |
Income Below Poverty Among Married-Couple Families in Staves
| Children | Above Poverty | Below Poverty |
| No Children | 8 (100.0%) | 0 (0.0%) |
| 1 or 2 Children | 22 (100.0%) | 0 (0.0%) |
| 3 or 4 Children | 0 (0.0%) | 0 (0.0%) |
| 5 or more Children | 0 (0.0%) | 0 (0.0%) |
| Total | 30 (100.0%) | 0 (0.0%) |
Income Below Poverty Among Single-Parent Households in Staves
| Children | Single Father | Single Mother |
| No Children | 0 (0.0%) | 0 (0.0%) |
| 1 or 2 Children | 0 (0.0%) | 0 (0.0%) |
| 3 or 4 Children | 0 (0.0%) | 0 (0.0%) |
| 5 or more Children | 0 (0.0%) | 0 (0.0%) |
| Total | 0 (0.0%) | 0 (0.0%) |
Income Below Poverty Among Married-Couple vs Single-Parent Households in Staves
| Children | Married-Couple Families | Single-Parent Households |
| No Children | 0 (0.0%) | 0 (0.0%) |
| 1 or 2 Children | 0 (0.0%) | 0 (0.0%) |
| 3 or 4 Children | 0 (0.0%) | 0 (0.0%) |
| 5 or more Children | 0 (0.0%) | 0 (0.0%) |
| Total | 0 (0.0%) | 0 (0.0%) |
Race in Staves
The most populous races in Staves are , and White / Caucasian (145 | 100.0%).
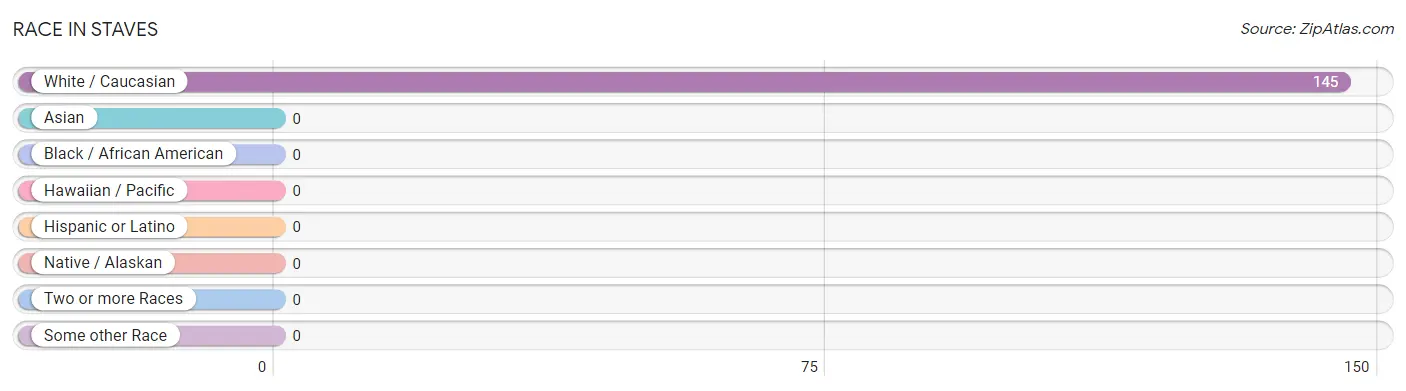
| Race | # Population | % Population |
| Asian | 0 | 0.0% |
| Black / African American | 0 | 0.0% |
| Hawaiian / Pacific | 0 | 0.0% |
| Hispanic or Latino | 0 | 0.0% |
| Native / Alaskan | 0 | 0.0% |
| White / Caucasian | 145 | 100.0% |
| Two or more Races | 0 | 0.0% |
| Some other Race | 0 | 0.0% |
| Total | 145 | 100.0% |
Ancestry in Staves
The most populous ancestries reported in Staves are German (20 | 13.8%), European (4 | 2.8%), and Irish (4 | 2.8%), together accounting for 19.3% of all Staves residents.
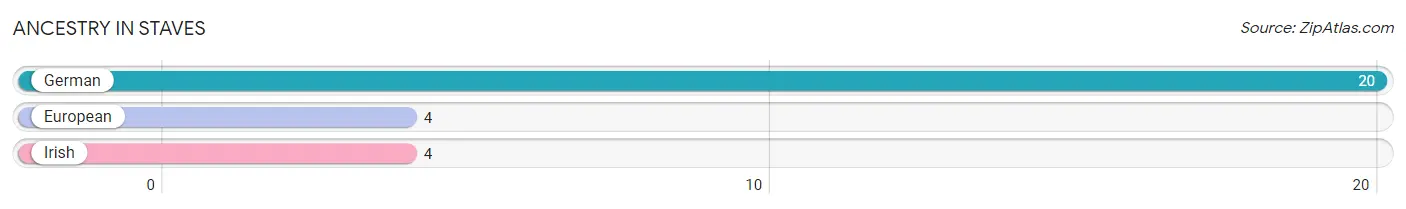
| Ancestry | # Population | % Population |
| European | 4 | 2.8% |
| German | 20 | 13.8% |
| Irish | 4 | 2.8% | View All 3 Rows |
Immigrants in Staves

| Immigration Origin | # Population | % Population | View All 0 Rows |
Sex and Age in Staves
Sex and Age in Staves
The most populous age groups in Staves are 85 Years and over (27 | 24.3%) for men and 50 to 54 Years (22 | 64.7%) for women.
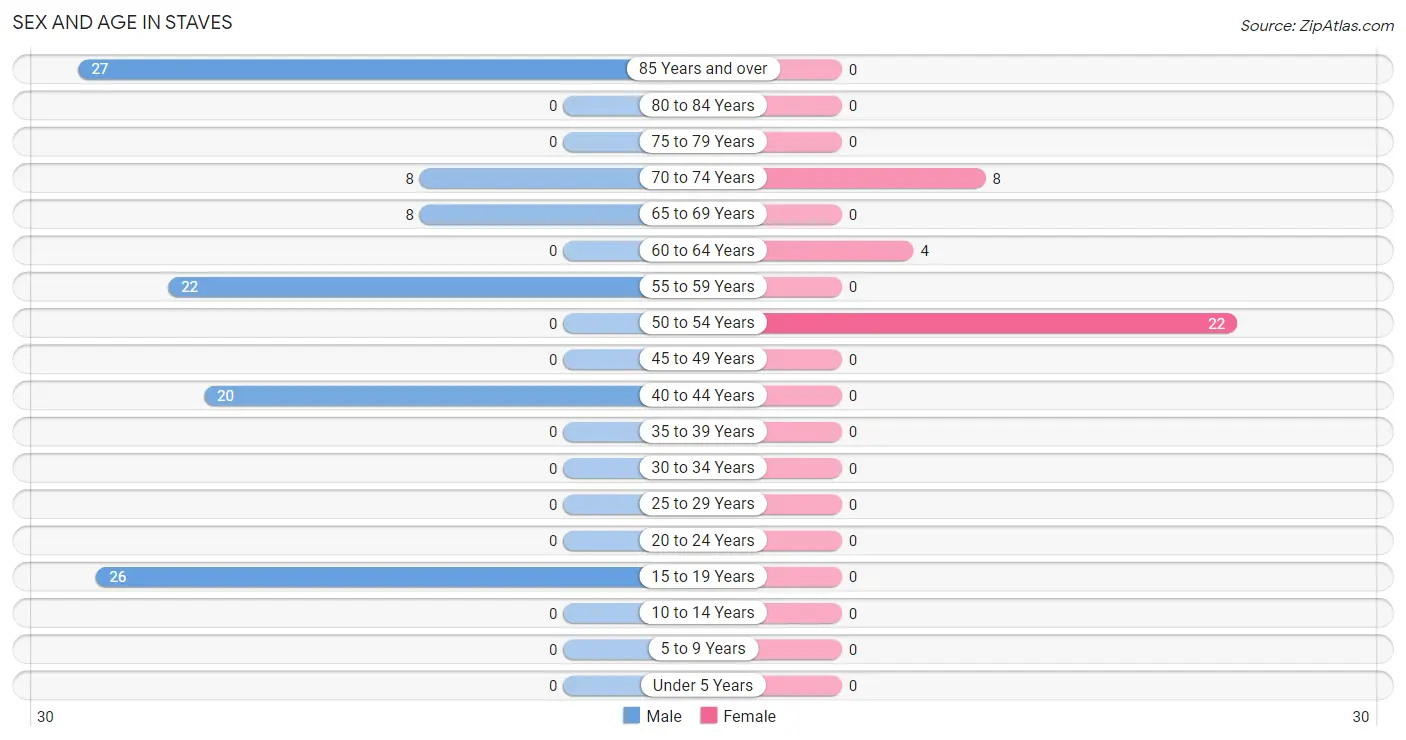
| Age Bracket | Male | Female |
| Under 5 Years | 0 (0.0%) | 0 (0.0%) |
| 5 to 9 Years | 0 (0.0%) | 0 (0.0%) |
| 10 to 14 Years | 0 (0.0%) | 0 (0.0%) |
| 15 to 19 Years | 26 (23.4%) | 0 (0.0%) |
| 20 to 24 Years | 0 (0.0%) | 0 (0.0%) |
| 25 to 29 Years | 0 (0.0%) | 0 (0.0%) |
| 30 to 34 Years | 0 (0.0%) | 0 (0.0%) |
| 35 to 39 Years | 0 (0.0%) | 0 (0.0%) |
| 40 to 44 Years | 20 (18.0%) | 0 (0.0%) |
| 45 to 49 Years | 0 (0.0%) | 0 (0.0%) |
| 50 to 54 Years | 0 (0.0%) | 22 (64.7%) |
| 55 to 59 Years | 22 (19.8%) | 0 (0.0%) |
| 60 to 64 Years | 0 (0.0%) | 4 (11.8%) |
| 65 to 69 Years | 8 (7.2%) | 0 (0.0%) |
| 70 to 74 Years | 8 (7.2%) | 8 (23.5%) |
| 75 to 79 Years | 0 (0.0%) | 0 (0.0%) |
| 80 to 84 Years | 0 (0.0%) | 0 (0.0%) |
| 85 Years and over | 27 (24.3%) | 0 (0.0%) |
| Total | 111 (100.0%) | 34 (100.0%) |
Families and Households in Staves
Median Family Size in Staves
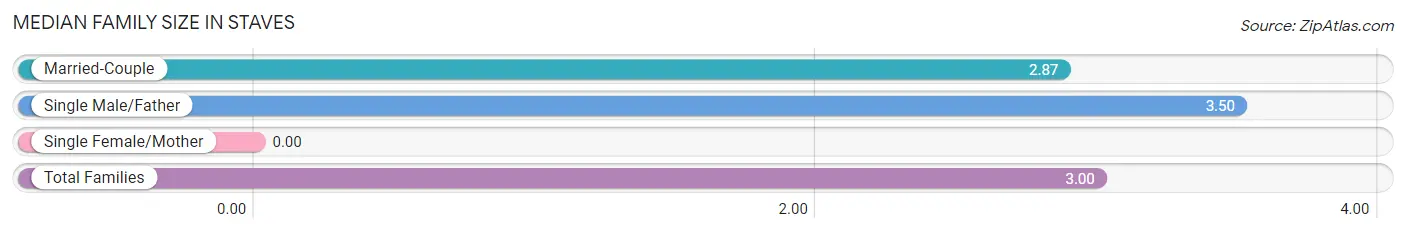
| Family Type | # Families | Family Size |
| Married-Couple | 30 (78.9%) | 2.87 |
| Single Male/Father | 8 (21.0%) | 3.50 |
| Single Female/Mother | 0 (0.0%) | - |
| Total Families | 38 (100.0%) | 3.00 |
Median Household Size in Staves
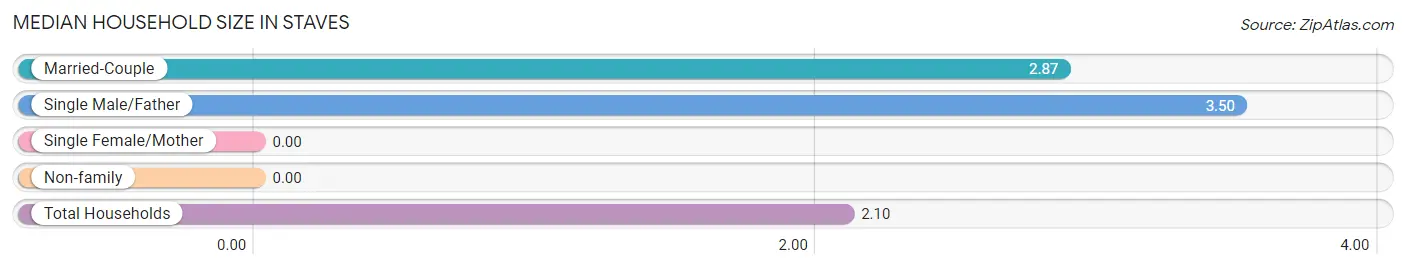
| Household Type | # Households | Household Size |
| Married-Couple | 30 (43.5%) | 2.87 |
| Single Male/Father | 8 (11.6%) | 3.50 |
| Single Female/Mother | 0 (0.0%) | - |
| Non-family | 31 (44.9%) | - |
| Total Households | 69 (100.0%) | 2.10 |
Household Size by Marriage Status in Staves
Out of a total of 69 households in Staves, 38 (55.1%) are family households, while 31 (44.9%) are nonfamily households. The most numerous type of family households are 3-person households, comprising 22, and the most common type of nonfamily households are 1-person households, comprising 31.
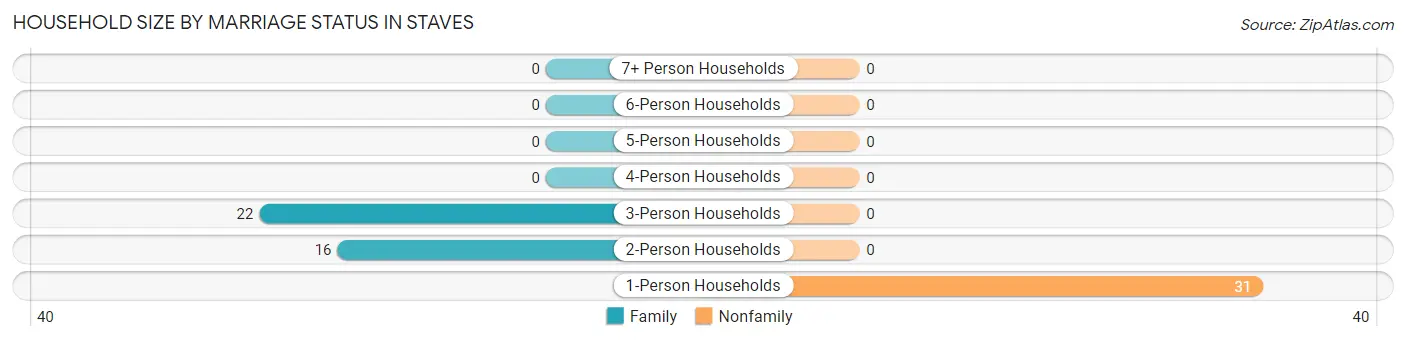
| Household Size | Family Households | Nonfamily Households |
| 1-Person Households | - | 31 (44.9%) |
| 2-Person Households | 16 (23.2%) | 0 (0.0%) |
| 3-Person Households | 22 (31.9%) | 0 (0.0%) |
| 4-Person Households | 0 (0.0%) | 0 (0.0%) |
| 5-Person Households | 0 (0.0%) | 0 (0.0%) |
| 6-Person Households | 0 (0.0%) | 0 (0.0%) |
| 7+ Person Households | 0 (0.0%) | 0 (0.0%) |
| Total | 38 (55.1%) | 31 (44.9%) |
Female Fertility in Staves
Fertility by Age in Staves
| Age Bracket | Women with Births | Births / 1,000 Women |
| 15 to 19 years | 0 (0.0%) | 0.0 |
| 20 to 34 years | 0 (0.0%) | 0.0 |
| 35 to 50 years | 0 (0.0%) | 0.0 |
| Total | 0 (0.0%) | 0.0 |
Fertility by Age by Marriage Status in Staves
| Age Bracket | Married | Unmarried |
| 15 to 19 years | 0 (0.0%) | 0 (0.0%) |
| 20 to 34 years | 0 (0.0%) | 0 (0.0%) |
| 35 to 50 years | 0 (0.0%) | 0 (0.0%) |
| Total | 0 (0.0%) | 0 (0.0%) |
Fertility by Education in Staves
| Educational Attainment | Women with Births | Births / 1,000 Women |
| Less than High School | 0 (0.0%) | 0.0 |
| High School Diploma | 0 (0.0%) | 0.0 |
| College or Associate's Degree | 0 (0.0%) | 0.0 |
| Bachelor's Degree | 0 (0.0%) | 0.0 |
| Graduate Degree | 0 (0.0%) | 0.0 |
| Total | 0 (0.0%) | 0.0 |
Fertility by Education by Marriage Status in Staves
| Educational Attainment | Married | Unmarried |
| Less than High School | 0 (0.0%) | 0 (0.0%) |
| High School Diploma | 0 (0.0%) | 0 (0.0%) |
| College or Associate's Degree | 0 (0.0%) | 0 (0.0%) |
| Bachelor's Degree | 0 (0.0%) | 0 (0.0%) |
| Graduate Degree | 0 (0.0%) | 0 (0.0%) |
| Total | 0 (0.0%) | 0 (0.0%) |
Employment Characteristics in Staves
Employment by Class of Employer in Staves
Among the 64 employed individuals in Staves, private company employees (42 | 65.6%), and self-employed (not incorporated) (22 | 34.4%) make up the most common classes of employment.
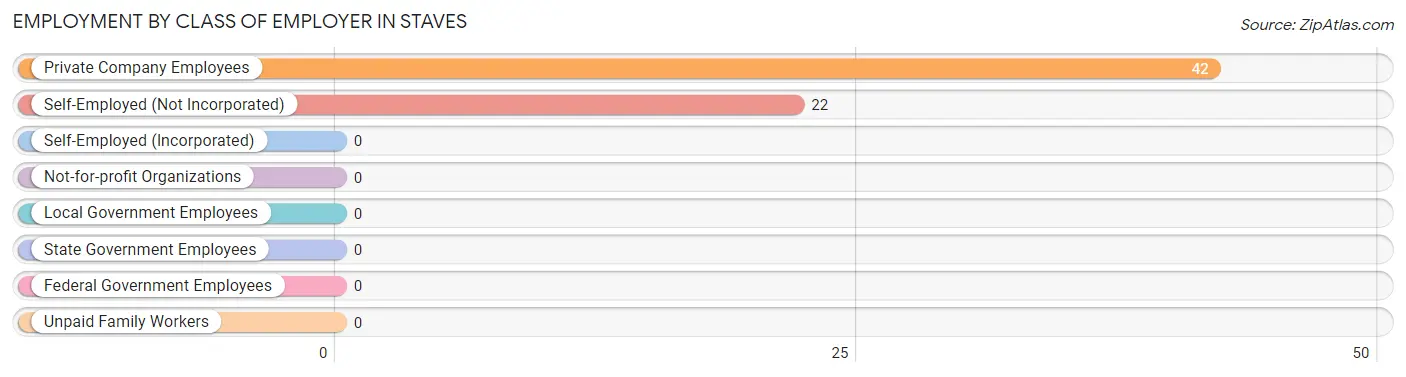
| Employer Class | # Employees | % Employees |
| Private Company Employees | 42 | 65.6% |
| Self-Employed (Incorporated) | 0 | 0.0% |
| Self-Employed (Not Incorporated) | 22 | 34.4% |
| Not-for-profit Organizations | 0 | 0.0% |
| Local Government Employees | 0 | 0.0% |
| State Government Employees | 0 | 0.0% |
| Federal Government Employees | 0 | 0.0% |
| Unpaid Family Workers | 0 | 0.0% |
| Total | 64 | 100.0% |
Employment Status by Age in Staves
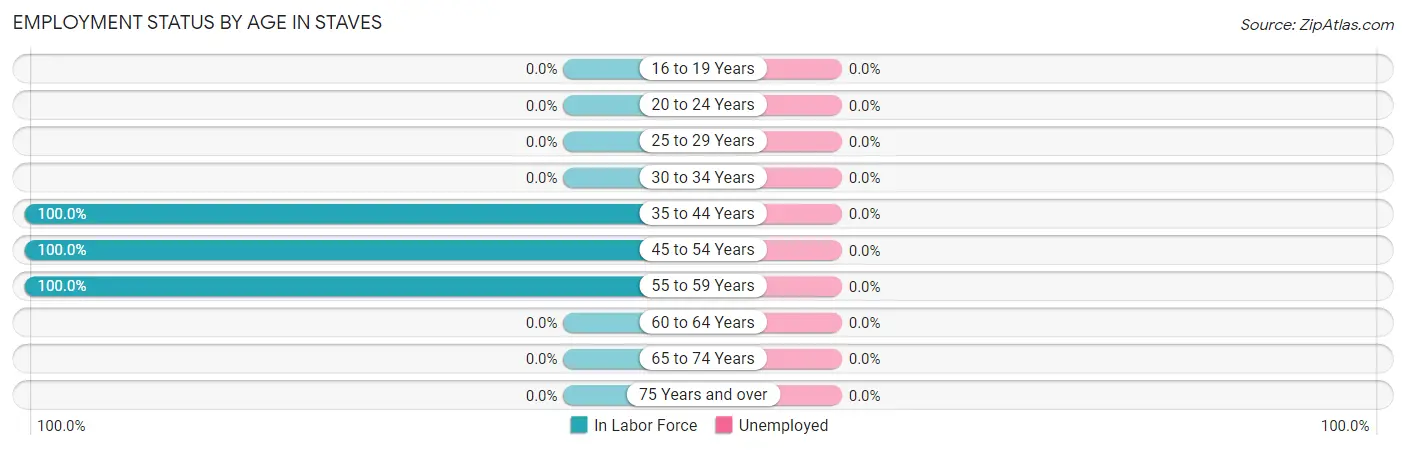
| Age Bracket | In Labor Force | Unemployed |
| 16 to 19 Years | 0 (0.0%) | 0 (0.0%) |
| 20 to 24 Years | 0 (0.0%) | 0 (0.0%) |
| 25 to 29 Years | 0 (0.0%) | 0 (0.0%) |
| 30 to 34 Years | 0 (0.0%) | 0 (0.0%) |
| 35 to 44 Years | 20 (100.0%) | 0 (0.0%) |
| 45 to 54 Years | 22 (100.0%) | 0 (0.0%) |
| 55 to 59 Years | 22 (100.0%) | 0 (0.0%) |
| 60 to 64 Years | 0 (0.0%) | 0 (0.0%) |
| 65 to 74 Years | 0 (0.0%) | 0 (0.0%) |
| 75 Years and over | 0 (0.0%) | 0 (0.0%) |
| Total | 64 (44.1%) | 0 (0.0%) |
Employment Status by Educational Attainment in Staves
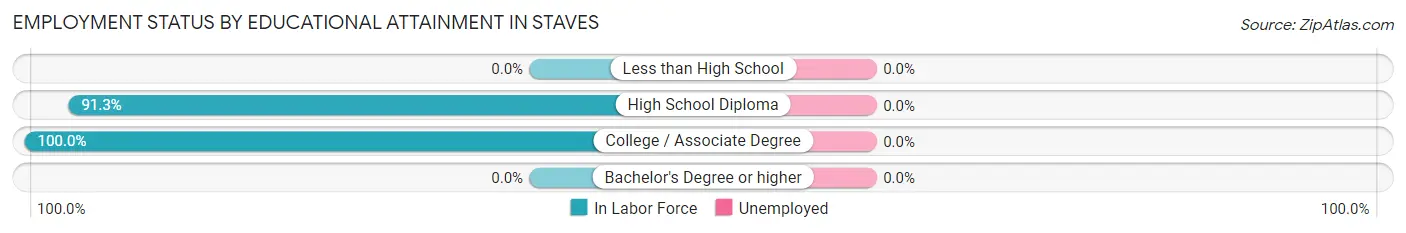
| Educational Attainment | In Labor Force | Unemployed |
| Less than High School | 0 (0.0%) | 0 (0.0%) |
| High School Diploma | 42 (91.3%) | 0 (0.0%) |
| College / Associate Degree | 22 (100.0%) | 0 (0.0%) |
| Bachelor's Degree or higher | 0 (0.0%) | 0 (0.0%) |
| Total | 64 (94.1%) | 0 (0.0%) |
Employment Occupations by Sex in Staves
Management, Business, Science and Arts Occupations
The most common Management, Business, Science and Arts occupations in Staves are , and Management (22 | 34.4%).
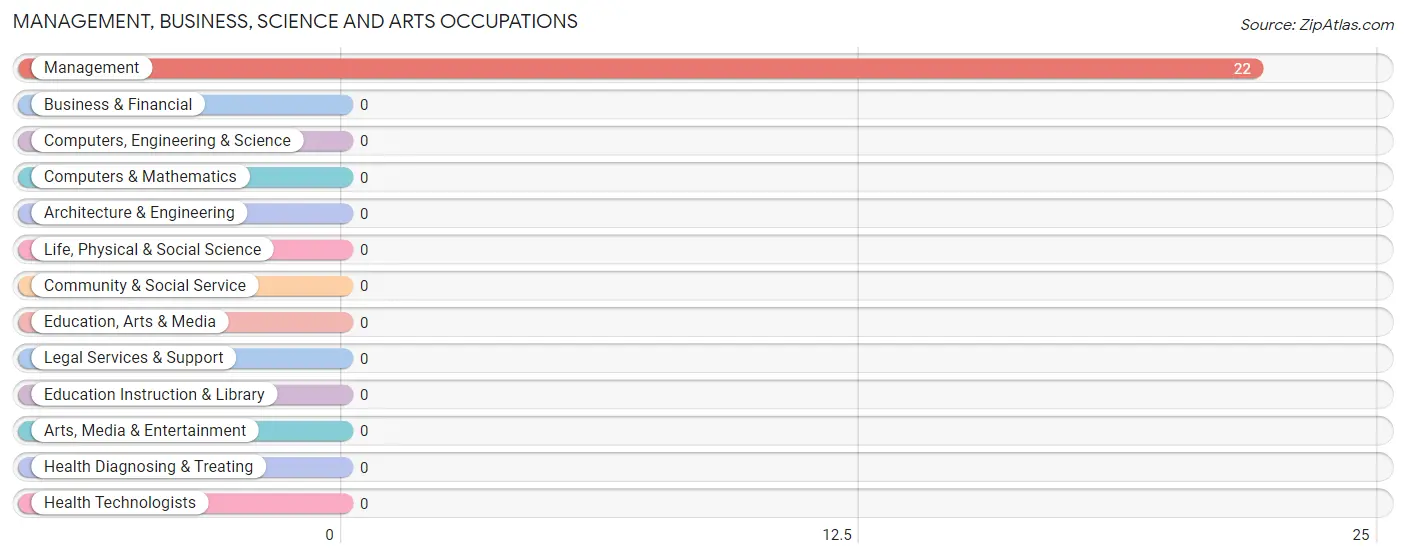
Management, Business, Science and Arts Occupations by Sex
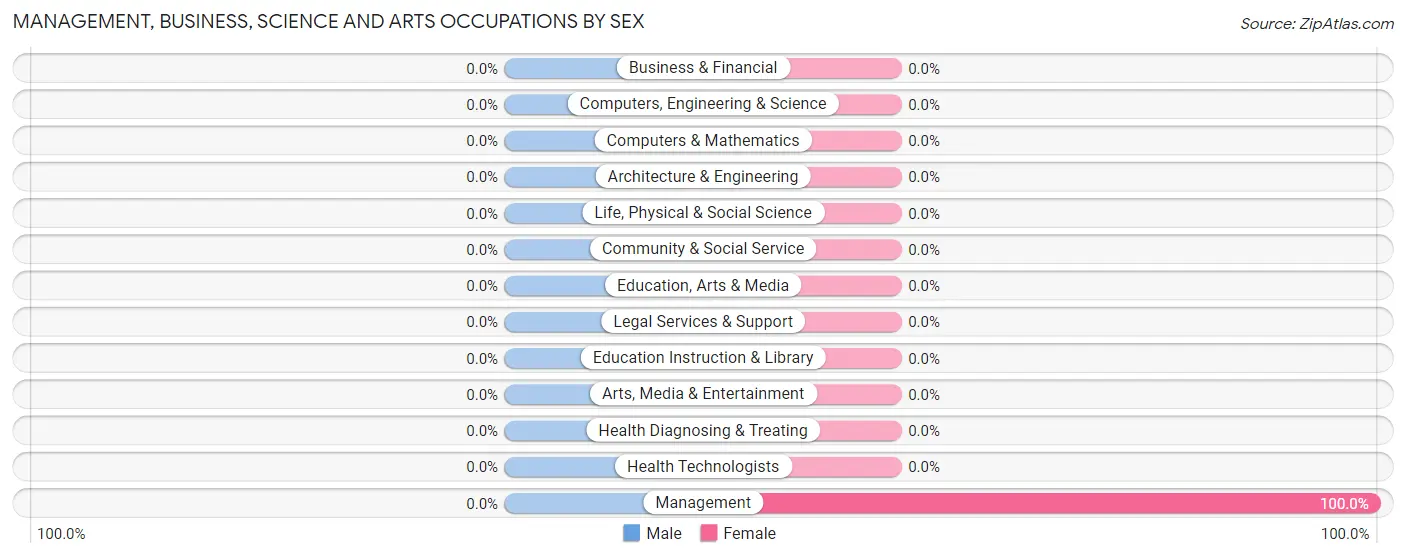
| Occupation | Male | Female |
| Management | 0 (0.0%) | 22 (100.0%) |
| Business & Financial | 0 (0.0%) | 0 (0.0%) |
| Computers, Engineering & Science | 0 (0.0%) | 0 (0.0%) |
| Computers & Mathematics | 0 (0.0%) | 0 (0.0%) |
| Architecture & Engineering | 0 (0.0%) | 0 (0.0%) |
| Life, Physical & Social Science | 0 (0.0%) | 0 (0.0%) |
| Community & Social Service | 0 (0.0%) | 0 (0.0%) |
| Education, Arts & Media | 0 (0.0%) | 0 (0.0%) |
| Legal Services & Support | 0 (0.0%) | 0 (0.0%) |
| Education Instruction & Library | 0 (0.0%) | 0 (0.0%) |
| Arts, Media & Entertainment | 0 (0.0%) | 0 (0.0%) |
| Health Diagnosing & Treating | 0 (0.0%) | 0 (0.0%) |
| Health Technologists | 0 (0.0%) | 0 (0.0%) |
| Total (Category) | 0 (0.0%) | 22 (100.0%) |
| Total (Overall) | 42 (65.6%) | 22 (34.4%) |
Services Occupations
Services Occupations by Sex
| Occupation | Male | Female |
| Healthcare Support | 0 (0.0%) | 0 (0.0%) |
| Security & Protection | 0 (0.0%) | 0 (0.0%) |
| Firefighting & Prevention | 0 (0.0%) | 0 (0.0%) |
| Law Enforcement | 0 (0.0%) | 0 (0.0%) |
| Food Preparation & Serving | 0 (0.0%) | 0 (0.0%) |
| Cleaning & Maintenance | 0 (0.0%) | 0 (0.0%) |
| Personal Care & Service | 0 (0.0%) | 0 (0.0%) |
| Total (Category) | 0 (0.0%) | 0 (0.0%) |
| Total (Overall) | 42 (65.6%) | 22 (34.4%) |
Sales and Office Occupations
The most common Sales and Office occupations in Staves are , and Sales & Related (20 | 31.2%).
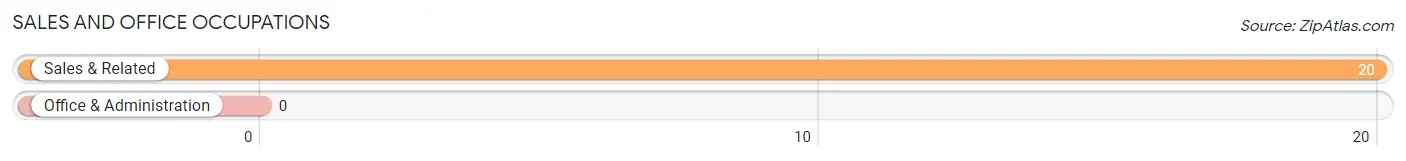
Sales and Office Occupations by Sex
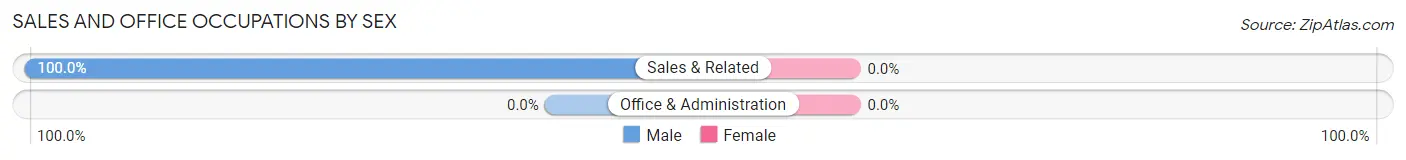
| Occupation | Male | Female |
| Sales & Related | 20 (100.0%) | 0 (0.0%) |
| Office & Administration | 0 (0.0%) | 0 (0.0%) |
| Total (Category) | 20 (100.0%) | 0 (0.0%) |
| Total (Overall) | 42 (65.6%) | 22 (34.4%) |
Natural Resources, Construction and Maintenance Occupations
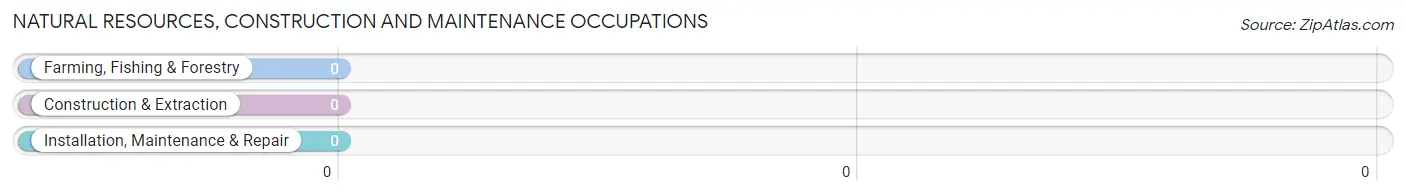
Natural Resources, Construction and Maintenance Occupations by Sex
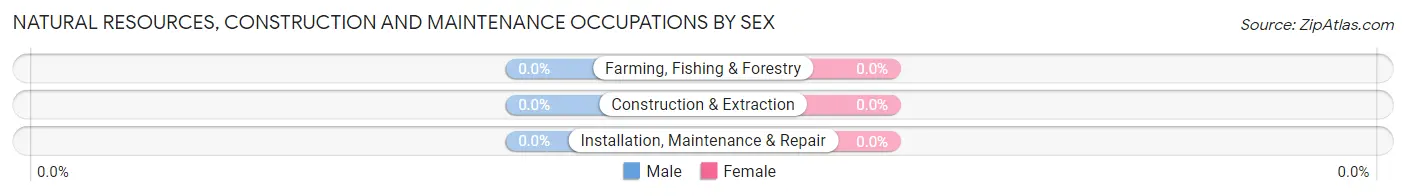
| Occupation | Male | Female |
| Farming, Fishing & Forestry | 0 (0.0%) | 0 (0.0%) |
| Construction & Extraction | 0 (0.0%) | 0 (0.0%) |
| Installation, Maintenance & Repair | 0 (0.0%) | 0 (0.0%) |
| Total (Category) | 0 (0.0%) | 0 (0.0%) |
| Total (Overall) | 42 (65.6%) | 22 (34.4%) |
Production, Transportation and Moving Occupations
The most common Production, Transportation and Moving occupations in Staves are , and Transportation (22 | 34.4%).
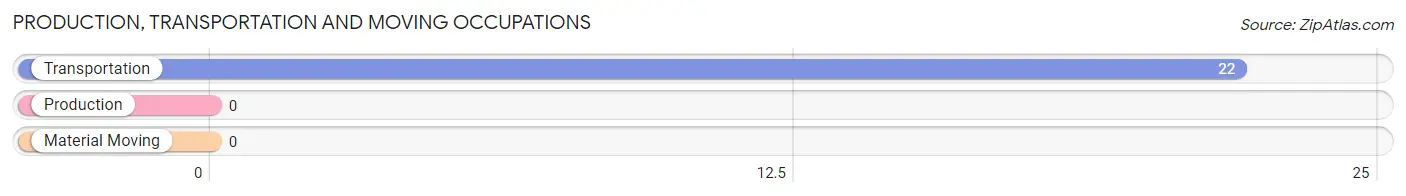
Production, Transportation and Moving Occupations by Sex
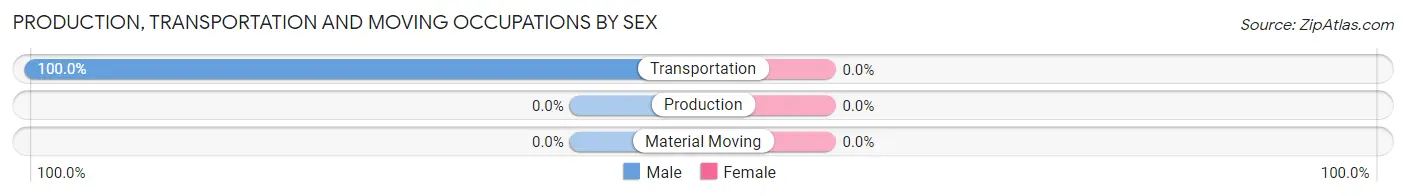
| Occupation | Male | Female |
| Production | 0 (0.0%) | 0 (0.0%) |
| Transportation | 22 (100.0%) | 0 (0.0%) |
| Material Moving | 0 (0.0%) | 0 (0.0%) |
| Total (Category) | 22 (100.0%) | 0 (0.0%) |
| Total (Overall) | 42 (65.6%) | 22 (34.4%) |
Employment Industries by Sex in Staves
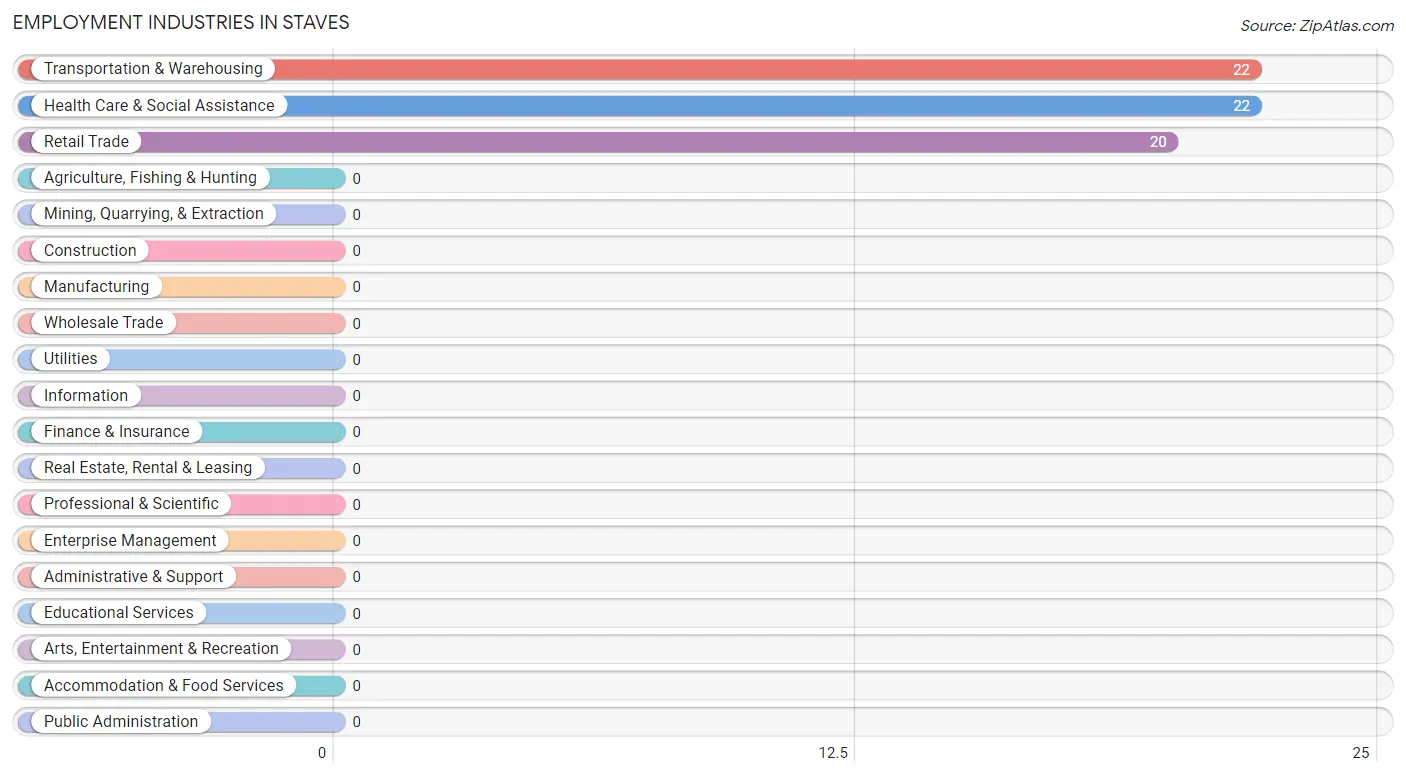
Employment Industries in Staves
The major employment industries in Staves include Transportation & Warehousing (22 | 34.4%), Health Care & Social Assistance (22 | 34.4%), and Retail Trade (20 | 31.2%).
Employment Industries by Sex in Staves
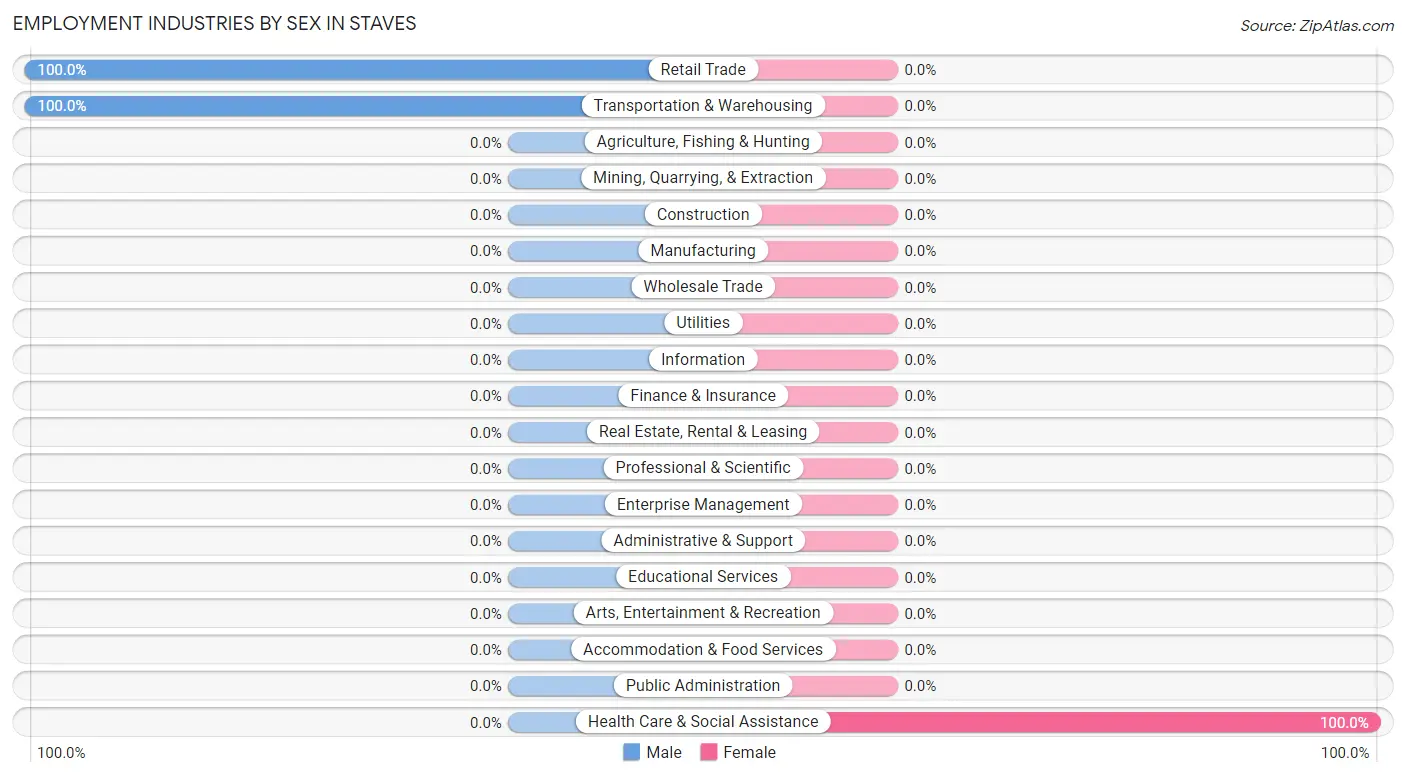
| Industry | Male | Female |
| Agriculture, Fishing & Hunting | 0 (0.0%) | 0 (0.0%) |
| Mining, Quarrying, & Extraction | 0 (0.0%) | 0 (0.0%) |
| Construction | 0 (0.0%) | 0 (0.0%) |
| Manufacturing | 0 (0.0%) | 0 (0.0%) |
| Wholesale Trade | 0 (0.0%) | 0 (0.0%) |
| Retail Trade | 20 (100.0%) | 0 (0.0%) |
| Transportation & Warehousing | 22 (100.0%) | 0 (0.0%) |
| Utilities | 0 (0.0%) | 0 (0.0%) |
| Information | 0 (0.0%) | 0 (0.0%) |
| Finance & Insurance | 0 (0.0%) | 0 (0.0%) |
| Real Estate, Rental & Leasing | 0 (0.0%) | 0 (0.0%) |
| Professional & Scientific | 0 (0.0%) | 0 (0.0%) |
| Enterprise Management | 0 (0.0%) | 0 (0.0%) |
| Administrative & Support | 0 (0.0%) | 0 (0.0%) |
| Educational Services | 0 (0.0%) | 0 (0.0%) |
| Health Care & Social Assistance | 0 (0.0%) | 22 (100.0%) |
| Arts, Entertainment & Recreation | 0 (0.0%) | 0 (0.0%) |
| Accommodation & Food Services | 0 (0.0%) | 0 (0.0%) |
| Public Administration | 0 (0.0%) | 0 (0.0%) |
| Total | 42 (65.6%) | 22 (34.4%) |
Education in Staves
School Enrollment in Staves
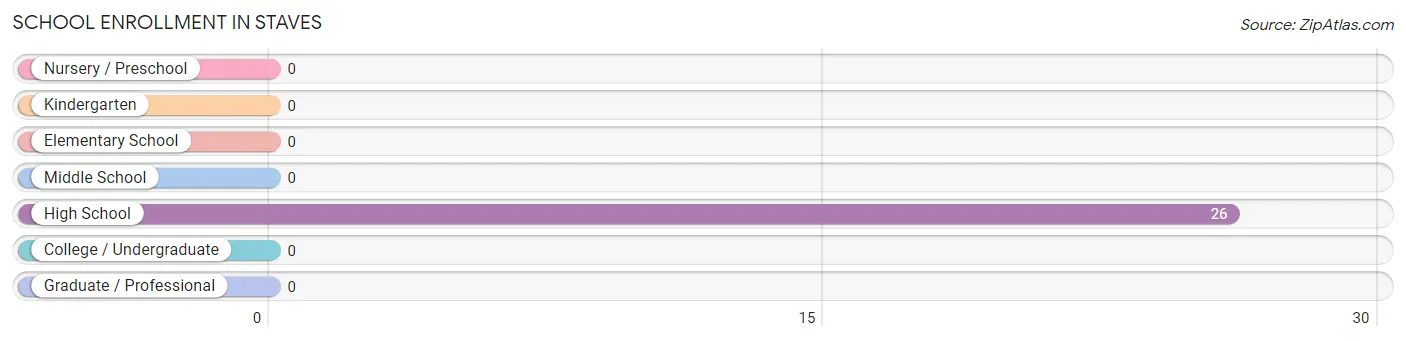
| School Level | # Students | % Students |
| Nursery / Preschool | 0 | 0.0% |
| Kindergarten | 0 | 0.0% |
| Elementary School | 0 | 0.0% |
| Middle School | 0 | 0.0% |
| High School | 26 | 100.0% |
| College / Undergraduate | 0 | 0.0% |
| Graduate / Professional | 0 | 0.0% |
| Total | 26 | 100.0% |
School Enrollment by Age by Funding Source in Staves
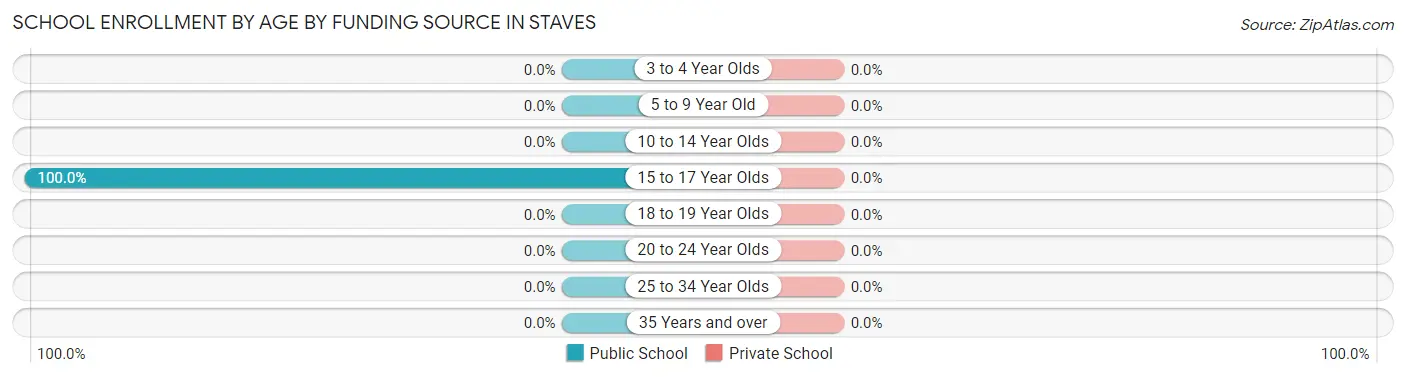
| Age Bracket | Public School | Private School |
| 3 to 4 Year Olds | 0 (0.0%) | 0 (0.0%) |
| 5 to 9 Year Old | 0 (0.0%) | 0 (0.0%) |
| 10 to 14 Year Olds | 0 (0.0%) | 0 (0.0%) |
| 15 to 17 Year Olds | 26 (100.0%) | 0 (0.0%) |
| 18 to 19 Year Olds | 0 (0.0%) | 0 (0.0%) |
| 20 to 24 Year Olds | 0 (0.0%) | 0 (0.0%) |
| 25 to 34 Year Olds | 0 (0.0%) | 0 (0.0%) |
| 35 Years and over | 0 (0.0%) | 0 (0.0%) |
| Total | 26 (100.0%) | 0 (0.0%) |
Educational Attainment by Field of Study in Staves
, and education (8 | 100.0%) are the most common fields of study among 8 individuals in Staves who have obtained a bachelor's degree or higher.
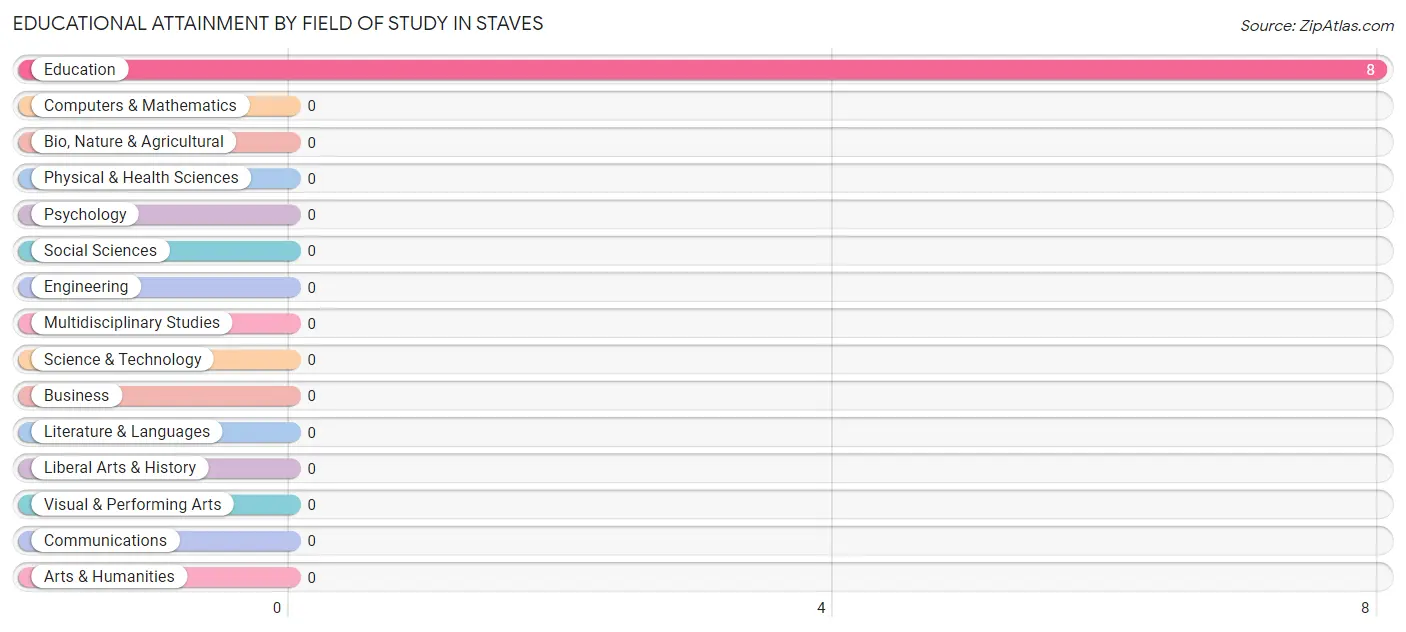
| Field of Study | # Graduates | % Graduates |
| Computers & Mathematics | 0 | 0.0% |
| Bio, Nature & Agricultural | 0 | 0.0% |
| Physical & Health Sciences | 0 | 0.0% |
| Psychology | 0 | 0.0% |
| Social Sciences | 0 | 0.0% |
| Engineering | 0 | 0.0% |
| Multidisciplinary Studies | 0 | 0.0% |
| Science & Technology | 0 | 0.0% |
| Business | 0 | 0.0% |
| Education | 8 | 100.0% |
| Literature & Languages | 0 | 0.0% |
| Liberal Arts & History | 0 | 0.0% |
| Visual & Performing Arts | 0 | 0.0% |
| Communications | 0 | 0.0% |
| Arts & Humanities | 0 | 0.0% |
| Total | 8 | 100.0% |
Transportation & Commute in Staves
Vehicle Availability by Sex in Staves
The most prevalent vehicle ownership categories in Staves are males with 3 vehicles (22, accounting for 52.4%) and females with 3 vehicles (22, making up 100.0%).
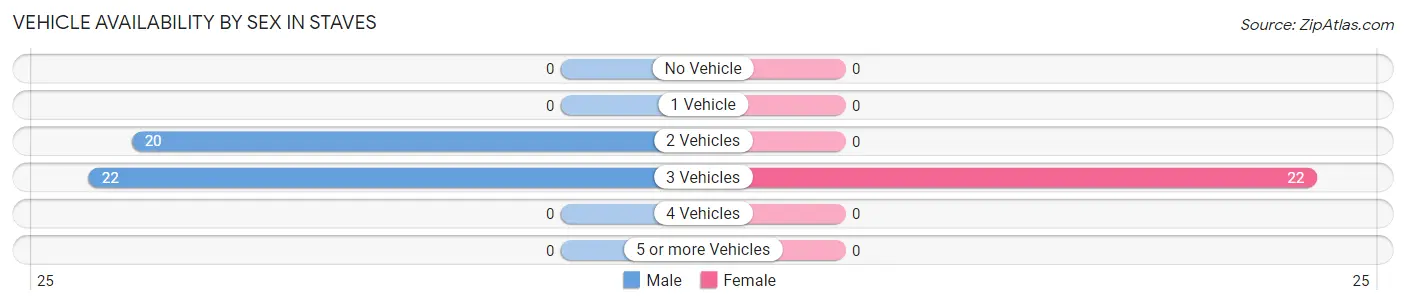
| Vehicles Available | Male | Female |
| No Vehicle | 0 (0.0%) | 0 (0.0%) |
| 1 Vehicle | 0 (0.0%) | 0 (0.0%) |
| 2 Vehicles | 20 (47.6%) | 0 (0.0%) |
| 3 Vehicles | 22 (52.4%) | 22 (100.0%) |
| 4 Vehicles | 0 (0.0%) | 0 (0.0%) |
| 5 or more Vehicles | 0 (0.0%) | 0 (0.0%) |
| Total | 42 (100.0%) | 22 (100.0%) |
Commute Time in Staves
The most frequently occuring commute durations in Staves are 45 to 59 minutes (42 commuters, 65.6%), 10 to 14 minutes (22 commuters, 34.4%), and less than 5 minutes (0 commuters, 0.0%).
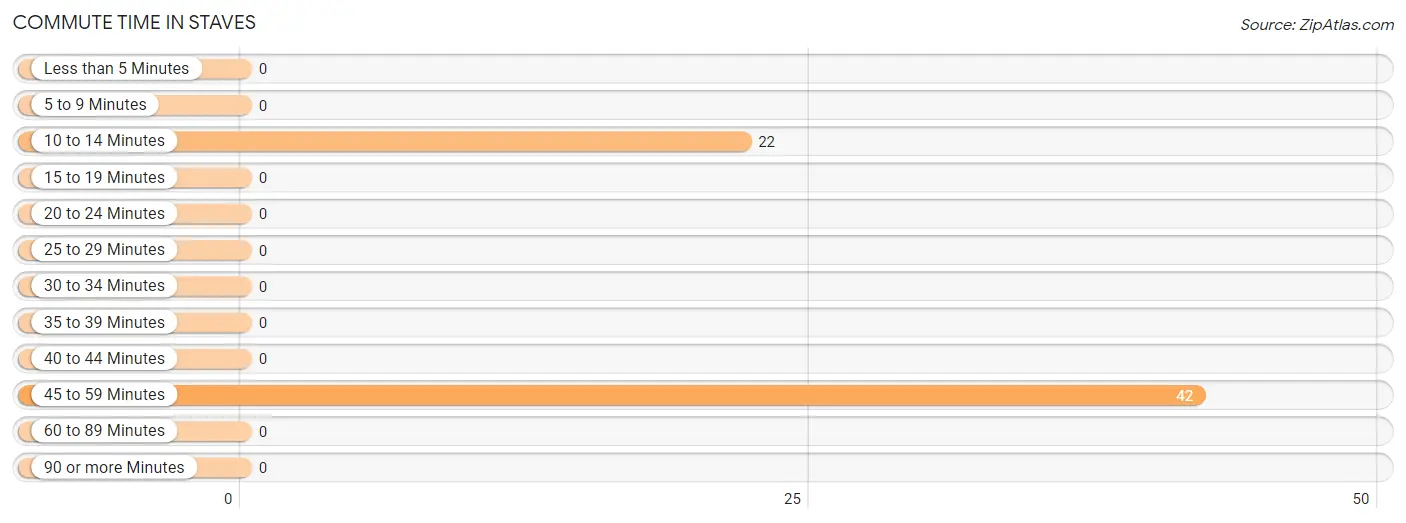
| Commute Time | # Commuters | % Commuters |
| Less than 5 Minutes | 0 | 0.0% |
| 5 to 9 Minutes | 0 | 0.0% |
| 10 to 14 Minutes | 22 | 34.4% |
| 15 to 19 Minutes | 0 | 0.0% |
| 20 to 24 Minutes | 0 | 0.0% |
| 25 to 29 Minutes | 0 | 0.0% |
| 30 to 34 Minutes | 0 | 0.0% |
| 35 to 39 Minutes | 0 | 0.0% |
| 40 to 44 Minutes | 0 | 0.0% |
| 45 to 59 Minutes | 42 | 65.6% |
| 60 to 89 Minutes | 0 | 0.0% |
| 90 or more Minutes | 0 | 0.0% |
Commute Time by Sex in Staves
The most common commute times in Staves are 45 to 59 minutes (42 commuters, 100.0%) for males and 10 to 14 minutes (22 commuters, 100.0%) for females.
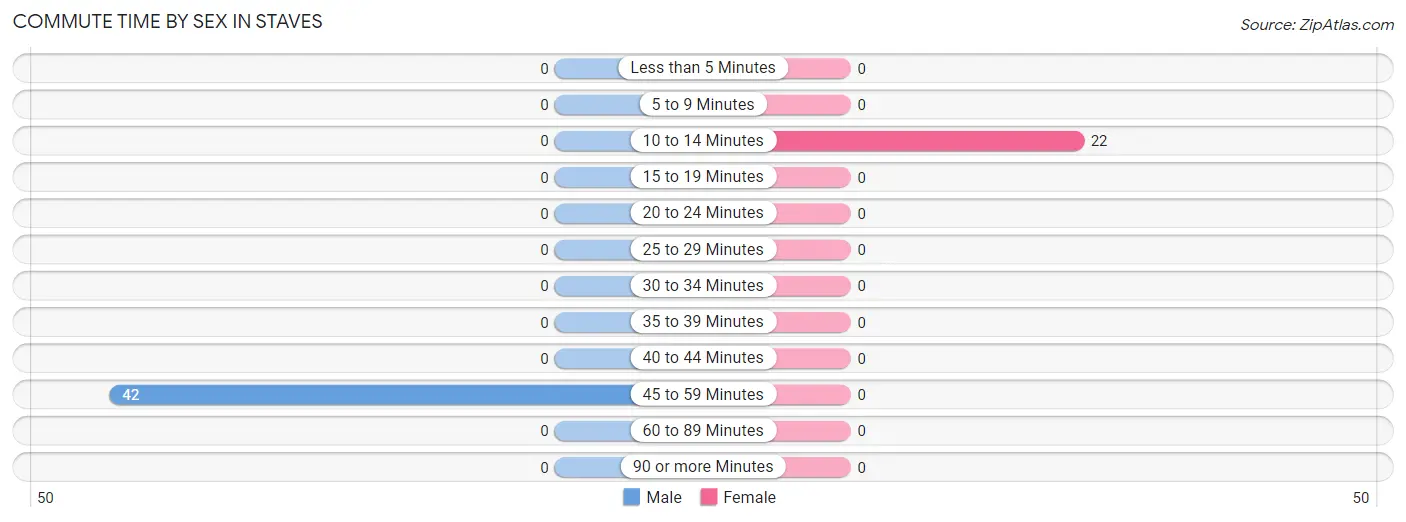
| Commute Time | Male | Female |
| Less than 5 Minutes | 0 (0.0%) | 0 (0.0%) |
| 5 to 9 Minutes | 0 (0.0%) | 0 (0.0%) |
| 10 to 14 Minutes | 0 (0.0%) | 22 (100.0%) |
| 15 to 19 Minutes | 0 (0.0%) | 0 (0.0%) |
| 20 to 24 Minutes | 0 (0.0%) | 0 (0.0%) |
| 25 to 29 Minutes | 0 (0.0%) | 0 (0.0%) |
| 30 to 34 Minutes | 0 (0.0%) | 0 (0.0%) |
| 35 to 39 Minutes | 0 (0.0%) | 0 (0.0%) |
| 40 to 44 Minutes | 0 (0.0%) | 0 (0.0%) |
| 45 to 59 Minutes | 42 (100.0%) | 0 (0.0%) |
| 60 to 89 Minutes | 0 (0.0%) | 0 (0.0%) |
| 90 or more Minutes | 0 (0.0%) | 0 (0.0%) |
Time of Departure to Work by Sex in Staves
The most frequent times of departure to work in Staves are 8:00 AM to 8:29 AM (22, 52.4%) for males and 7:00 AM to 7:29 AM (22, 100.0%) for females.
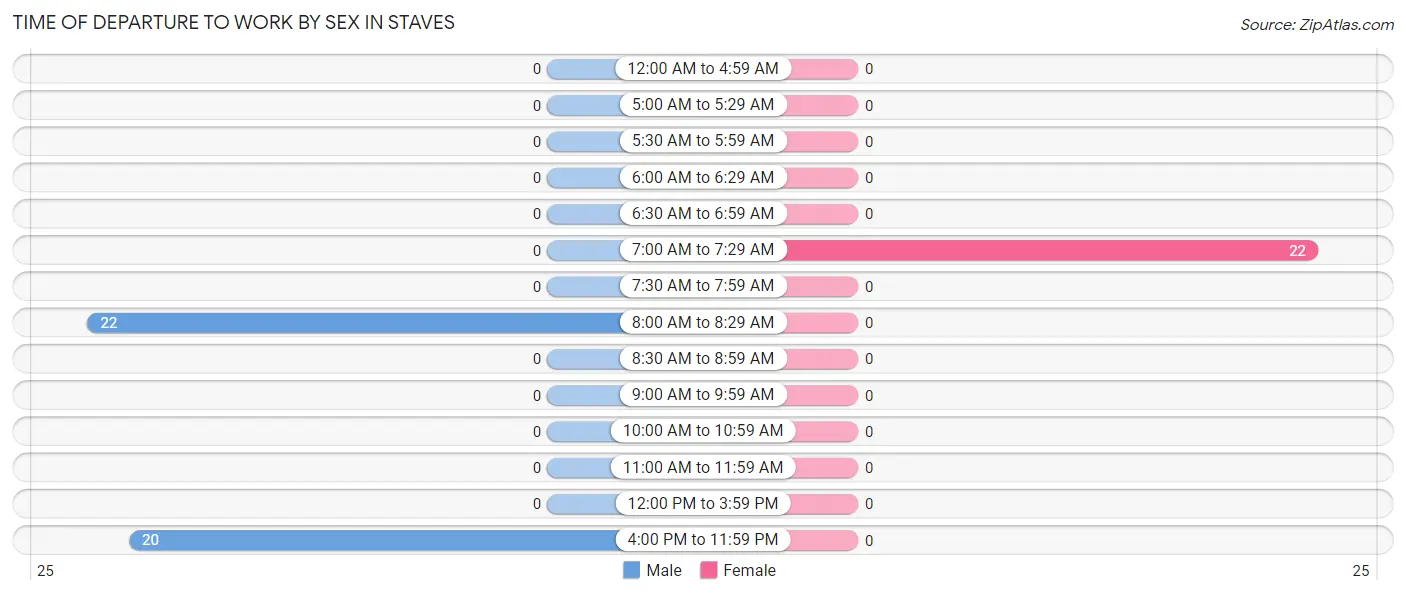
| Time of Departure | Male | Female |
| 12:00 AM to 4:59 AM | 0 (0.0%) | 0 (0.0%) |
| 5:00 AM to 5:29 AM | 0 (0.0%) | 0 (0.0%) |
| 5:30 AM to 5:59 AM | 0 (0.0%) | 0 (0.0%) |
| 6:00 AM to 6:29 AM | 0 (0.0%) | 0 (0.0%) |
| 6:30 AM to 6:59 AM | 0 (0.0%) | 0 (0.0%) |
| 7:00 AM to 7:29 AM | 0 (0.0%) | 22 (100.0%) |
| 7:30 AM to 7:59 AM | 0 (0.0%) | 0 (0.0%) |
| 8:00 AM to 8:29 AM | 22 (52.4%) | 0 (0.0%) |
| 8:30 AM to 8:59 AM | 0 (0.0%) | 0 (0.0%) |
| 9:00 AM to 9:59 AM | 0 (0.0%) | 0 (0.0%) |
| 10:00 AM to 10:59 AM | 0 (0.0%) | 0 (0.0%) |
| 11:00 AM to 11:59 AM | 0 (0.0%) | 0 (0.0%) |
| 12:00 PM to 3:59 PM | 0 (0.0%) | 0 (0.0%) |
| 4:00 PM to 11:59 PM | 20 (47.6%) | 0 (0.0%) |
| Total | 42 (100.0%) | 22 (100.0%) |
Housing Occupancy in Staves
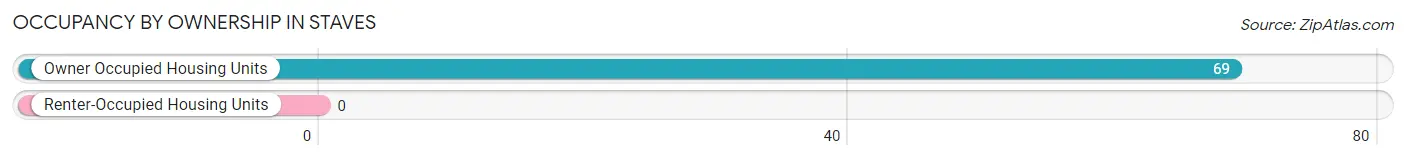
Occupancy by Ownership in Staves
Of the total 69 dwellings in Staves, owner-occupied units account for 69 (100.0%), while renter-occupied units make up 0 (0.0%).
| Occupancy | # Housing Units | % Housing Units |
| Owner Occupied Housing Units | 69 | 100.0% |
| Renter-Occupied Housing Units | 0 | 0.0% |
| Total Occupied Housing Units | 69 | 100.0% |
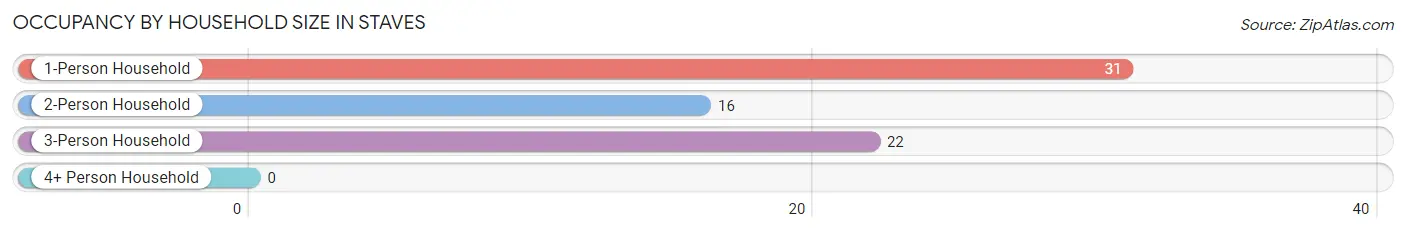
Occupancy by Household Size in Staves
| Household Size | # Housing Units | % Housing Units |
| 1-Person Household | 31 | 44.9% |
| 2-Person Household | 16 | 23.2% |
| 3-Person Household | 22 | 31.9% |
| 4+ Person Household | 0 | 0.0% |
| Total Housing Units | 69 | 100.0% |
Occupancy by Ownership by Household Size in Staves
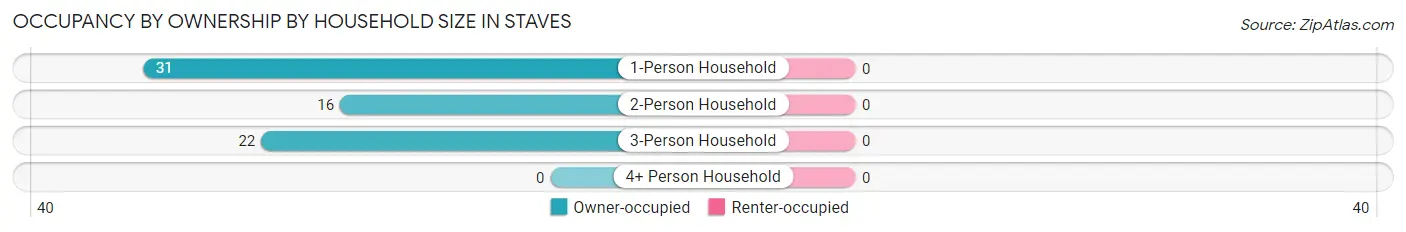
| Household Size | Owner-occupied | Renter-occupied |
| 1-Person Household | 31 (100.0%) | 0 (0.0%) |
| 2-Person Household | 16 (100.0%) | 0 (0.0%) |
| 3-Person Household | 22 (100.0%) | 0 (0.0%) |
| 4+ Person Household | 0 (0.0%) | 0 (0.0%) |
| Total Housing Units | 69 (100.0%) | 0 (0.0%) |
Occupancy by Educational Attainment in Staves
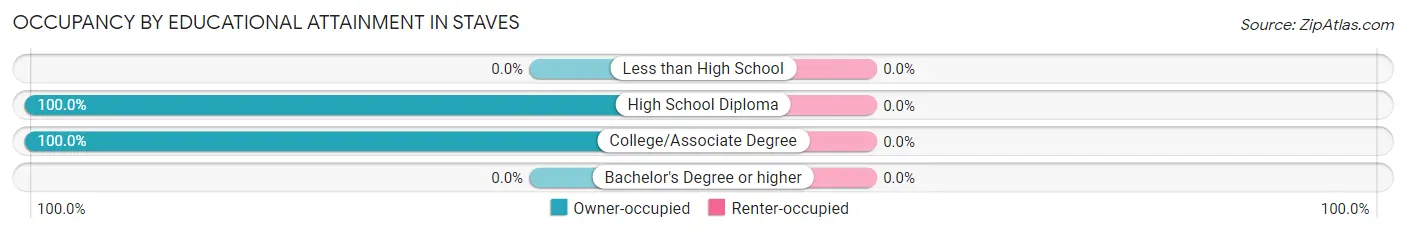
| Household Size | Owner-occupied | Renter-occupied |
| Less than High School | 0 (0.0%) | 0 (0.0%) |
| High School Diploma | 12 (100.0%) | 0 (0.0%) |
| College/Associate Degree | 57 (100.0%) | 0 (0.0%) |
| Bachelor's Degree or higher | 0 (0.0%) | 0 (0.0%) |
Occupancy by Age of Householder in Staves
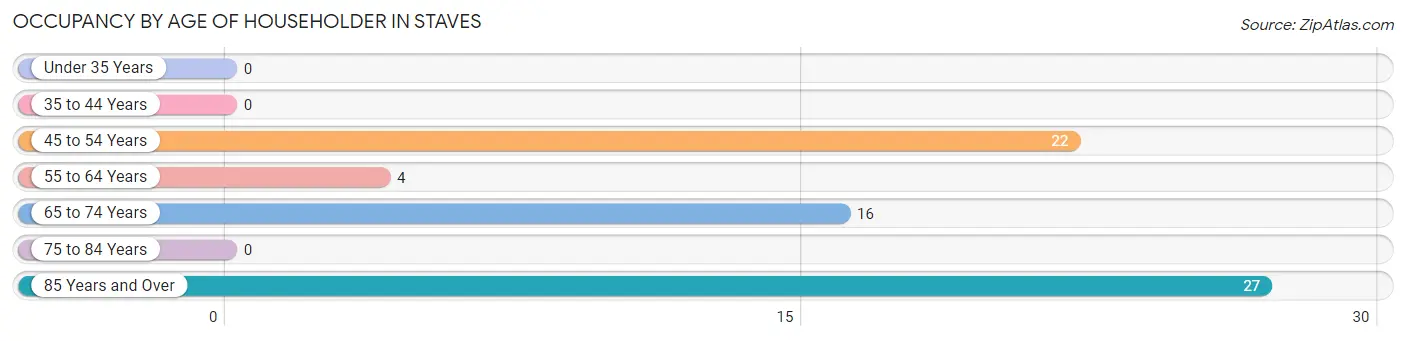
| Age Bracket | # Households | % Households |
| Under 35 Years | 0 | 0.0% |
| 35 to 44 Years | 0 | 0.0% |
| 45 to 54 Years | 22 | 31.9% |
| 55 to 64 Years | 4 | 5.8% |
| 65 to 74 Years | 16 | 23.2% |
| 75 to 84 Years | 0 | 0.0% |
| 85 Years and Over | 27 | 39.1% |
| Total | 69 | 100.0% |
Housing Finances in Staves
Median Income by Occupancy in Staves
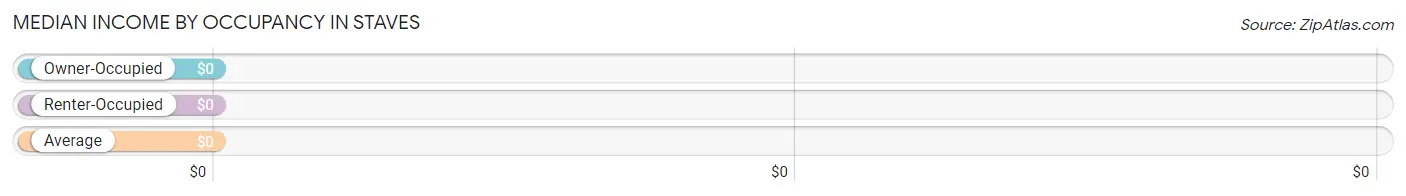
| Occupancy Type | # Households | Median Income |
| Owner-Occupied | 69 (100.0%) | $0 |
| Renter-Occupied | 0 (0.0%) | $0 |
| Average | 69 (100.0%) | $0 |
Occupancy by Householder Income Bracket in Staves
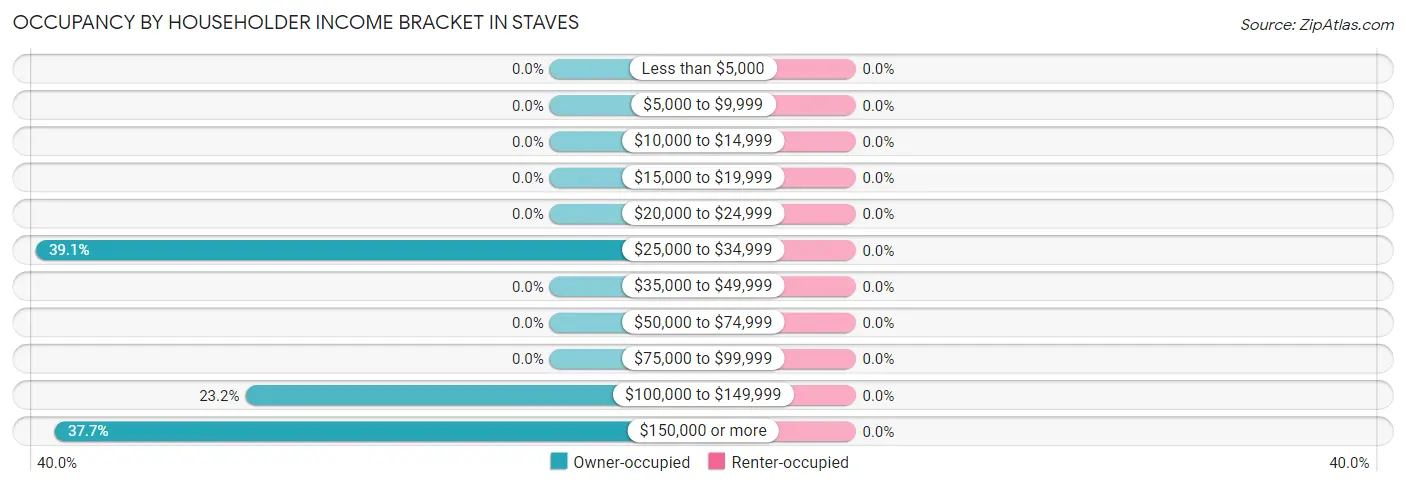
| Income Bracket | Owner-occupied | Renter-occupied |
| Less than $5,000 | 0 (0.0%) | 0 (0.0%) |
| $5,000 to $9,999 | 0 (0.0%) | 0 (0.0%) |
| $10,000 to $14,999 | 0 (0.0%) | 0 (0.0%) |
| $15,000 to $19,999 | 0 (0.0%) | 0 (0.0%) |
| $20,000 to $24,999 | 0 (0.0%) | 0 (0.0%) |
| $25,000 to $34,999 | 27 (39.1%) | 0 (0.0%) |
| $35,000 to $49,999 | 0 (0.0%) | 0 (0.0%) |
| $50,000 to $74,999 | 0 (0.0%) | 0 (0.0%) |
| $75,000 to $99,999 | 0 (0.0%) | 0 (0.0%) |
| $100,000 to $149,999 | 16 (23.2%) | 0 (0.0%) |
| $150,000 or more | 26 (37.7%) | 0 (0.0%) |
| Total | 69 (100.0%) | 0 (0.0%) |
Monthly Housing Cost Tiers in Staves
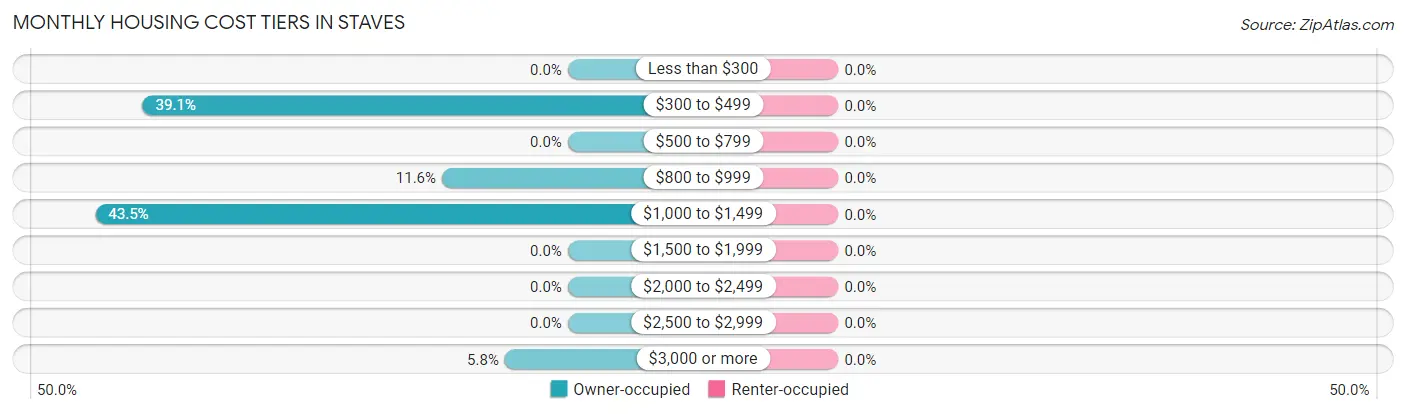
| Monthly Cost | Owner-occupied | Renter-occupied |
| Less than $300 | 0 (0.0%) | 0 (0.0%) |
| $300 to $499 | 27 (39.1%) | 0 (0.0%) |
| $500 to $799 | 0 (0.0%) | 0 (0.0%) |
| $800 to $999 | 8 (11.6%) | 0 (0.0%) |
| $1,000 to $1,499 | 30 (43.5%) | 0 (0.0%) |
| $1,500 to $1,999 | 0 (0.0%) | 0 (0.0%) |
| $2,000 to $2,499 | 0 (0.0%) | 0 (0.0%) |
| $2,500 to $2,999 | 0 (0.0%) | 0 (0.0%) |
| $3,000 or more | 4 (5.8%) | 0 (0.0%) |
| Total | 69 (100.0%) | 0 (0.0%) |
Physical Housing Characteristics in Staves
Housing Structures in Staves
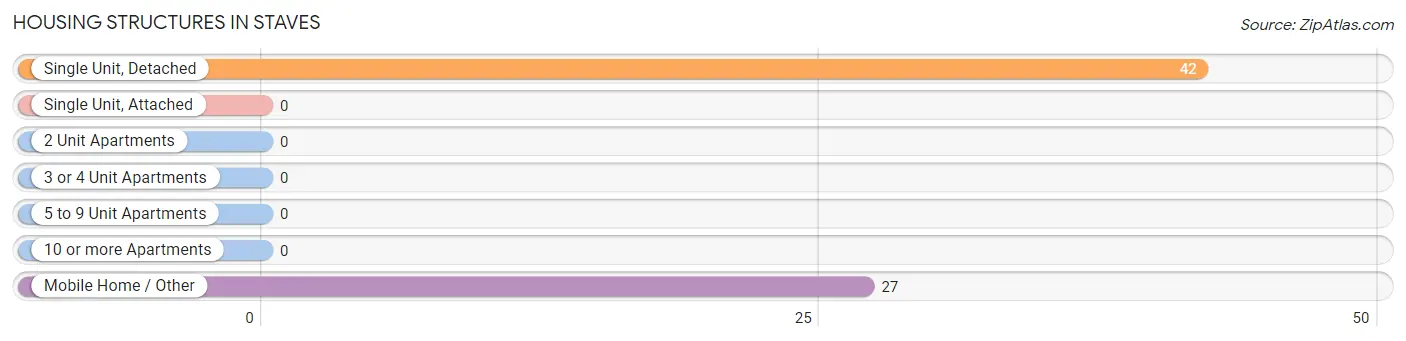
| Structure Type | # Housing Units | % Housing Units |
| Single Unit, Detached | 42 | 60.9% |
| Single Unit, Attached | 0 | 0.0% |
| 2 Unit Apartments | 0 | 0.0% |
| 3 or 4 Unit Apartments | 0 | 0.0% |
| 5 to 9 Unit Apartments | 0 | 0.0% |
| 10 or more Apartments | 0 | 0.0% |
| Mobile Home / Other | 27 | 39.1% |
| Total | 69 | 100.0% |
Housing Structures by Occupancy in Staves
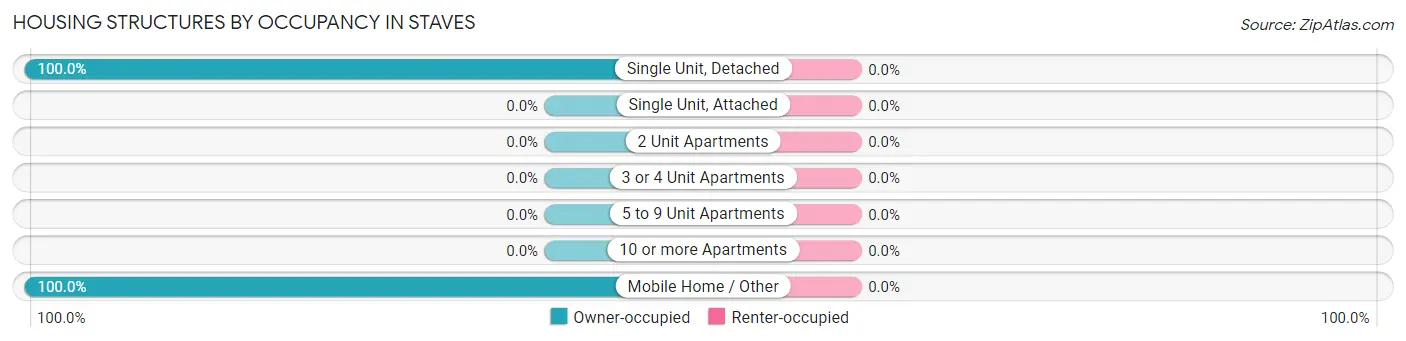
| Structure Type | Owner-occupied | Renter-occupied |
| Single Unit, Detached | 42 (100.0%) | 0 (0.0%) |
| Single Unit, Attached | 0 (0.0%) | 0 (0.0%) |
| 2 Unit Apartments | 0 (0.0%) | 0 (0.0%) |
| 3 or 4 Unit Apartments | 0 (0.0%) | 0 (0.0%) |
| 5 to 9 Unit Apartments | 0 (0.0%) | 0 (0.0%) |
| 10 or more Apartments | 0 (0.0%) | 0 (0.0%) |
| Mobile Home / Other | 27 (100.0%) | 0 (0.0%) |
| Total | 69 (100.0%) | 0 (0.0%) |
Housing Structures by Number of Rooms in Staves
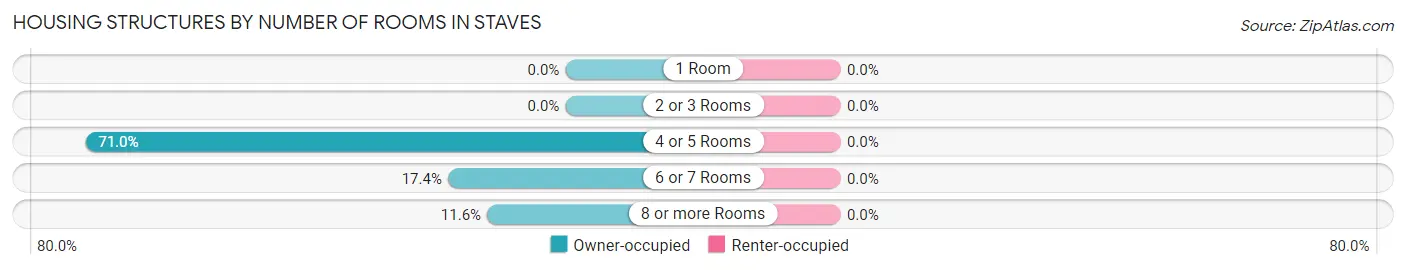
| Number of Rooms | Owner-occupied | Renter-occupied |
| 1 Room | 0 (0.0%) | 0 (0.0%) |
| 2 or 3 Rooms | 0 (0.0%) | 0 (0.0%) |
| 4 or 5 Rooms | 49 (71.0%) | 0 (0.0%) |
| 6 or 7 Rooms | 12 (17.4%) | 0 (0.0%) |
| 8 or more Rooms | 8 (11.6%) | 0 (0.0%) |
| Total | 69 (100.0%) | 0 (0.0%) |
Housing Structure by Heating Type in Staves
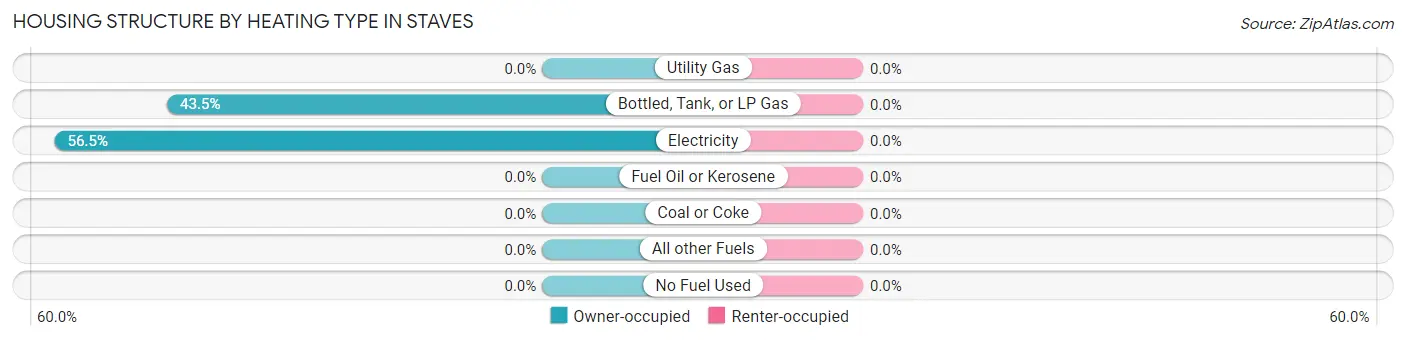
| Heating Type | Owner-occupied | Renter-occupied |
| Utility Gas | 0 (0.0%) | 0 (0.0%) |
| Bottled, Tank, or LP Gas | 30 (43.5%) | 0 (0.0%) |
| Electricity | 39 (56.5%) | 0 (0.0%) |
| Fuel Oil or Kerosene | 0 (0.0%) | 0 (0.0%) |
| Coal or Coke | 0 (0.0%) | 0 (0.0%) |
| All other Fuels | 0 (0.0%) | 0 (0.0%) |
| No Fuel Used | 0 (0.0%) | 0 (0.0%) |
| Total | 69 (100.0%) | 0 (0.0%) |
Household Vehicle Usage in Staves
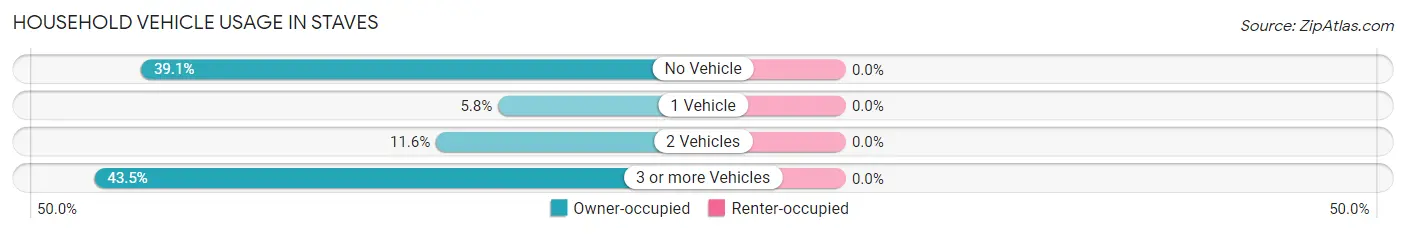
| Vehicles per Household | Owner-occupied | Renter-occupied |
| No Vehicle | 27 (39.1%) | 0 (0.0%) |
| 1 Vehicle | 4 (5.8%) | 0 (0.0%) |
| 2 Vehicles | 8 (11.6%) | 0 (0.0%) |
| 3 or more Vehicles | 30 (43.5%) | 0 (0.0%) |
| Total | 69 (100.0%) | 0 (0.0%) |
Real Estate & Mortgages in Staves
Real Estate and Mortgage Overview in Staves
| Characteristic | Without Mortgage | With Mortgage |
| Housing Units | 43 | 26 |
| Median Property Value | - | - |
| Median Household Income | - | - |
| Monthly Housing Costs | - | - |
| Real Estate Taxes | $199 | $0 |
Property Value by Mortgage Status in Staves
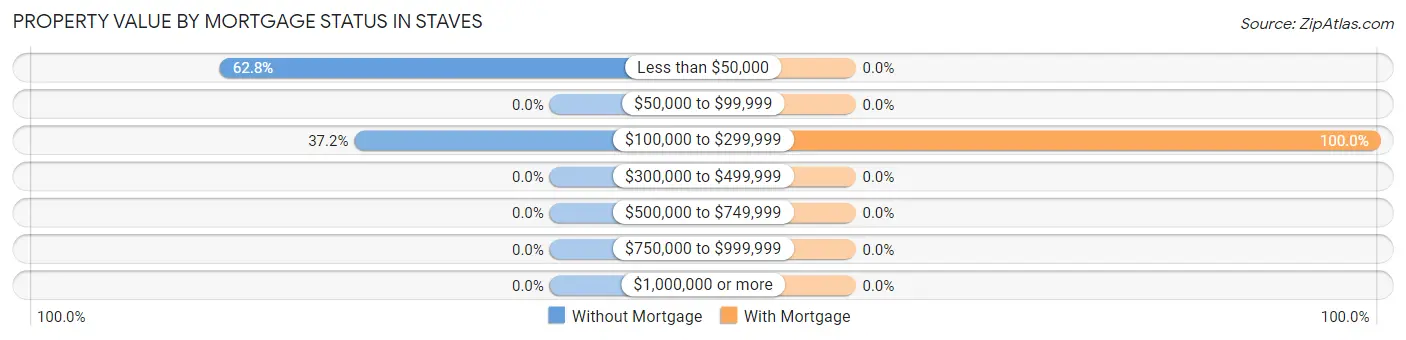
| Property Value | Without Mortgage | With Mortgage |
| Less than $50,000 | 27 (62.8%) | 0 (0.0%) |
| $50,000 to $99,999 | 0 (0.0%) | 0 (0.0%) |
| $100,000 to $299,999 | 16 (37.2%) | 26 (100.0%) |
| $300,000 to $499,999 | 0 (0.0%) | 0 (0.0%) |
| $500,000 to $749,999 | 0 (0.0%) | 0 (0.0%) |
| $750,000 to $999,999 | 0 (0.0%) | 0 (0.0%) |
| $1,000,000 or more | 0 (0.0%) | 0 (0.0%) |
| Total | 43 (100.0%) | 26 (100.0%) |
Household Income by Mortgage Status in Staves
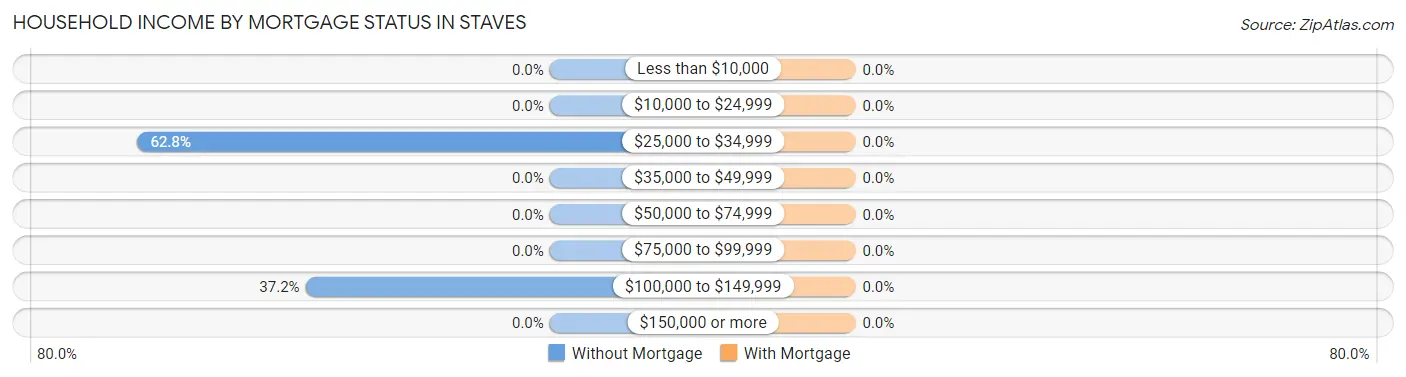
| Household Income | Without Mortgage | With Mortgage |
| Less than $10,000 | 0 (0.0%) | 0 (0.0%) |
| $10,000 to $24,999 | 0 (0.0%) | 0 (0.0%) |
| $25,000 to $34,999 | 27 (62.8%) | 0 (0.0%) |
| $35,000 to $49,999 | 0 (0.0%) | 0 (0.0%) |
| $50,000 to $74,999 | 0 (0.0%) | 0 (0.0%) |
| $75,000 to $99,999 | 0 (0.0%) | 0 (0.0%) |
| $100,000 to $149,999 | 16 (37.2%) | 0 (0.0%) |
| $150,000 or more | 0 (0.0%) | 0 (0.0%) |
| Total | 43 (100.0%) | 26 (100.0%) |
Property Value to Household Income Ratio in Staves
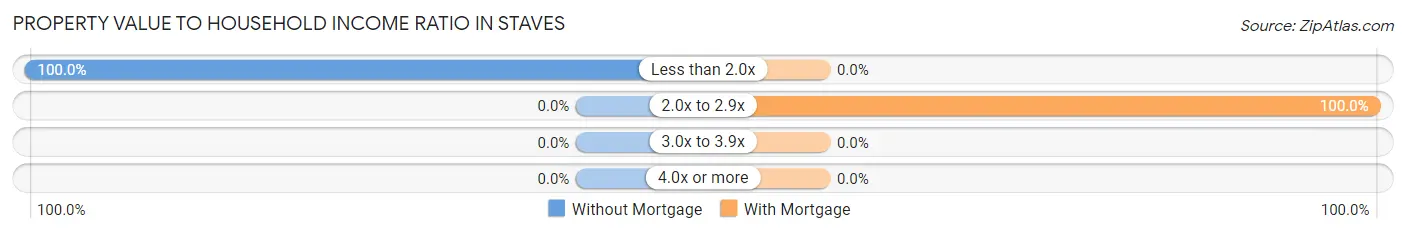
| Value-to-Income Ratio | Without Mortgage | With Mortgage |
| Less than 2.0x | 43 (100.0%) | 0 (0.0%) |
| 2.0x to 2.9x | 0 (0.0%) | 26 (100.0%) |
| 3.0x to 3.9x | 0 (0.0%) | 0 (0.0%) |
| 4.0x or more | 0 (0.0%) | 0 (0.0%) |
| Total | 43 (100.0%) | 26 (100.0%) |
Real Estate Taxes by Mortgage Status in Staves
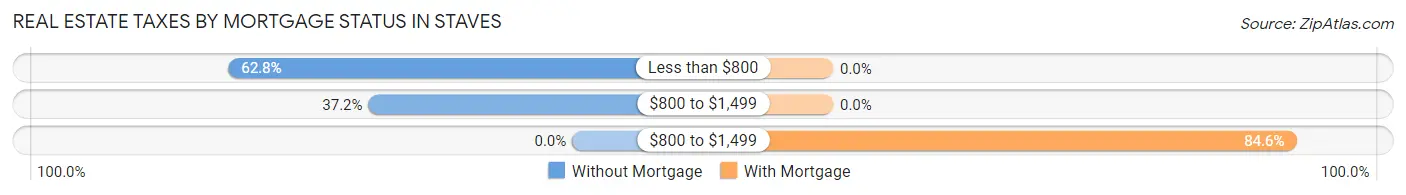
| Property Taxes | Without Mortgage | With Mortgage |
| Less than $800 | 27 (62.8%) | 0 (0.0%) |
| $800 to $1,499 | 16 (37.2%) | 0 (0.0%) |
| $800 to $1,499 | 0 (0.0%) | 22 (84.6%) |
| Total | 43 (100.0%) | 26 (100.0%) |
Health & Disability in Staves
Health Insurance Coverage by Age in Staves
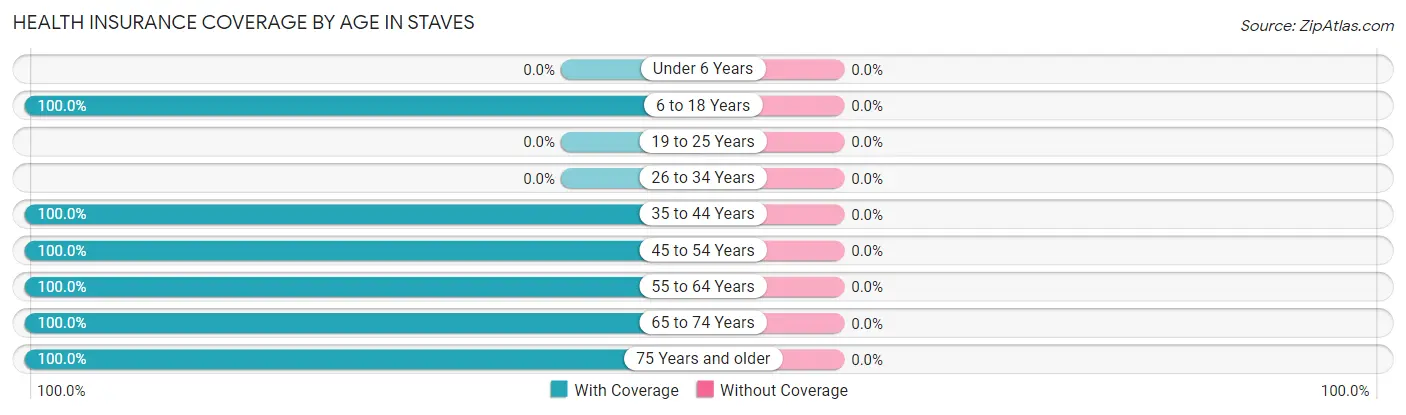
| Age Bracket | With Coverage | Without Coverage |
| Under 6 Years | 0 (0.0%) | 0 (0.0%) |
| 6 to 18 Years | 26 (100.0%) | 0 (0.0%) |
| 19 to 25 Years | 0 (0.0%) | 0 (0.0%) |
| 26 to 34 Years | 0 (0.0%) | 0 (0.0%) |
| 35 to 44 Years | 20 (100.0%) | 0 (0.0%) |
| 45 to 54 Years | 22 (100.0%) | 0 (0.0%) |
| 55 to 64 Years | 26 (100.0%) | 0 (0.0%) |
| 65 to 74 Years | 24 (100.0%) | 0 (0.0%) |
| 75 Years and older | 27 (100.0%) | 0 (0.0%) |
| Total | 145 (100.0%) | 0 (0.0%) |
Health Insurance Coverage by Citizenship Status in Staves
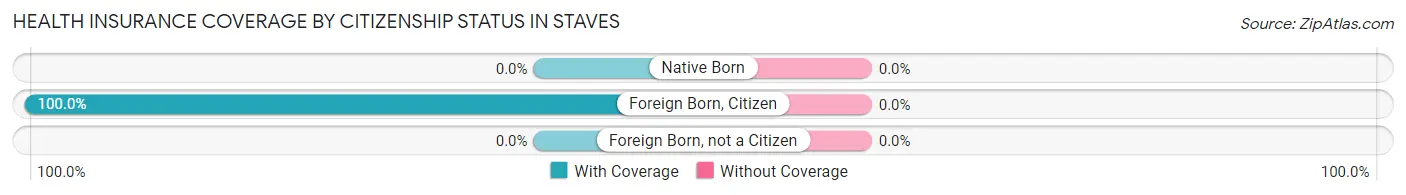
| Citizenship Status | With Coverage | Without Coverage |
| Native Born | 0 (0.0%) | 0 (0.0%) |
| Foreign Born, Citizen | 26 (100.0%) | 0 (0.0%) |
| Foreign Born, not a Citizen | 0 (0.0%) | 0 (0.0%) |
Health Insurance Coverage by Household Income in Staves
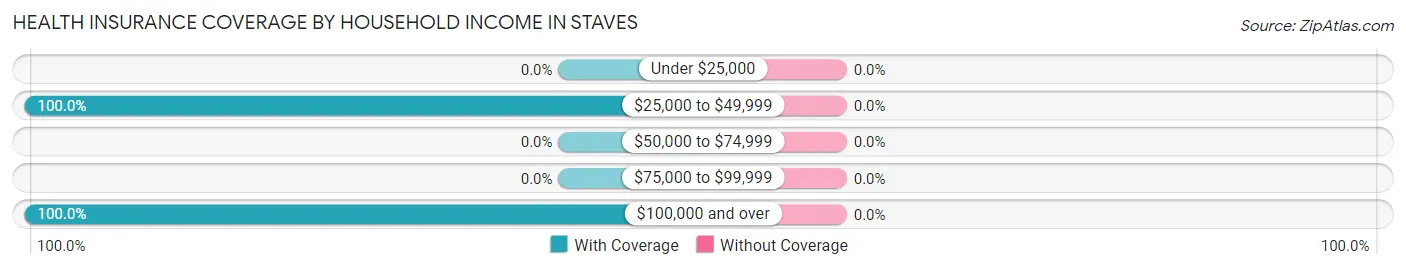
| Household Income | With Coverage | Without Coverage |
| Under $25,000 | 0 (0.0%) | 0 (0.0%) |
| $25,000 to $49,999 | 27 (100.0%) | 0 (0.0%) |
| $50,000 to $74,999 | 0 (0.0%) | 0 (0.0%) |
| $75,000 to $99,999 | 0 (0.0%) | 0 (0.0%) |
| $100,000 and over | 118 (100.0%) | 0 (0.0%) |
Public vs Private Health Insurance Coverage by Age in Staves
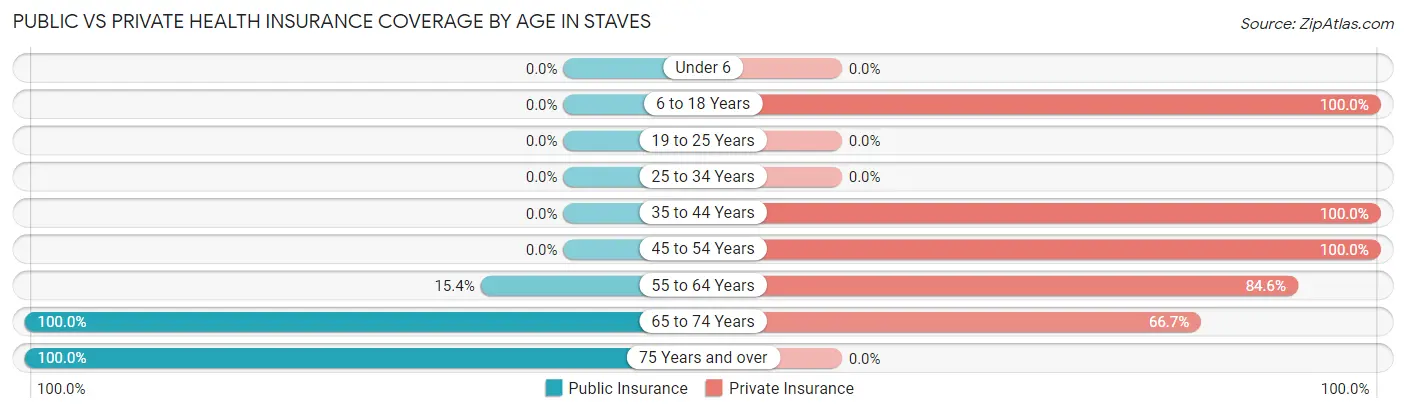
| Age Bracket | Public Insurance | Private Insurance |
| Under 6 | 0 (0.0%) | 0 (0.0%) |
| 6 to 18 Years | 0 (0.0%) | 26 (100.0%) |
| 19 to 25 Years | 0 (0.0%) | 0 (0.0%) |
| 25 to 34 Years | 0 (0.0%) | 0 (0.0%) |
| 35 to 44 Years | 0 (0.0%) | 20 (100.0%) |
| 45 to 54 Years | 0 (0.0%) | 22 (100.0%) |
| 55 to 64 Years | 4 (15.4%) | 22 (84.6%) |
| 65 to 74 Years | 24 (100.0%) | 16 (66.7%) |
| 75 Years and over | 27 (100.0%) | 0 (0.0%) |
| Total | 55 (37.9%) | 106 (73.1%) |
Disability Status by Sex by Age in Staves
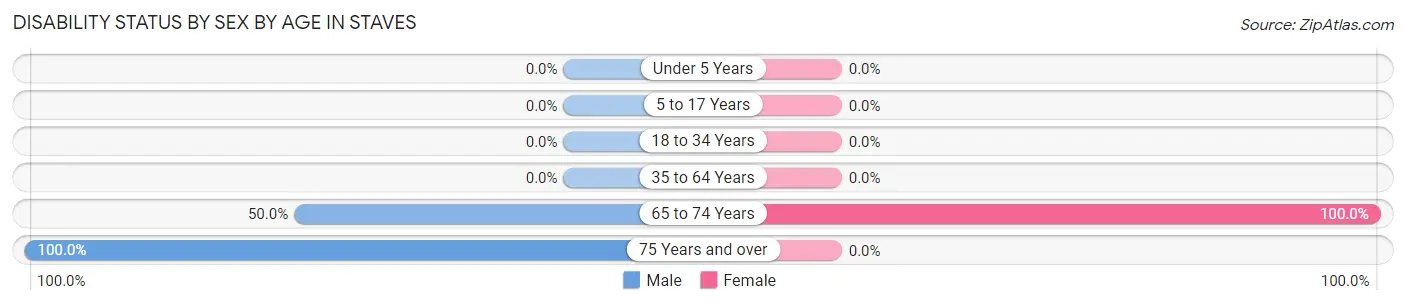
| Age Bracket | Male | Female |
| Under 5 Years | 0 (0.0%) | 0 (0.0%) |
| 5 to 17 Years | 0 (0.0%) | 0 (0.0%) |
| 18 to 34 Years | 0 (0.0%) | 0 (0.0%) |
| 35 to 64 Years | 0 (0.0%) | 0 (0.0%) |
| 65 to 74 Years | 8 (50.0%) | 8 (100.0%) |
| 75 Years and over | 27 (100.0%) | 0 (0.0%) |
Disability Class by Sex by Age in Staves
Disability Class: Hearing Difficulty
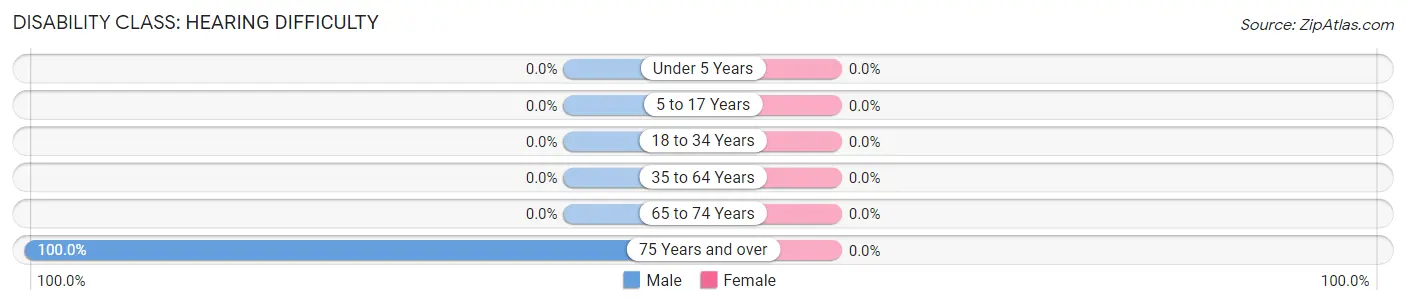
| Age Bracket | Male | Female |
| Under 5 Years | 0 (0.0%) | 0 (0.0%) |
| 5 to 17 Years | 0 (0.0%) | 0 (0.0%) |
| 18 to 34 Years | 0 (0.0%) | 0 (0.0%) |
| 35 to 64 Years | 0 (0.0%) | 0 (0.0%) |
| 65 to 74 Years | 0 (0.0%) | 0 (0.0%) |
| 75 Years and over | 27 (100.0%) | 0 (0.0%) |
Disability Class: Vision Difficulty
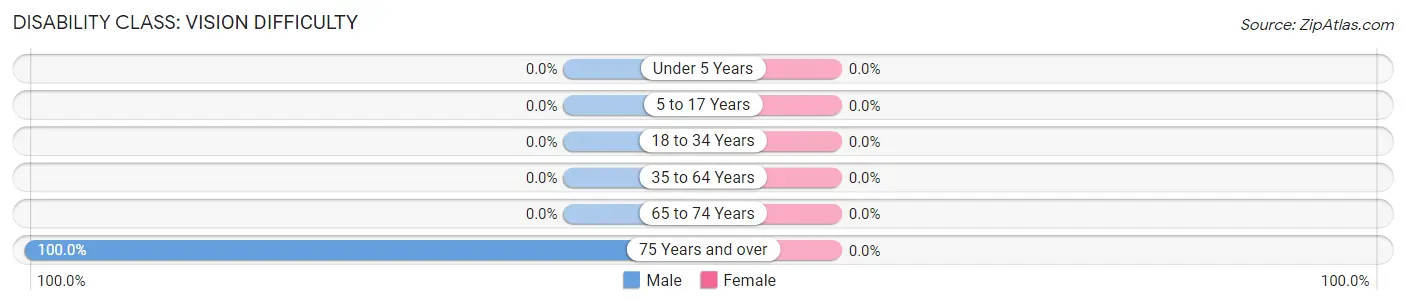
| Age Bracket | Male | Female |
| Under 5 Years | 0 (0.0%) | 0 (0.0%) |
| 5 to 17 Years | 0 (0.0%) | 0 (0.0%) |
| 18 to 34 Years | 0 (0.0%) | 0 (0.0%) |
| 35 to 64 Years | 0 (0.0%) | 0 (0.0%) |
| 65 to 74 Years | 0 (0.0%) | 0 (0.0%) |
| 75 Years and over | 27 (100.0%) | 0 (0.0%) |
Disability Class: Cognitive Difficulty
| Age Bracket | Male | Female |
| 5 to 17 Years | 0 (0.0%) | 0 (0.0%) |
| 18 to 34 Years | 0 (0.0%) | 0 (0.0%) |
| 35 to 64 Years | 0 (0.0%) | 0 (0.0%) |
| 65 to 74 Years | 0 (0.0%) | 0 (0.0%) |
| 75 Years and over | 0 (0.0%) | 0 (0.0%) |
Disability Class: Ambulatory Difficulty
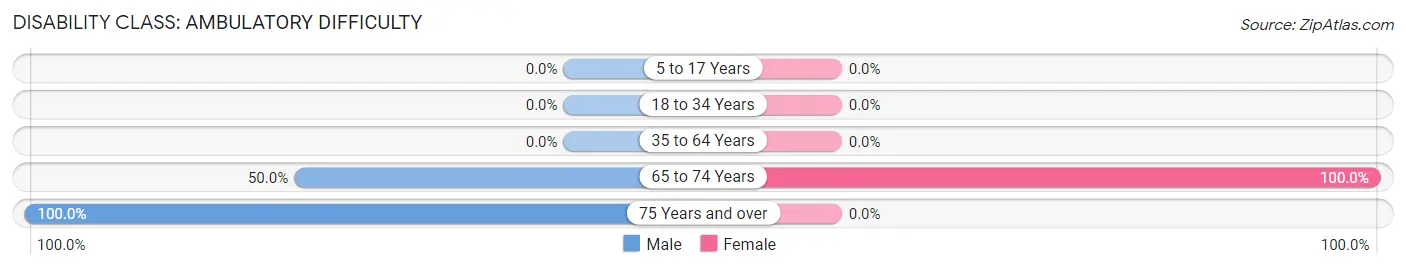
| Age Bracket | Male | Female |
| 5 to 17 Years | 0 (0.0%) | 0 (0.0%) |
| 18 to 34 Years | 0 (0.0%) | 0 (0.0%) |
| 35 to 64 Years | 0 (0.0%) | 0 (0.0%) |
| 65 to 74 Years | 8 (50.0%) | 8 (100.0%) |
| 75 Years and over | 27 (100.0%) | 0 (0.0%) |
Disability Class: Self-Care Difficulty
| Age Bracket | Male | Female |
| 5 to 17 Years | 0 (0.0%) | 0 (0.0%) |
| 18 to 34 Years | 0 (0.0%) | 0 (0.0%) |
| 35 to 64 Years | 0 (0.0%) | 0 (0.0%) |
| 65 to 74 Years | 0 (0.0%) | 0 (0.0%) |
| 75 Years and over | 0 (0.0%) | 0 (0.0%) |
Technology Access in Staves
Computing Device Access in Staves
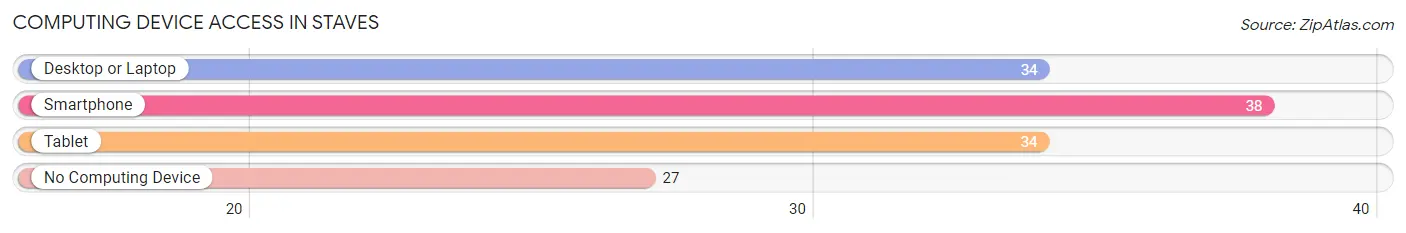
| Device Type | # Households | % Households |
| Desktop or Laptop | 34 | 49.3% |
| Smartphone | 38 | 55.1% |
| Tablet | 34 | 49.3% |
| No Computing Device | 27 | 39.1% |
| Total | 69 | 100.0% |
Internet Access in Staves
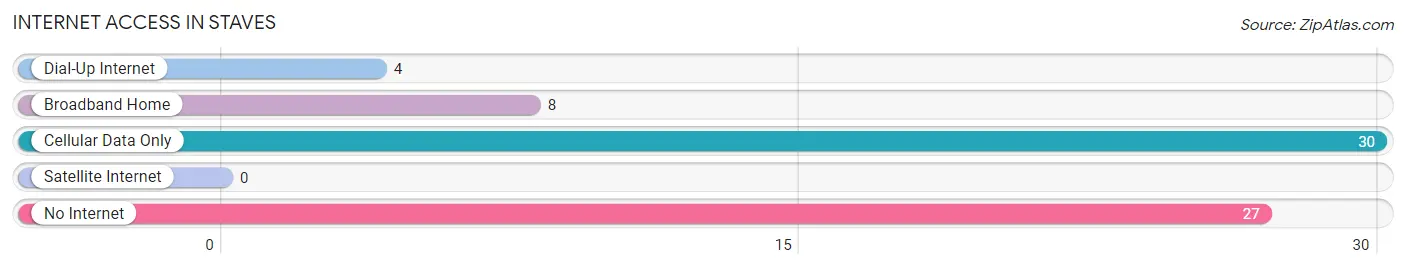
| Internet Type | # Households | % Households |
| Dial-Up Internet | 4 | 5.8% |
| Broadband Home | 8 | 11.6% |
| Cellular Data Only | 30 | 43.5% |
| Satellite Internet | 0 | 0.0% |
| No Internet | 27 | 39.1% |
| Total | 69 | 100.0% |
Staves Summary
The state of Arkansas is located in the southern region of the United States and is bordered by six other states: Missouri, Tennessee, Mississippi, Louisiana, Texas, and Oklahoma. Arkansas is the 29th most populous state in the United States, with a population of 2,959,373 as of 2019. The capital of Arkansas is Little Rock, located in the center of the state.
History
The history of Arkansas dates back to the early 16th century when the first Europeans arrived in the area. The first Europeans to explore the area were Spanish explorers, who arrived in 1541. The first permanent settlement in Arkansas was established in 1686 by French explorers. The area was part of the Louisiana Purchase in 1803, and became part of the United States. Arkansas was admitted to the Union as the 25th state in 1836.
During the Civil War, Arkansas was a Confederate state and was the site of several battles. After the war, Arkansas was readmitted to the Union in 1868. During the Reconstruction era, Arkansas experienced a period of economic growth and development.
Geography
Arkansas is located in the south-central region of the United States. It is bordered by six other states: Missouri, Tennessee, Mississippi, Louisiana, Texas, and Oklahoma. Arkansas is the 29th largest state in the United States, with an area of 53,179 square miles.
The landscape of Arkansas is diverse, with mountains, hills, valleys, and plains. The Ozark Mountains are located in the northwest corner of the state, while the Ouachita Mountains are located in the southwest corner. The Arkansas River runs through the center of the state, and is the longest river in the state.
Economy
The economy of Arkansas is largely based on agriculture, forestry, and manufacturing. The state is the leading producer of rice in the United States, and is also a major producer of cotton, soybeans, and poultry. Arkansas is also home to several large companies, including Walmart, Tyson Foods, and J.B. Hunt.
The state’s economy has experienced steady growth in recent years, with the unemployment rate dropping to 3.7% in 2019. The state’s gross domestic product (GDP) was estimated at $125.3 billion in 2018.
Demographics
As of 2019, the population of Arkansas was estimated at 2,959,373. The state is predominantly white, with 79.3% of the population identifying as white. African Americans make up 15.4% of the population, while Hispanics and Latinos make up 6.3%.
The median household income in Arkansas was estimated at $45,869 in 2018. The poverty rate in the state was estimated at 17.2% in 2018. The largest cities in Arkansas are Little Rock, Fort Smith, Fayetteville, Springdale, and Jonesboro.
Common Questions
What is Per Capita Income in Staves?
Per Capita income in Staves is $53,932.
What is the Median Family Income in Staves?
Median Family Income in Staves is $167,841.
What is Inequality or Gini Index in Staves?
Inequality or Gini Index in Staves is 0.37.
What is the Total Population of Staves?
Total Population of Staves is 145.
What is the Total Male Population of Staves?
Total Male Population of Staves is 111.
What is the Total Female Population of Staves?
Total Female Population of Staves is 34.
What is the Ratio of Males per 100 Females in Staves?
There are 326.47 Males per 100 Females in Staves.
What is the Ratio of Females per 100 Males in Staves?
There are 30.63 Females per 100 Males in Staves.
What is the Median Population Age in Staves?
Median Population Age in Staves is 57.2 Years.
What is the Average Family Size in Staves
Average Family Size in Staves is 3.0 People.
What is the Average Household Size in Staves
Average Household Size in Staves is 2.1 People.
How Large is the Labor Force in Staves?
There are 64 People in the Labor Forcein in Staves.
What is the Percentage of People in the Labor Force in Staves?
44.1% of People are in the Labor Force in Staves.