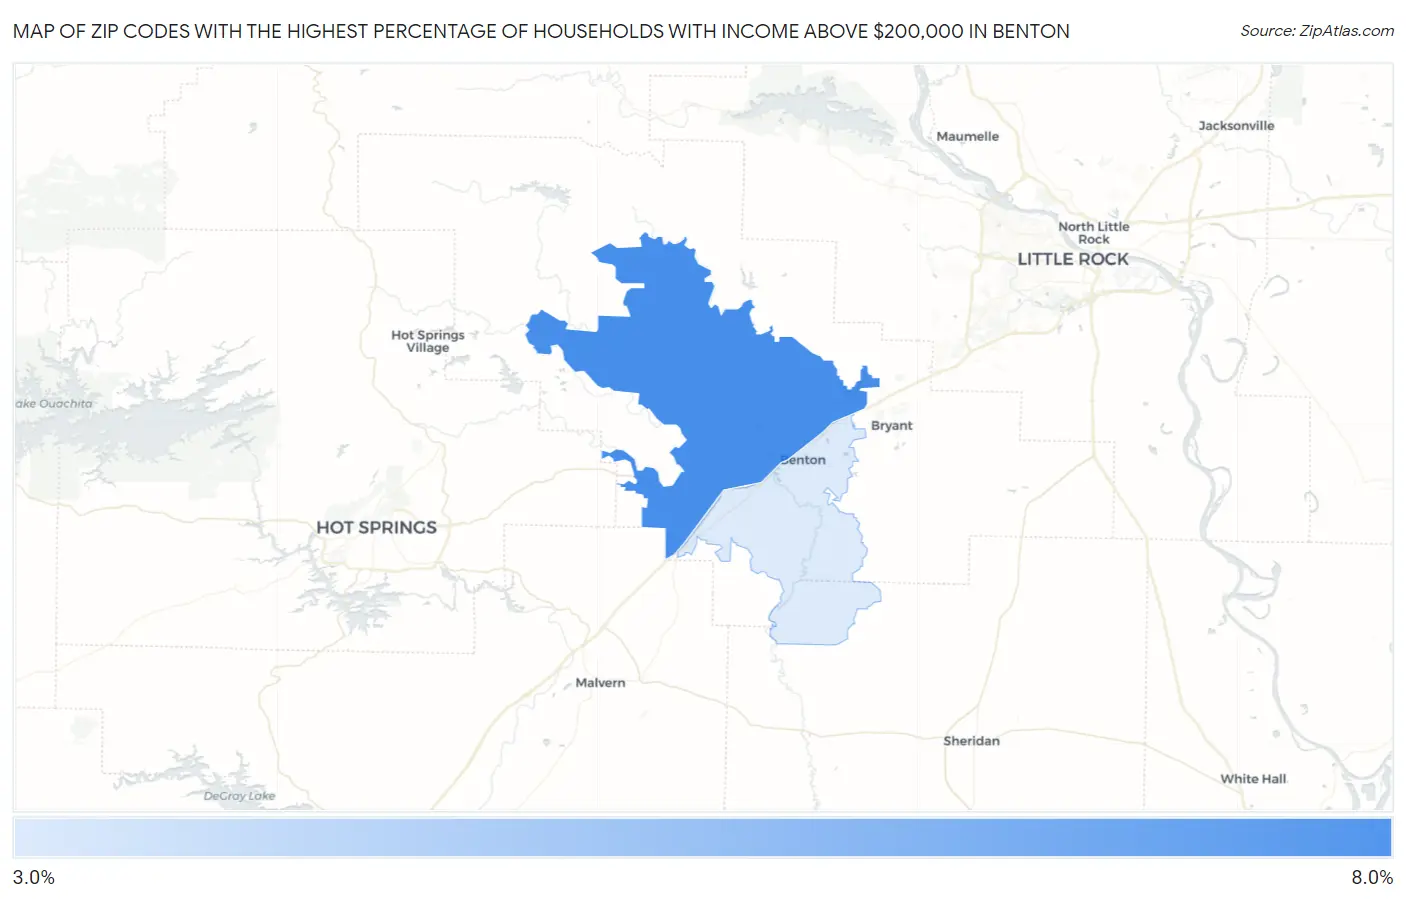
Zip Codes with the Highest Percentage of Households with Income Above $200,000 in Benton, AR
RELATED REPORTS & OPTIONS
Household Income | $200k+
Benton
Compare Zip Codes
Map of Zip Codes with the Highest Percentage of Households with Income Above $200,000 in Benton
3.2%
7.6%
Zip Codes with the Highest Percentage of Households with Income Above $200,000 in Benton, AR
| Zip Code | Households with Income > $200k | vs State | vs National | |
| 1. | 72019 | 7.6% | 5.6%(+2.00)#67 | 11.4%(-3.80)#10,913 |
| 2. | 72015 | 3.2% | 5.6%(-2.40)#201 | 11.4%(-8.20)#20,295 |
1
Common Questions
What are the Top Zip Codes with the Highest Percentage of Households with Income Above $200,000 in Benton, AR?
Top Zip Codes with the Highest Percentage of Households with Income Above $200,000 in Benton, AR are:
What zip code has the Highest Percentage of Households with Income Above $200,000 in Benton, AR?
72019 has the Highest Percentage of Households with Income Above $200,000 in Benton, AR with 7.6%.
What is the Percentage of Households with Income Above $200,000 in Benton, AR?
Percentage of Households with Income Above $200,000 in Benton is 5.0%.
What is the Percentage of Households with Income Above $200,000 in Arkansas?
Percentage of Households with Income Above $200,000 in Arkansas is 5.6%.
What is the Percentage of Households with Income Above $200,000 in the United States?
Percentage of Households with Income Above $200,000 in the United States is 11.4%.