Cale, AR Map & Demographics
Cale Map
Cale Overview
$35,732
PER CAPITA INCOME
$38,750
AVG HOUSEHOLD INCOME
0.48
INEQUALITY / GINI INDEX
69
TOTAL POPULATION
36
MALE POPULATION
33
FEMALE POPULATION
109.09
MALES / 100 FEMALES
91.67
FEMALES / 100 MALES
61.6
MEDIAN AGE
2.2
AVG FAMILY SIZE
2.2
AVG HOUSEHOLD SIZE
24
LABOR FORCE [ PEOPLE ]
36.4%
PERCENT IN LABOR FORCE
Cale Area Codes
Income in Cale
Income Overview in Cale
| Characteristic | Number | Measure |
| Per Capita Income | 69 | $35,732 |
| Median Family Income | 28 | $0 |
| Mean Family Income | 28 | $79,675 |
| Median Household Income | 32 | $38,750 |
| Mean Household Income | 32 | $72,991 |
| Income Deficit | 28 | $0 |
| Wage / Income Gap (%) | 69 | 0.00% |
| Wage / Income Gap ($) | 69 | 100.00¢ per $1 |
| Gini / Inequality Index | 69 | 0.48 |
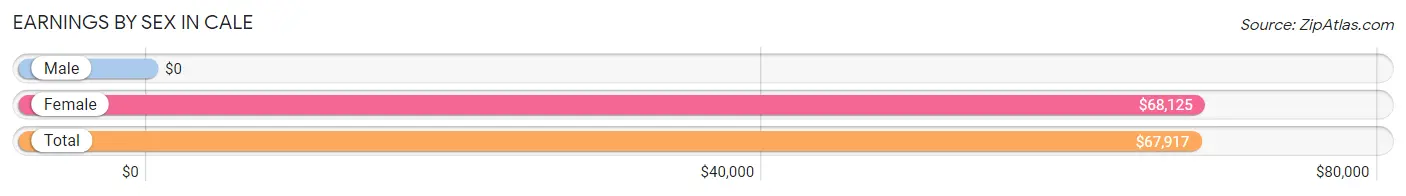
Earnings by Sex in Cale
| Sex | Number | Average Earnings |
| Male | 13 (54.2%) | $0 |
| Female | 11 (45.8%) | $68,125 |
| Total | 24 (100.0%) | $67,917 |
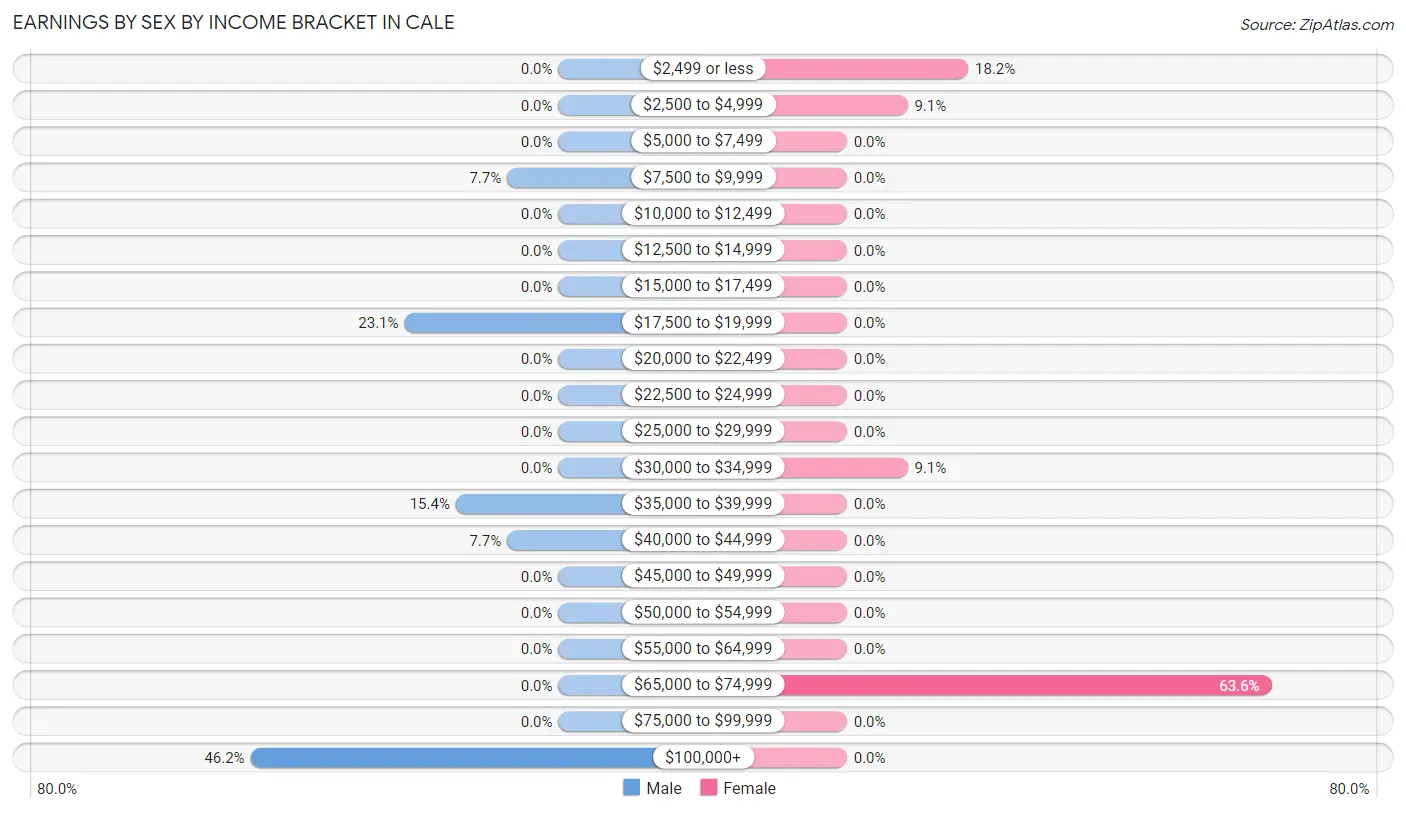
Earnings by Sex by Income Bracket in Cale
The most common earnings brackets in Cale are $100,000+ for men (6 | 46.2%) and $65,000 to $74,999 for women (7 | 63.6%).
| Income | Male | Female |
| $2,499 or less | 0 (0.0%) | 2 (18.2%) |
| $2,500 to $4,999 | 0 (0.0%) | 1 (9.1%) |
| $5,000 to $7,499 | 0 (0.0%) | 0 (0.0%) |
| $7,500 to $9,999 | 1 (7.7%) | 0 (0.0%) |
| $10,000 to $12,499 | 0 (0.0%) | 0 (0.0%) |
| $12,500 to $14,999 | 0 (0.0%) | 0 (0.0%) |
| $15,000 to $17,499 | 0 (0.0%) | 0 (0.0%) |
| $17,500 to $19,999 | 3 (23.1%) | 0 (0.0%) |
| $20,000 to $22,499 | 0 (0.0%) | 0 (0.0%) |
| $22,500 to $24,999 | 0 (0.0%) | 0 (0.0%) |
| $25,000 to $29,999 | 0 (0.0%) | 0 (0.0%) |
| $30,000 to $34,999 | 0 (0.0%) | 1 (9.1%) |
| $35,000 to $39,999 | 2 (15.4%) | 0 (0.0%) |
| $40,000 to $44,999 | 1 (7.7%) | 0 (0.0%) |
| $45,000 to $49,999 | 0 (0.0%) | 0 (0.0%) |
| $50,000 to $54,999 | 0 (0.0%) | 0 (0.0%) |
| $55,000 to $64,999 | 0 (0.0%) | 0 (0.0%) |
| $65,000 to $74,999 | 0 (0.0%) | 7 (63.6%) |
| $75,000 to $99,999 | 0 (0.0%) | 0 (0.0%) |
| $100,000+ | 6 (46.2%) | 0 (0.0%) |
| Total | 13 (100.0%) | 11 (100.0%) |
Earnings by Sex by Educational Attainment in Cale
| Educational Attainment | Male Income | Female Income |
| Less than High School | - | - |
| High School Diploma | - | - |
| College or Associate's Degree | - | - |
| Bachelor's Degree | - | - |
| Graduate Degree | - | - |
| Total | - | - |
Family Income in Cale
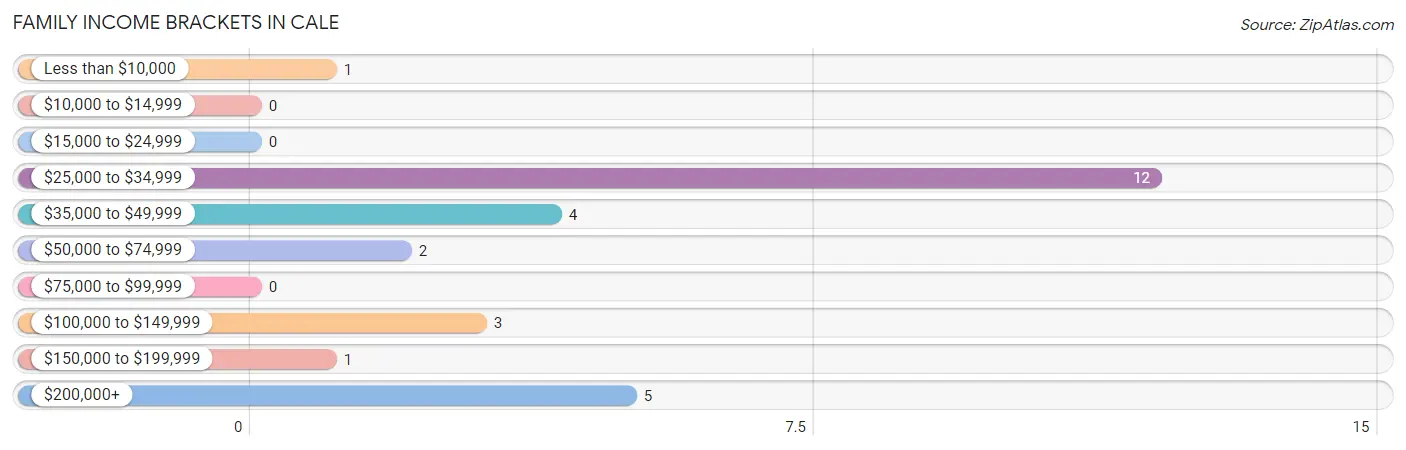
Family Income Brackets in Cale
According to the Cale family income data, there are 12 families falling into the $25,000 to $34,999 income range, which is the most common income bracket and makes up 42.9% of all families.
| Income Bracket | # Families | % Families |
| Less than $10,000 | 1 | 3.6% |
| $10,000 to $14,999 | 0 | 0.0% |
| $15,000 to $24,999 | 0 | 0.0% |
| $25,000 to $34,999 | 12 | 42.9% |
| $35,000 to $49,999 | 4 | 14.3% |
| $50,000 to $74,999 | 2 | 7.1% |
| $75,000 to $99,999 | 0 | 0.0% |
| $100,000 to $149,999 | 3 | 10.7% |
| $150,000 to $199,999 | 1 | 3.6% |
| $200,000+ | 5 | 17.9% |
Family Income by Famaliy Size in Cale
| Income Bracket | # Families | Median Income |
| 2-Person Families | 26 (92.9%) | $0 |
| 3-Person Families | 0 (0.0%) | $0 |
| 4-Person Families | 2 (7.1%) | $0 |
| 5-Person Families | 0 (0.0%) | $0 |
| 6-Person Families | 0 (0.0%) | $0 |
| 7+ Person Families | 0 (0.0%) | $0 |
| Total | 28 (100.0%) | $0 |
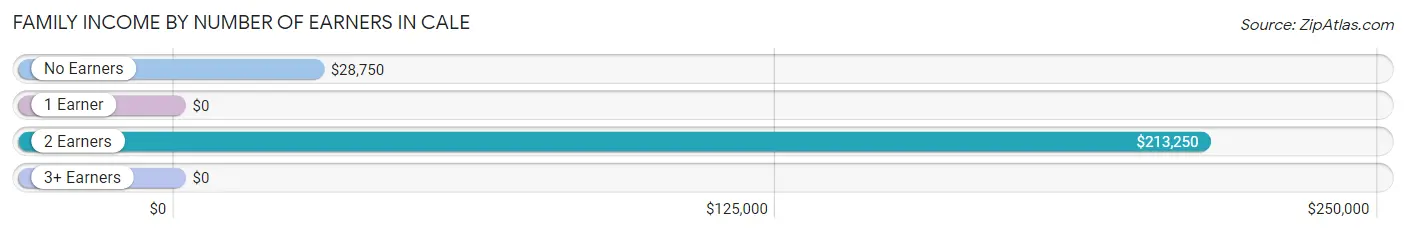
Family Income by Number of Earners in Cale
| Number of Earners | # Families | Median Income |
| No Earners | 20 (71.4%) | $28,750 |
| 1 Earner | 0 (0.0%) | $0 |
| 2 Earners | 7 (25.0%) | $213,250 |
| 3+ Earners | 1 (3.6%) | $0 |
| Total | 28 (100.0%) | $0 |
Household Income in Cale
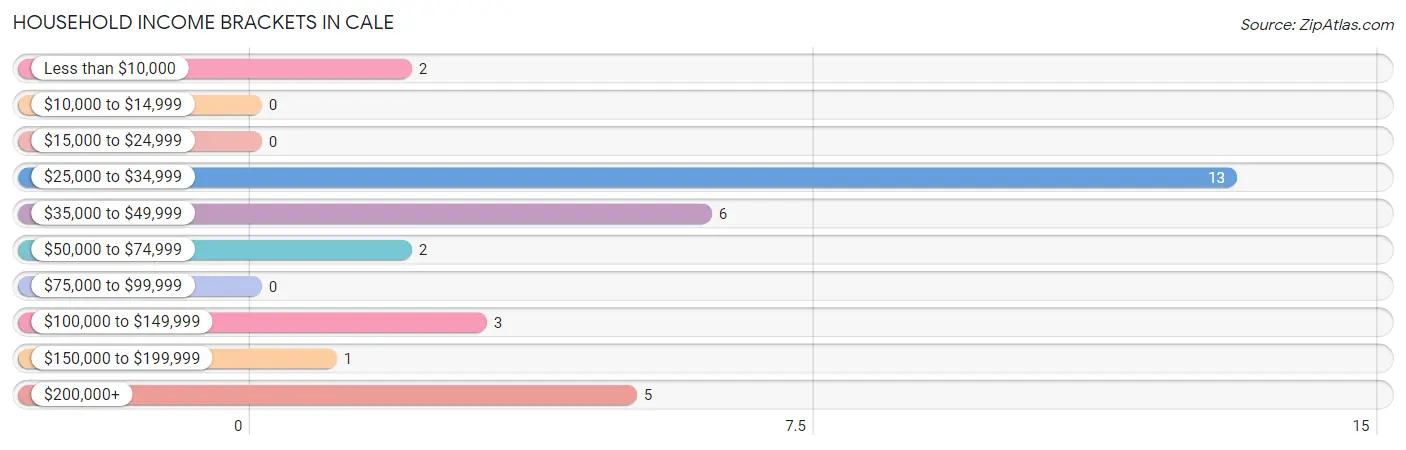
Household Income Brackets in Cale
With 13 households falling in the category, the $25,000 to $34,999 income range is the most frequent in Cale, accounting for 40.6% of all households.
| Income Bracket | # Households | % Households |
| Less than $10,000 | 2 | 6.3% |
| $10,000 to $14,999 | 0 | 0.0% |
| $15,000 to $24,999 | 0 | 0.0% |
| $25,000 to $34,999 | 13 | 40.6% |
| $35,000 to $49,999 | 6 | 18.8% |
| $50,000 to $74,999 | 2 | 6.3% |
| $75,000 to $99,999 | 0 | 0.0% |
| $100,000 to $149,999 | 3 | 9.4% |
| $150,000 to $199,999 | 1 | 3.1% |
| $200,000+ | 5 | 15.6% |
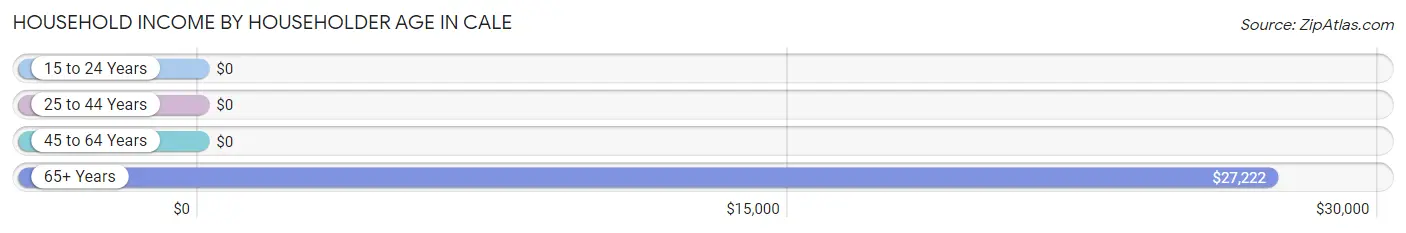
Household Income by Householder Age in Cale
The median household income in Cale is $38,750, with the highest median household income of $27,222 found in the 65+ years age bracket for the primary householder. A total of 18 households (56.2%) fall into this category.
| Income Bracket | # Households | Median Income |
| 15 to 24 Years | 0 (0.0%) | $0 |
| 25 to 44 Years | 7 (21.9%) | $0 |
| 45 to 64 Years | 7 (21.9%) | $0 |
| 65+ Years | 18 (56.2%) | $27,222 |
| Total | 32 (100.0%) | $38,750 |
Poverty in Cale
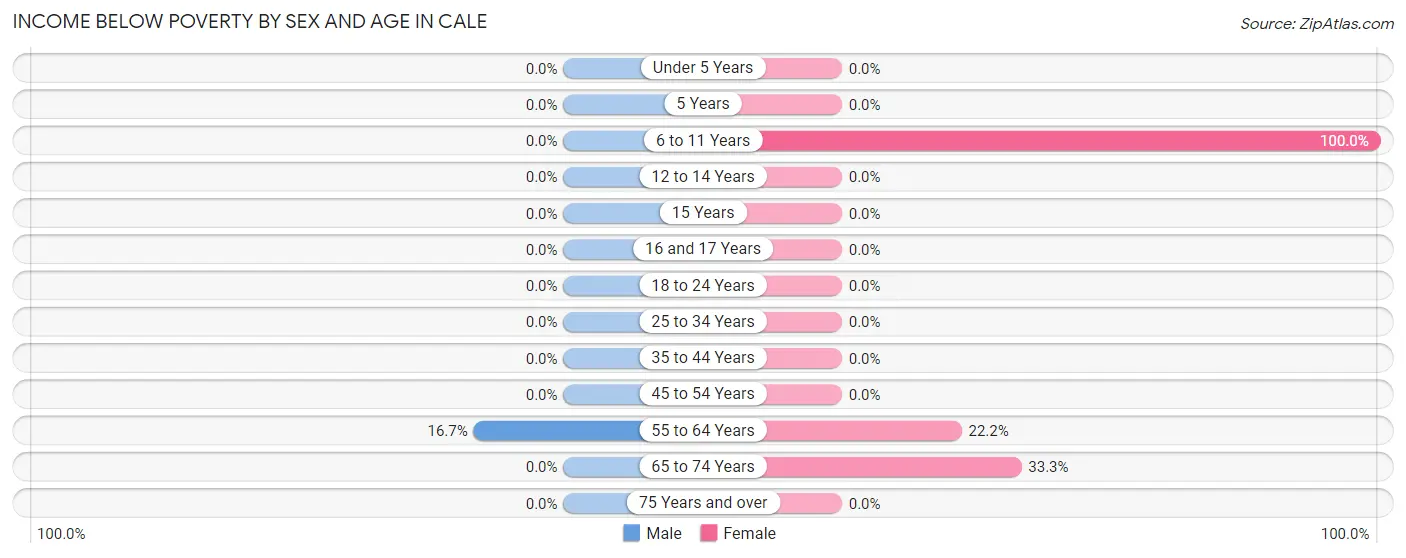
Income Below Poverty by Sex and Age in Cale
With 2.8% poverty level for males and 15.1% for females among the residents of Cale, 55 to 64 year old males and 6 to 11 year old females are the most vulnerable to poverty, with 1 males (16.7%) and 2 females (100.0%) in their respective age groups living below the poverty level.
| Age Bracket | Male | Female |
| Under 5 Years | 0 (0.0%) | 0 (0.0%) |
| 5 Years | 0 (0.0%) | 0 (0.0%) |
| 6 to 11 Years | 0 (0.0%) | 2 (100.0%) |
| 12 to 14 Years | 0 (0.0%) | 0 (0.0%) |
| 15 Years | 0 (0.0%) | 0 (0.0%) |
| 16 and 17 Years | 0 (0.0%) | 0 (0.0%) |
| 18 to 24 Years | 0 (0.0%) | 0 (0.0%) |
| 25 to 34 Years | 0 (0.0%) | 0 (0.0%) |
| 35 to 44 Years | 0 (0.0%) | 0 (0.0%) |
| 45 to 54 Years | 0 (0.0%) | 0 (0.0%) |
| 55 to 64 Years | 1 (16.7%) | 2 (22.2%) |
| 65 to 74 Years | 0 (0.0%) | 1 (33.3%) |
| 75 Years and over | 0 (0.0%) | 0 (0.0%) |
| Total | 1 (2.8%) | 5 (15.1%) |
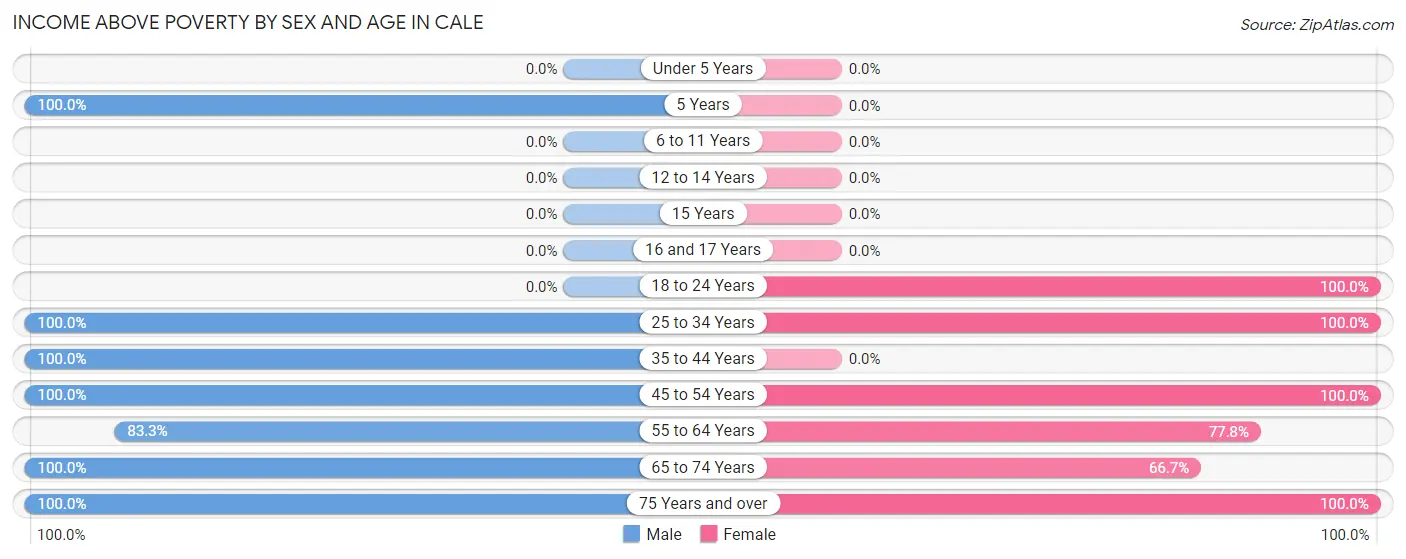
Income Above Poverty by Sex and Age in Cale
According to the poverty statistics in Cale, males aged 5 years and females aged 18 to 24 years are the age groups that are most secure financially, with 100.0% of males and 100.0% of females in these age groups living above the poverty line.
| Age Bracket | Male | Female |
| Under 5 Years | 0 (0.0%) | 0 (0.0%) |
| 5 Years | 1 (100.0%) | 0 (0.0%) |
| 6 to 11 Years | 0 (0.0%) | 0 (0.0%) |
| 12 to 14 Years | 0 (0.0%) | 0 (0.0%) |
| 15 Years | 0 (0.0%) | 0 (0.0%) |
| 16 and 17 Years | 0 (0.0%) | 0 (0.0%) |
| 18 to 24 Years | 0 (0.0%) | 2 (100.0%) |
| 25 to 34 Years | 7 (100.0%) | 3 (100.0%) |
| 35 to 44 Years | 5 (100.0%) | 0 (0.0%) |
| 45 to 54 Years | 1 (100.0%) | 6 (100.0%) |
| 55 to 64 Years | 5 (83.3%) | 7 (77.8%) |
| 65 to 74 Years | 2 (100.0%) | 2 (66.7%) |
| 75 Years and over | 14 (100.0%) | 8 (100.0%) |
| Total | 35 (97.2%) | 28 (84.9%) |
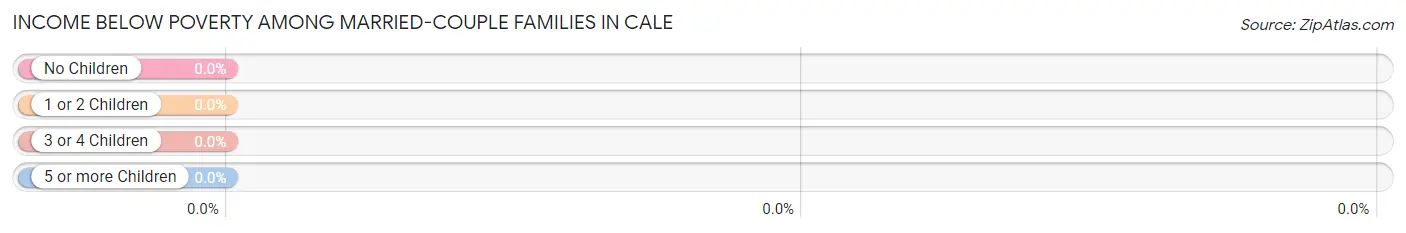
Income Below Poverty Among Married-Couple Families in Cale
| Children | Above Poverty | Below Poverty |
| No Children | 25 (100.0%) | 0 (0.0%) |
| 1 or 2 Children | 1 (100.0%) | 0 (0.0%) |
| 3 or 4 Children | 0 (0.0%) | 0 (0.0%) |
| 5 or more Children | 0 (0.0%) | 0 (0.0%) |
| Total | 26 (100.0%) | 0 (0.0%) |
Income Below Poverty Among Single-Parent Households in Cale
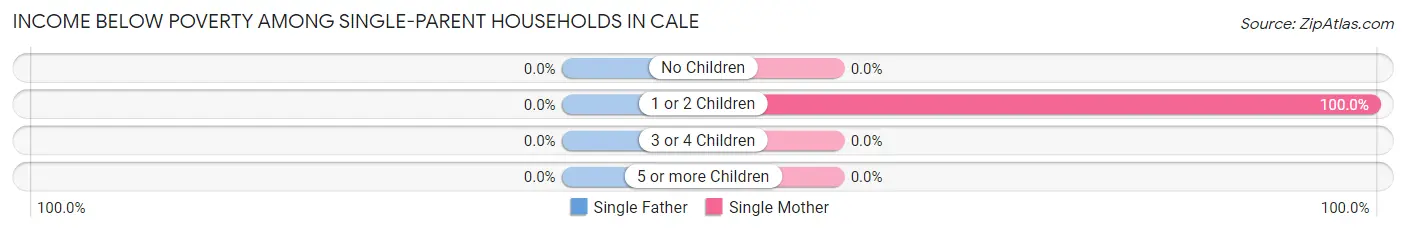
| Children | Single Father | Single Mother |
| No Children | 0 (0.0%) | 0 (0.0%) |
| 1 or 2 Children | 0 (0.0%) | 1 (100.0%) |
| 3 or 4 Children | 0 (0.0%) | 0 (0.0%) |
| 5 or more Children | 0 (0.0%) | 0 (0.0%) |
| Total | 0 (0.0%) | 1 (50.0%) |
Income Below Poverty Among Married-Couple vs Single-Parent Households in Cale
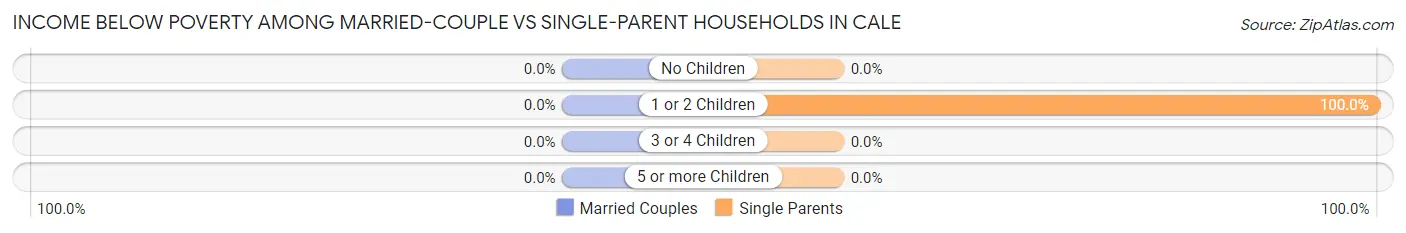
| Children | Married-Couple Families | Single-Parent Households |
| No Children | 0 (0.0%) | 0 (0.0%) |
| 1 or 2 Children | 0 (0.0%) | 1 (100.0%) |
| 3 or 4 Children | 0 (0.0%) | 0 (0.0%) |
| 5 or more Children | 0 (0.0%) | 0 (0.0%) |
| Total | 0 (0.0%) | 1 (50.0%) |
Race in Cale
The most populous races in Cale are , and White / Caucasian (69 | 100.0%).
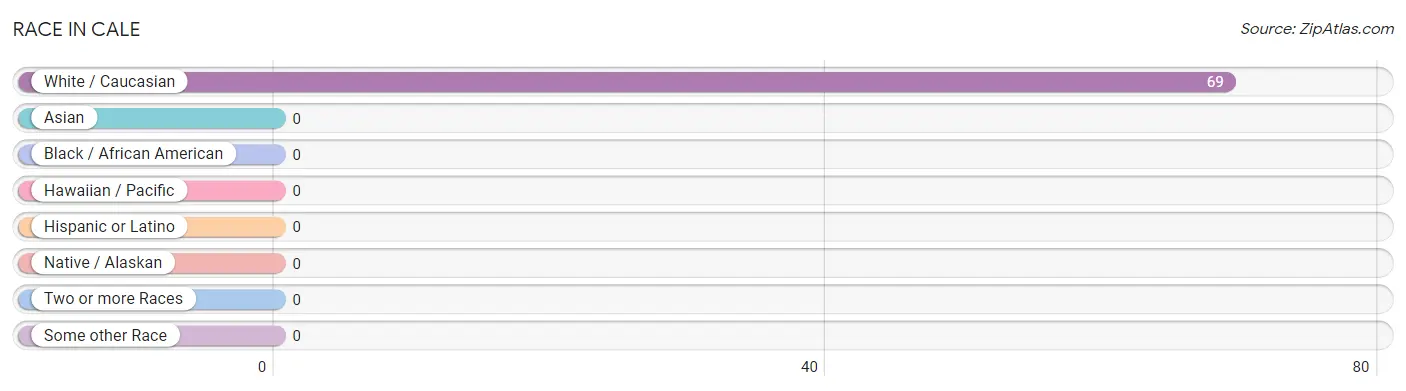
| Race | # Population | % Population |
| Asian | 0 | 0.0% |
| Black / African American | 0 | 0.0% |
| Hawaiian / Pacific | 0 | 0.0% |
| Hispanic or Latino | 0 | 0.0% |
| Native / Alaskan | 0 | 0.0% |
| White / Caucasian | 69 | 100.0% |
| Two or more Races | 0 | 0.0% |
| Some other Race | 0 | 0.0% |
| Total | 69 | 100.0% |
Ancestry in Cale
The most populous ancestries reported in Cale are American (7 | 10.1%), English (4 | 5.8%), Irish (3 | 4.3%), Italian (3 | 4.3%), and Danish (2 | 2.9%), together accounting for 27.5% of all Cale residents.
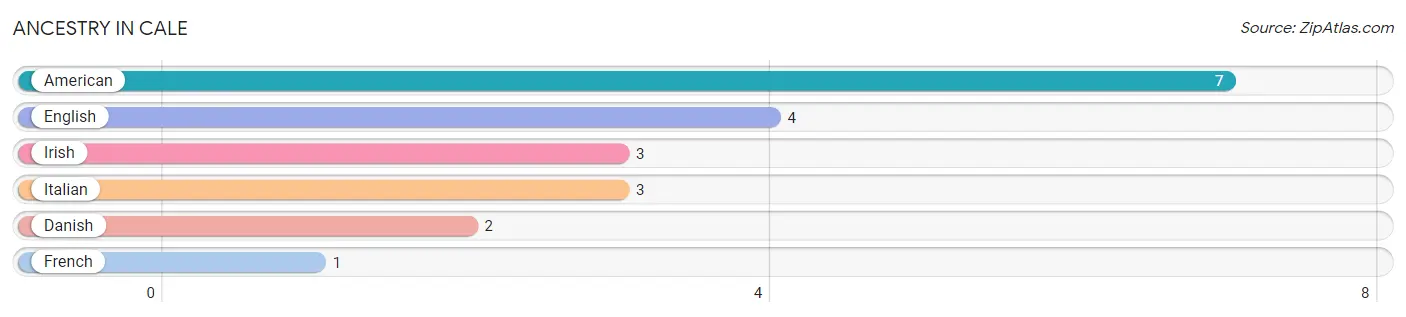
| Ancestry | # Population | % Population |
| American | 7 | 10.1% |
| Danish | 2 | 2.9% |
| English | 4 | 5.8% |
| French | 1 | 1.5% |
| Irish | 3 | 4.3% |
| Italian | 3 | 4.3% | View All 6 Rows |
Immigrants in Cale

| Immigration Origin | # Population | % Population | View All 0 Rows |
Sex and Age in Cale
Sex and Age in Cale
The most populous age groups in Cale are 85 Years and over (9 | 25.0%) for men and 60 to 64 Years (7 | 21.2%) for women.
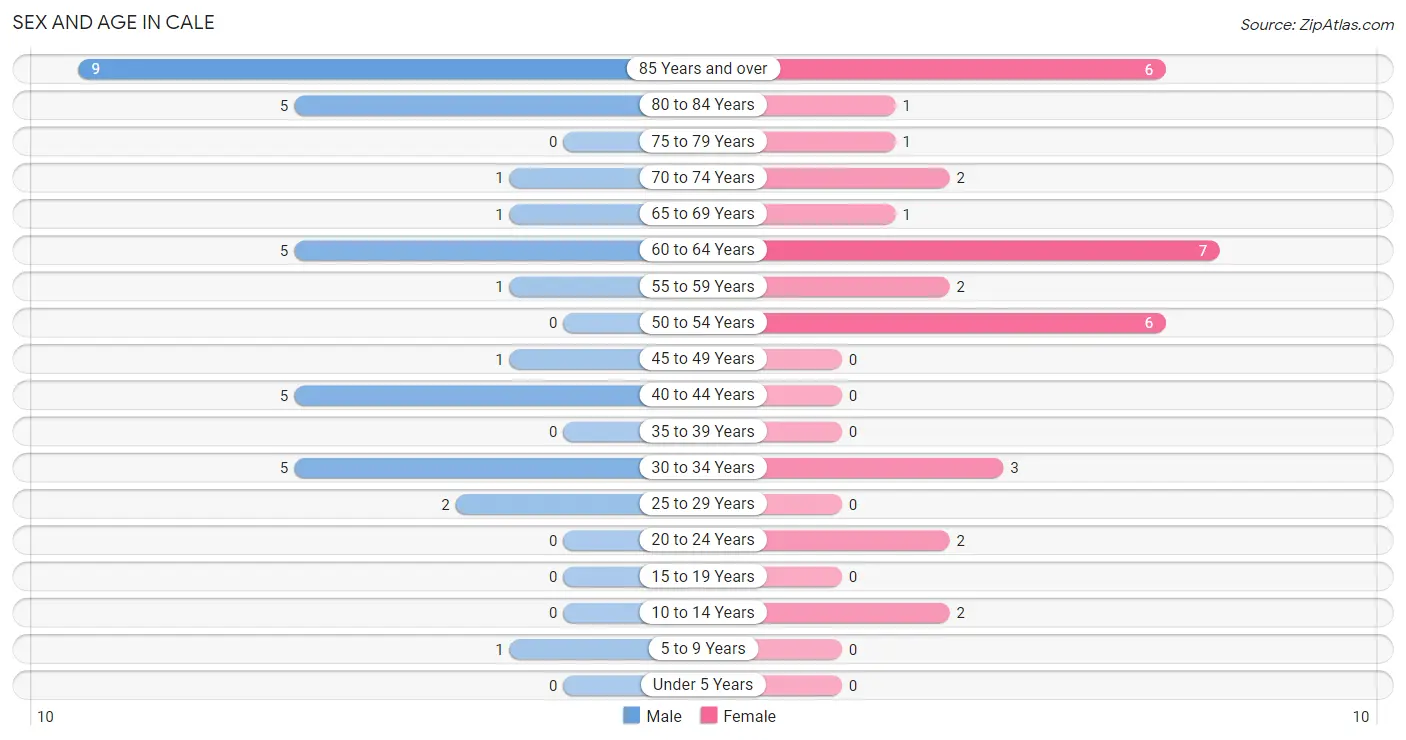
| Age Bracket | Male | Female |
| Under 5 Years | 0 (0.0%) | 0 (0.0%) |
| 5 to 9 Years | 1 (2.8%) | 0 (0.0%) |
| 10 to 14 Years | 0 (0.0%) | 2 (6.1%) |
| 15 to 19 Years | 0 (0.0%) | 0 (0.0%) |
| 20 to 24 Years | 0 (0.0%) | 2 (6.1%) |
| 25 to 29 Years | 2 (5.6%) | 0 (0.0%) |
| 30 to 34 Years | 5 (13.9%) | 3 (9.1%) |
| 35 to 39 Years | 0 (0.0%) | 0 (0.0%) |
| 40 to 44 Years | 5 (13.9%) | 0 (0.0%) |
| 45 to 49 Years | 1 (2.8%) | 0 (0.0%) |
| 50 to 54 Years | 0 (0.0%) | 6 (18.2%) |
| 55 to 59 Years | 1 (2.8%) | 2 (6.1%) |
| 60 to 64 Years | 5 (13.9%) | 7 (21.2%) |
| 65 to 69 Years | 1 (2.8%) | 1 (3.0%) |
| 70 to 74 Years | 1 (2.8%) | 2 (6.1%) |
| 75 to 79 Years | 0 (0.0%) | 1 (3.0%) |
| 80 to 84 Years | 5 (13.9%) | 1 (3.0%) |
| 85 Years and over | 9 (25.0%) | 6 (18.2%) |
| Total | 36 (100.0%) | 33 (100.0%) |
Families and Households in Cale
Median Family Size in Cale
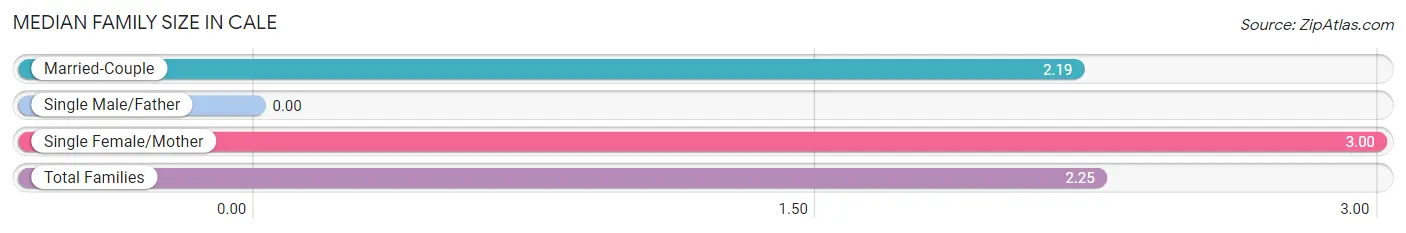
| Family Type | # Families | Family Size |
| Married-Couple | 26 (92.9%) | 2.19 |
| Single Male/Father | 0 (0.0%) | - |
| Single Female/Mother | 2 (7.1%) | 3.00 |
| Total Families | 28 (100.0%) | 2.25 |
Median Household Size in Cale
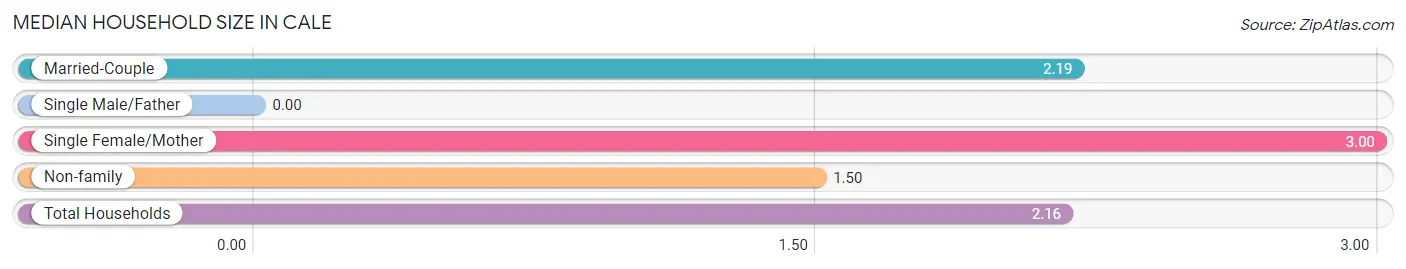
| Household Type | # Households | Household Size |
| Married-Couple | 26 (81.2%) | 2.19 |
| Single Male/Father | 0 (0.0%) | - |
| Single Female/Mother | 2 (6.2%) | 3.00 |
| Non-family | 4 (12.5%) | 1.50 |
| Total Households | 32 (100.0%) | 2.16 |
Household Size by Marriage Status in Cale
Out of a total of 32 households in Cale, 28 (87.5%) are family households, while 4 (12.5%) are nonfamily households. The most numerous type of family households are 2-person households, comprising 26, and the most common type of nonfamily households are 1-person households, comprising 3.
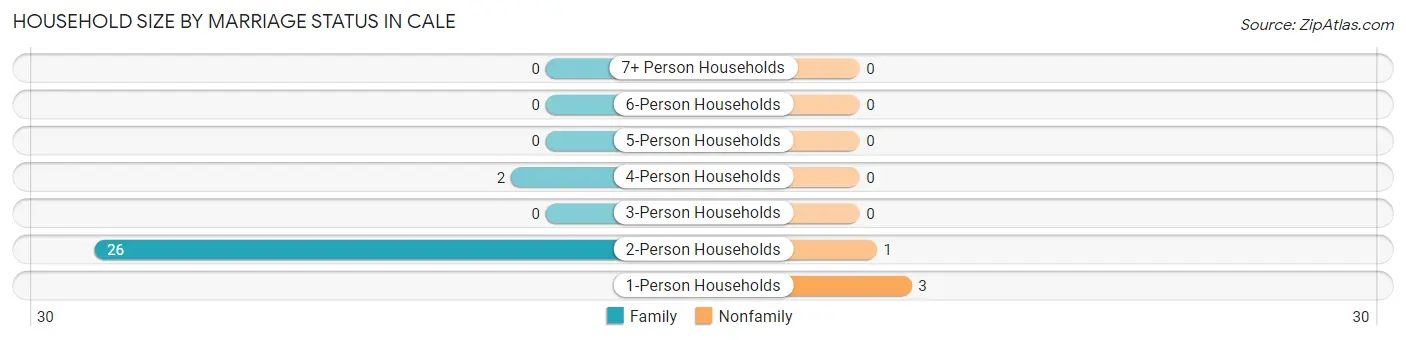
| Household Size | Family Households | Nonfamily Households |
| 1-Person Households | - | 3 (9.4%) |
| 2-Person Households | 26 (81.2%) | 1 (3.1%) |
| 3-Person Households | 0 (0.0%) | 0 (0.0%) |
| 4-Person Households | 2 (6.2%) | 0 (0.0%) |
| 5-Person Households | 0 (0.0%) | 0 (0.0%) |
| 6-Person Households | 0 (0.0%) | 0 (0.0%) |
| 7+ Person Households | 0 (0.0%) | 0 (0.0%) |
| Total | 28 (87.5%) | 4 (12.5%) |
Female Fertility in Cale
Fertility by Age in Cale
| Age Bracket | Women with Births | Births / 1,000 Women |
| 15 to 19 years | 0 (0.0%) | 0.0 |
| 20 to 34 years | 0 (0.0%) | 0.0 |
| 35 to 50 years | 0 (0.0%) | 0.0 |
| Total | 0 (0.0%) | 0.0 |
Fertility by Age by Marriage Status in Cale
| Age Bracket | Married | Unmarried |
| 15 to 19 years | 0 (0.0%) | 0 (0.0%) |
| 20 to 34 years | 0 (0.0%) | 0 (0.0%) |
| 35 to 50 years | 0 (0.0%) | 0 (0.0%) |
| Total | 0 (0.0%) | 0 (0.0%) |
Fertility by Education in Cale
| Educational Attainment | Women with Births | Births / 1,000 Women |
| Less than High School | 0 (0.0%) | 0.0 |
| High School Diploma | 0 (0.0%) | 0.0 |
| College or Associate's Degree | 0 (0.0%) | 0.0 |
| Bachelor's Degree | 0 (0.0%) | 0.0 |
| Graduate Degree | 0 (0.0%) | 0.0 |
| Total | 0 (0.0%) | 0.0 |
Fertility by Education by Marriage Status in Cale
| Educational Attainment | Married | Unmarried |
| Less than High School | 0 (0.0%) | 0 (0.0%) |
| High School Diploma | 0 (0.0%) | 0 (0.0%) |
| College or Associate's Degree | 0 (0.0%) | 0 (0.0%) |
| Bachelor's Degree | 0 (0.0%) | 0 (0.0%) |
| Graduate Degree | 0 (0.0%) | 0 (0.0%) |
| Total | 0 (0.0%) | 0 (0.0%) |
Employment Characteristics in Cale
Employment by Class of Employer in Cale
Among the 23 employed individuals in Cale, private company employees (21 | 91.3%), self-employed (not incorporated) (1 | 4.3%), and not-for-profit organizations (1 | 4.3%) make up the most common classes of employment.
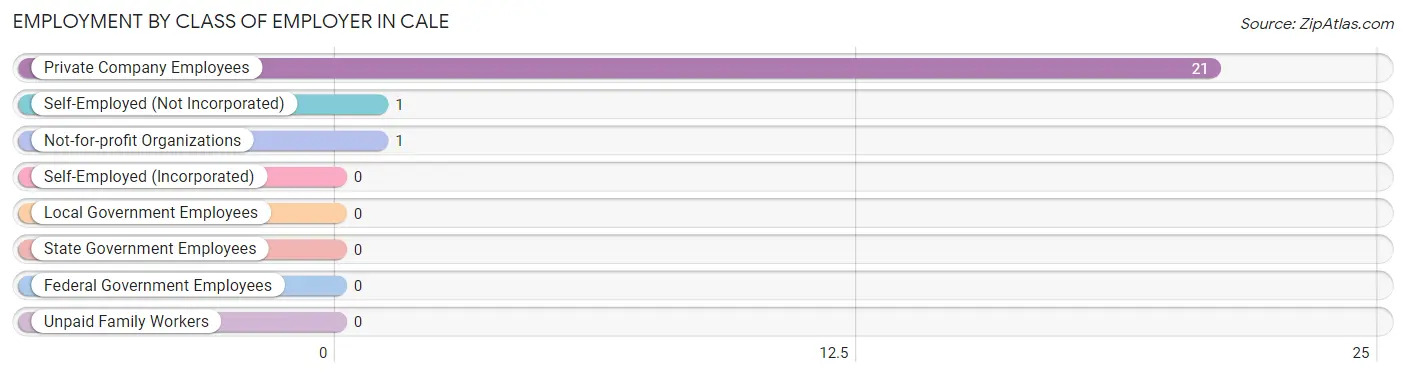
| Employer Class | # Employees | % Employees |
| Private Company Employees | 21 | 91.3% |
| Self-Employed (Incorporated) | 0 | 0.0% |
| Self-Employed (Not Incorporated) | 1 | 4.3% |
| Not-for-profit Organizations | 1 | 4.3% |
| Local Government Employees | 0 | 0.0% |
| State Government Employees | 0 | 0.0% |
| Federal Government Employees | 0 | 0.0% |
| Unpaid Family Workers | 0 | 0.0% |
| Total | 23 | 100.0% |
Employment Status by Age in Cale
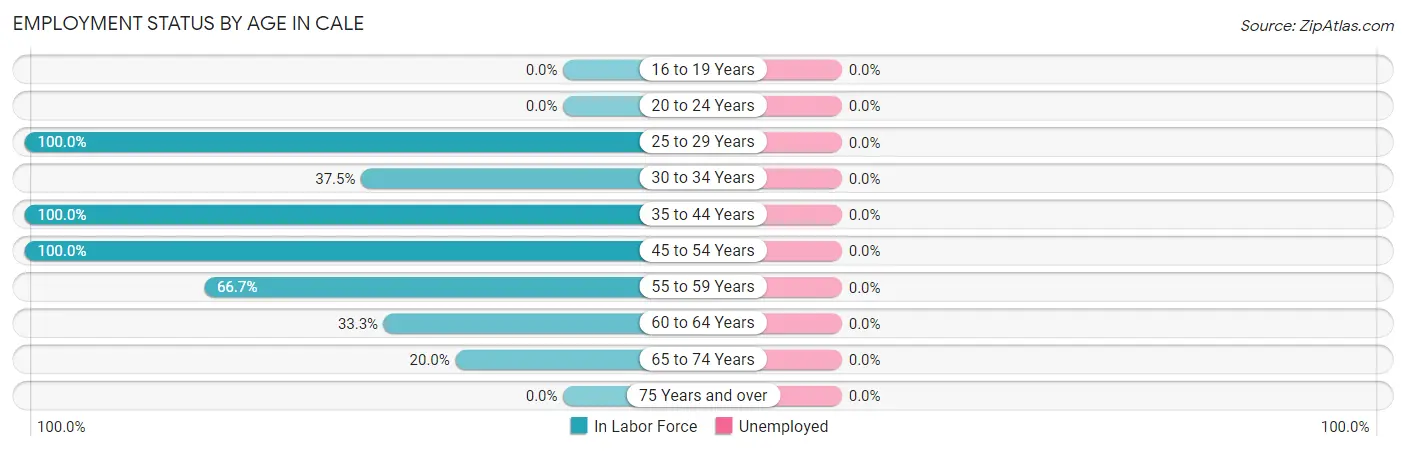
| Age Bracket | In Labor Force | Unemployed |
| 16 to 19 Years | 0 (0.0%) | 0 (0.0%) |
| 20 to 24 Years | 0 (0.0%) | 0 (0.0%) |
| 25 to 29 Years | 2 (100.0%) | 0 (0.0%) |
| 30 to 34 Years | 3 (37.5%) | 0 (0.0%) |
| 35 to 44 Years | 5 (100.0%) | 0 (0.0%) |
| 45 to 54 Years | 7 (100.0%) | 0 (0.0%) |
| 55 to 59 Years | 2 (66.7%) | 0 (0.0%) |
| 60 to 64 Years | 4 (33.3%) | 0 (0.0%) |
| 65 to 74 Years | 1 (20.0%) | 0 (0.0%) |
| 75 Years and over | 0 (0.0%) | 0 (0.0%) |
| Total | 24 (36.4%) | 0 (0.0%) |
Employment Status by Educational Attainment in Cale
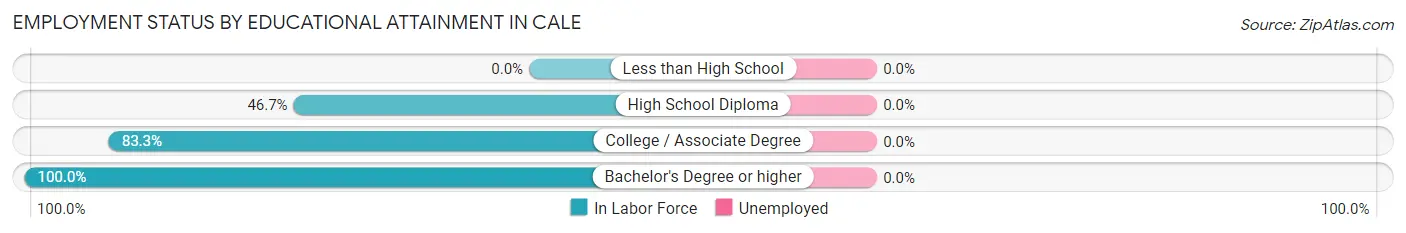
| Educational Attainment | In Labor Force | Unemployed |
| Less than High School | 0 (0.0%) | 0 (0.0%) |
| High School Diploma | 7 (46.7%) | 0 (0.0%) |
| College / Associate Degree | 15 (83.3%) | 0 (0.0%) |
| Bachelor's Degree or higher | 1 (100.0%) | 0 (0.0%) |
| Total | 23 (62.2%) | 0 (0.0%) |
Employment Occupations by Sex in Cale
Management, Business, Science and Arts Occupations
The most common Management, Business, Science and Arts occupations in Cale are Business & Financial (3 | 12.5%), Community & Social Service (2 | 8.3%), Management (1 | 4.2%), Education, Arts & Media (1 | 4.2%), and Education Instruction & Library (1 | 4.2%).
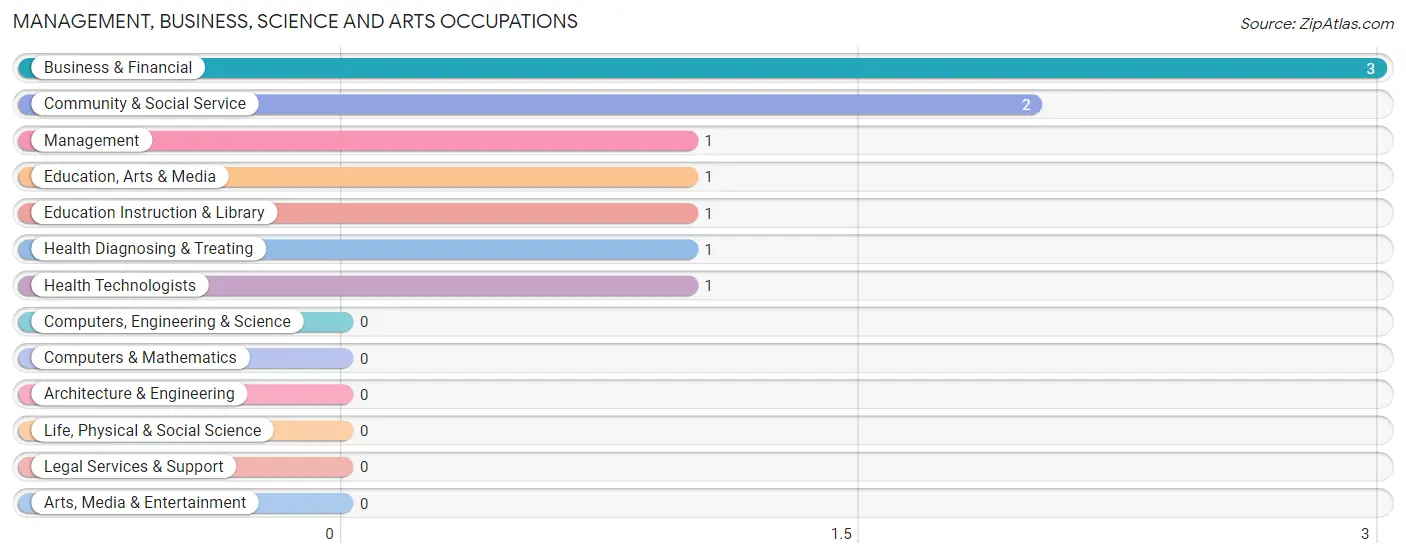
Management, Business, Science and Arts Occupations by Sex
Within the Management, Business, Science and Arts occupations in Cale, the most male-oriented occupations are Management (100.0%), and Business & Financial (100.0%), while the most female-oriented occupations are Community & Social Service (100.0%), Education, Arts & Media (100.0%), and Education Instruction & Library (100.0%).
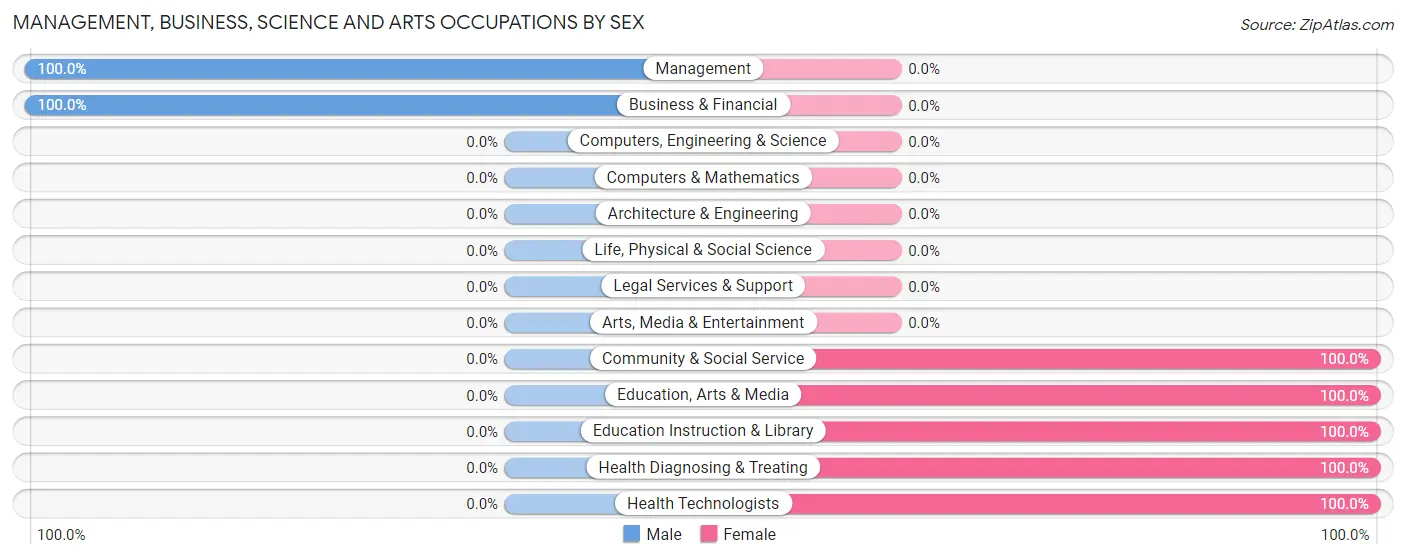
| Occupation | Male | Female |
| Management | 1 (100.0%) | 0 (0.0%) |
| Business & Financial | 3 (100.0%) | 0 (0.0%) |
| Computers, Engineering & Science | 0 (0.0%) | 0 (0.0%) |
| Computers & Mathematics | 0 (0.0%) | 0 (0.0%) |
| Architecture & Engineering | 0 (0.0%) | 0 (0.0%) |
| Life, Physical & Social Science | 0 (0.0%) | 0 (0.0%) |
| Community & Social Service | 0 (0.0%) | 2 (100.0%) |
| Education, Arts & Media | 0 (0.0%) | 1 (100.0%) |
| Legal Services & Support | 0 (0.0%) | 0 (0.0%) |
| Education Instruction & Library | 0 (0.0%) | 1 (100.0%) |
| Arts, Media & Entertainment | 0 (0.0%) | 0 (0.0%) |
| Health Diagnosing & Treating | 0 (0.0%) | 1 (100.0%) |
| Health Technologists | 0 (0.0%) | 1 (100.0%) |
| Total (Category) | 4 (57.1%) | 3 (42.9%) |
| Total (Overall) | 13 (54.2%) | 11 (45.8%) |
Services Occupations
Services Occupations by Sex
| Occupation | Male | Female |
| Healthcare Support | 0 (0.0%) | 0 (0.0%) |
| Security & Protection | 0 (0.0%) | 0 (0.0%) |
| Firefighting & Prevention | 0 (0.0%) | 0 (0.0%) |
| Law Enforcement | 0 (0.0%) | 0 (0.0%) |
| Food Preparation & Serving | 0 (0.0%) | 0 (0.0%) |
| Cleaning & Maintenance | 0 (0.0%) | 0 (0.0%) |
| Personal Care & Service | 0 (0.0%) | 0 (0.0%) |
| Total (Category) | 0 (0.0%) | 0 (0.0%) |
| Total (Overall) | 13 (54.2%) | 11 (45.8%) |
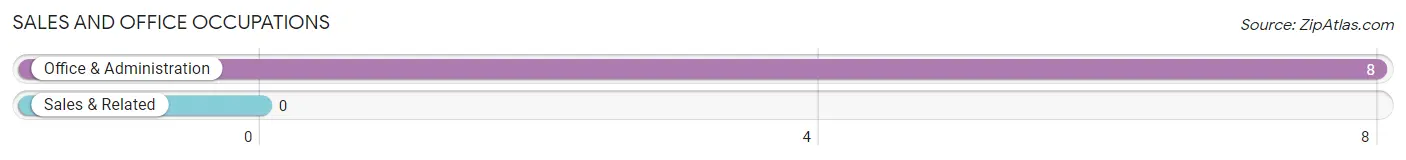
Sales and Office Occupations
The most common Sales and Office occupations in Cale are , and Office & Administration (8 | 33.3%).
Sales and Office Occupations by Sex
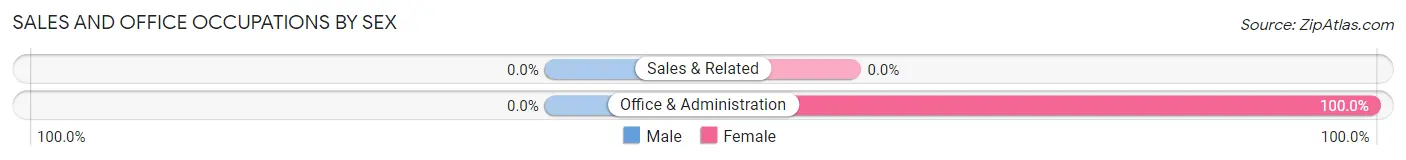
| Occupation | Male | Female |
| Sales & Related | 0 (0.0%) | 0 (0.0%) |
| Office & Administration | 0 (0.0%) | 8 (100.0%) |
| Total (Category) | 0 (0.0%) | 8 (100.0%) |
| Total (Overall) | 13 (54.2%) | 11 (45.8%) |
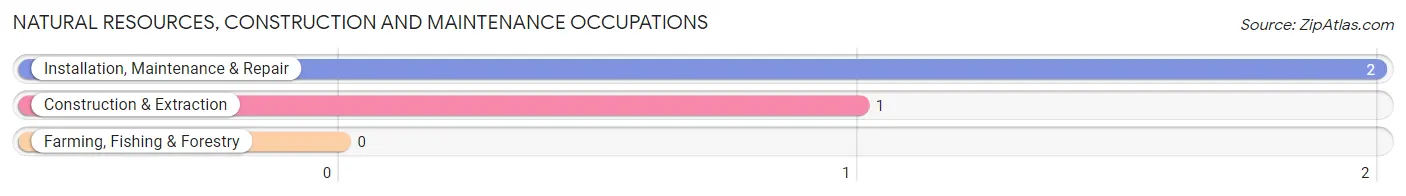
Natural Resources, Construction and Maintenance Occupations
The most common Natural Resources, Construction and Maintenance occupations in Cale are Installation, Maintenance & Repair (2 | 8.3%), and Construction & Extraction (1 | 4.2%).
Natural Resources, Construction and Maintenance Occupations by Sex
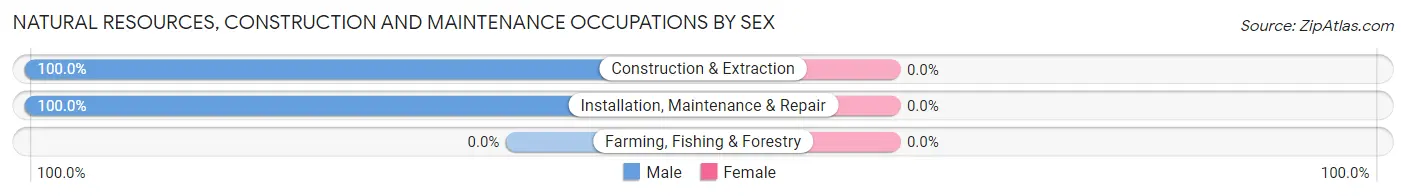
| Occupation | Male | Female |
| Farming, Fishing & Forestry | 0 (0.0%) | 0 (0.0%) |
| Construction & Extraction | 1 (100.0%) | 0 (0.0%) |
| Installation, Maintenance & Repair | 2 (100.0%) | 0 (0.0%) |
| Total (Category) | 3 (100.0%) | 0 (0.0%) |
| Total (Overall) | 13 (54.2%) | 11 (45.8%) |
Production, Transportation and Moving Occupations
The most common Production, Transportation and Moving occupations in Cale are Production (5 | 20.8%), and Transportation (1 | 4.2%).
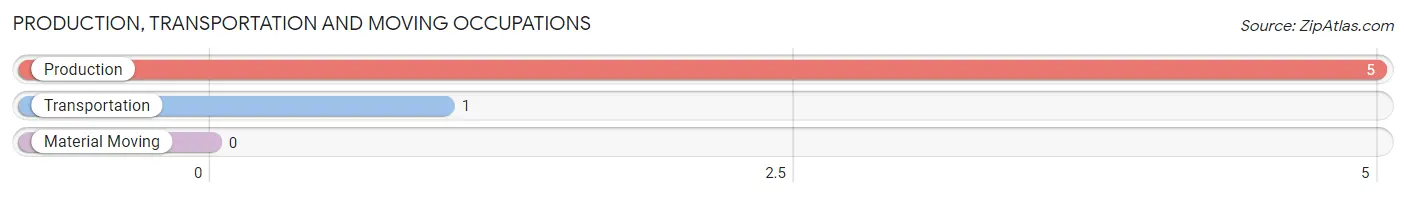
Production, Transportation and Moving Occupations by Sex
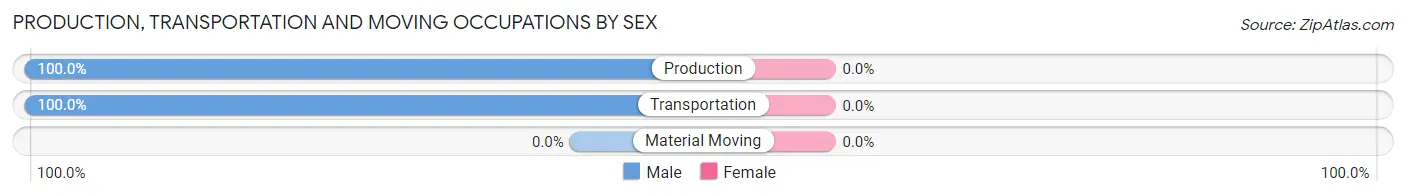
| Occupation | Male | Female |
| Production | 5 (100.0%) | 0 (0.0%) |
| Transportation | 1 (100.0%) | 0 (0.0%) |
| Material Moving | 0 (0.0%) | 0 (0.0%) |
| Total (Category) | 6 (100.0%) | 0 (0.0%) |
| Total (Overall) | 13 (54.2%) | 11 (45.8%) |
Employment Industries by Sex in Cale
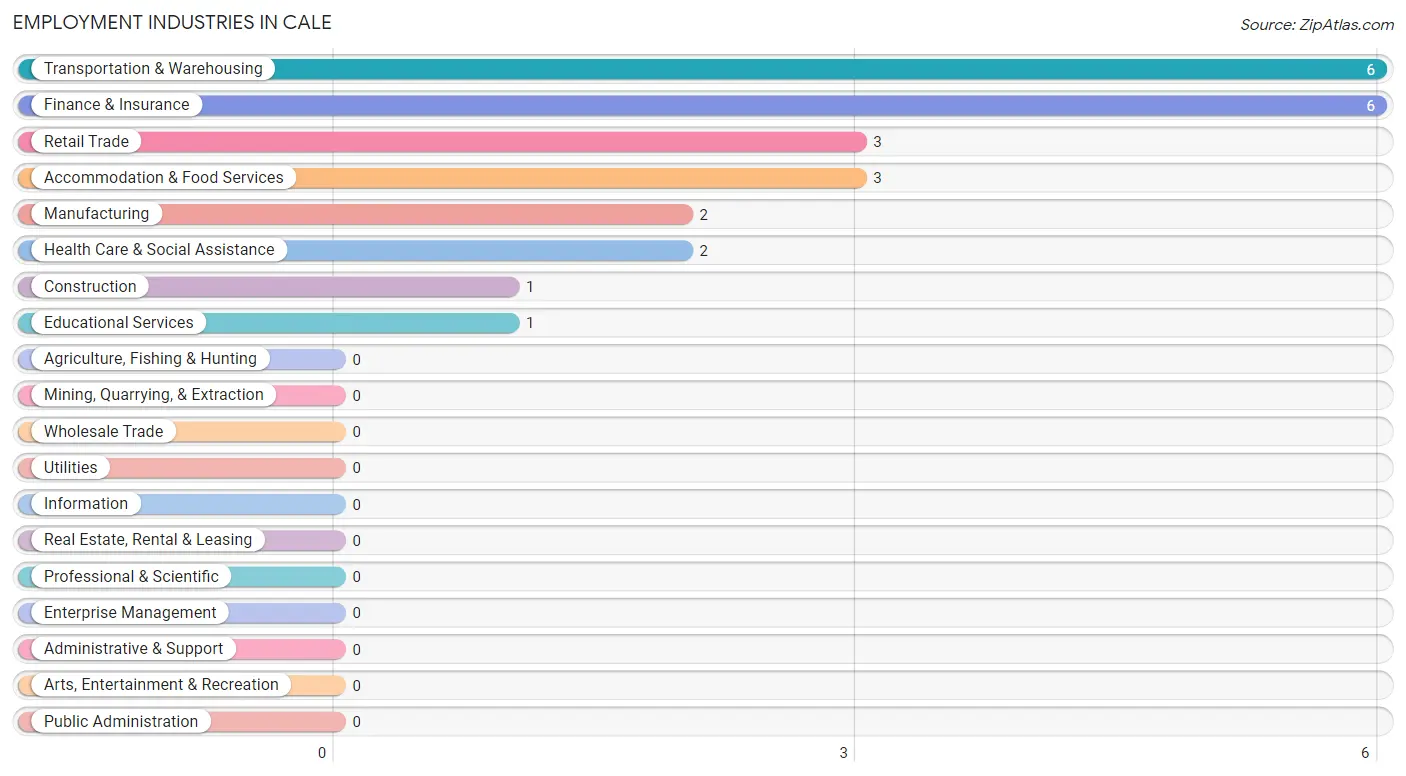
Employment Industries in Cale
The major employment industries in Cale include Transportation & Warehousing (6 | 25.0%), Finance & Insurance (6 | 25.0%), Retail Trade (3 | 12.5%), Accommodation & Food Services (3 | 12.5%), and Manufacturing (2 | 8.3%).
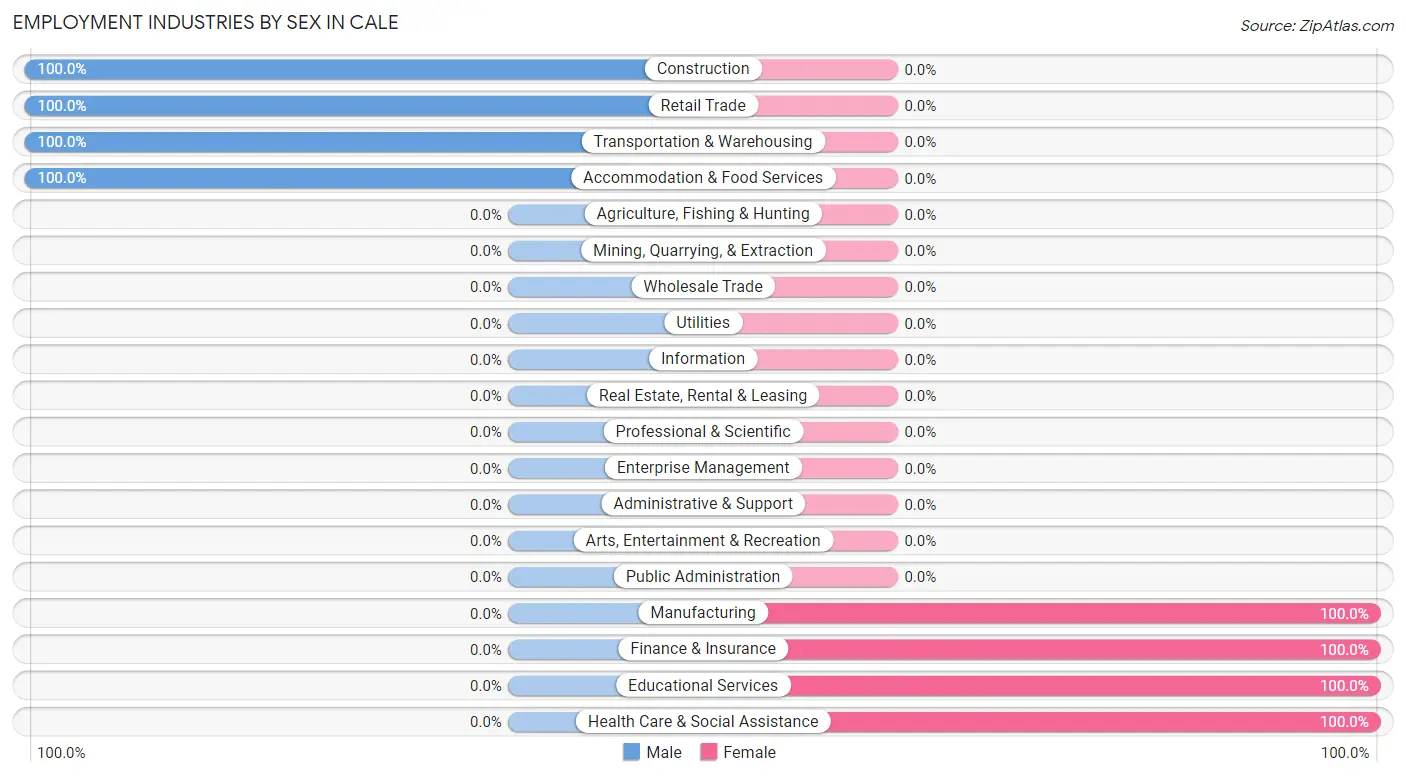
Employment Industries by Sex in Cale
The Cale industries that see more men than women are Construction (100.0%), Retail Trade (100.0%), and Transportation & Warehousing (100.0%), whereas the industries that tend to have a higher number of women are Manufacturing (100.0%), Finance & Insurance (100.0%), and Educational Services (100.0%).
| Industry | Male | Female |
| Agriculture, Fishing & Hunting | 0 (0.0%) | 0 (0.0%) |
| Mining, Quarrying, & Extraction | 0 (0.0%) | 0 (0.0%) |
| Construction | 1 (100.0%) | 0 (0.0%) |
| Manufacturing | 0 (0.0%) | 2 (100.0%) |
| Wholesale Trade | 0 (0.0%) | 0 (0.0%) |
| Retail Trade | 3 (100.0%) | 0 (0.0%) |
| Transportation & Warehousing | 6 (100.0%) | 0 (0.0%) |
| Utilities | 0 (0.0%) | 0 (0.0%) |
| Information | 0 (0.0%) | 0 (0.0%) |
| Finance & Insurance | 0 (0.0%) | 6 (100.0%) |
| Real Estate, Rental & Leasing | 0 (0.0%) | 0 (0.0%) |
| Professional & Scientific | 0 (0.0%) | 0 (0.0%) |
| Enterprise Management | 0 (0.0%) | 0 (0.0%) |
| Administrative & Support | 0 (0.0%) | 0 (0.0%) |
| Educational Services | 0 (0.0%) | 1 (100.0%) |
| Health Care & Social Assistance | 0 (0.0%) | 2 (100.0%) |
| Arts, Entertainment & Recreation | 0 (0.0%) | 0 (0.0%) |
| Accommodation & Food Services | 3 (100.0%) | 0 (0.0%) |
| Public Administration | 0 (0.0%) | 0 (0.0%) |
| Total | 13 (54.2%) | 11 (45.8%) |
Education in Cale
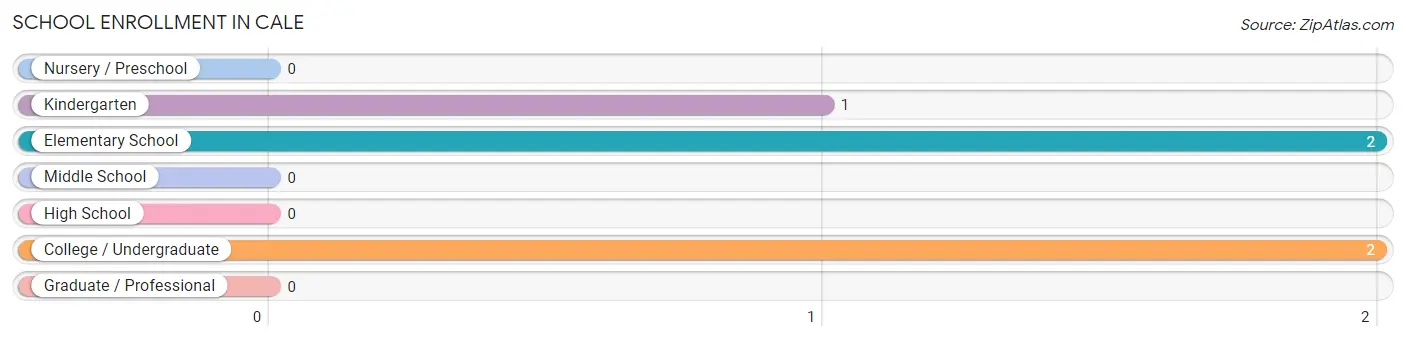
School Enrollment in Cale
The most common levels of schooling among the 5 students in Cale are elementary school (2 | 40.0%), college / undergraduate (2 | 40.0%), and kindergarten (1 | 20.0%).
| School Level | # Students | % Students |
| Nursery / Preschool | 0 | 0.0% |
| Kindergarten | 1 | 20.0% |
| Elementary School | 2 | 40.0% |
| Middle School | 0 | 0.0% |
| High School | 0 | 0.0% |
| College / Undergraduate | 2 | 40.0% |
| Graduate / Professional | 0 | 0.0% |
| Total | 5 | 100.0% |
School Enrollment by Age by Funding Source in Cale
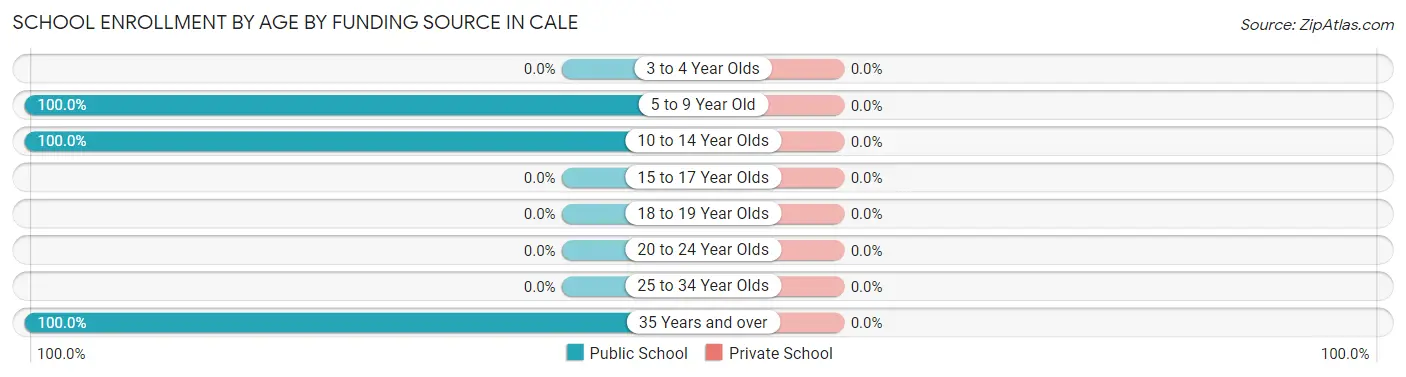
| Age Bracket | Public School | Private School |
| 3 to 4 Year Olds | 0 (0.0%) | 0 (0.0%) |
| 5 to 9 Year Old | 1 (100.0%) | 0 (0.0%) |
| 10 to 14 Year Olds | 2 (100.0%) | 0 (0.0%) |
| 15 to 17 Year Olds | 0 (0.0%) | 0 (0.0%) |
| 18 to 19 Year Olds | 0 (0.0%) | 0 (0.0%) |
| 20 to 24 Year Olds | 0 (0.0%) | 0 (0.0%) |
| 25 to 34 Year Olds | 0 (0.0%) | 0 (0.0%) |
| 35 Years and over | 2 (100.0%) | 0 (0.0%) |
| Total | 5 (100.0%) | 0 (0.0%) |
Educational Attainment by Field of Study in Cale
Education (3 | 75.0%), and science & technology (1 | 25.0%) are the most common fields of study among 4 individuals in Cale who have obtained a bachelor's degree or higher.
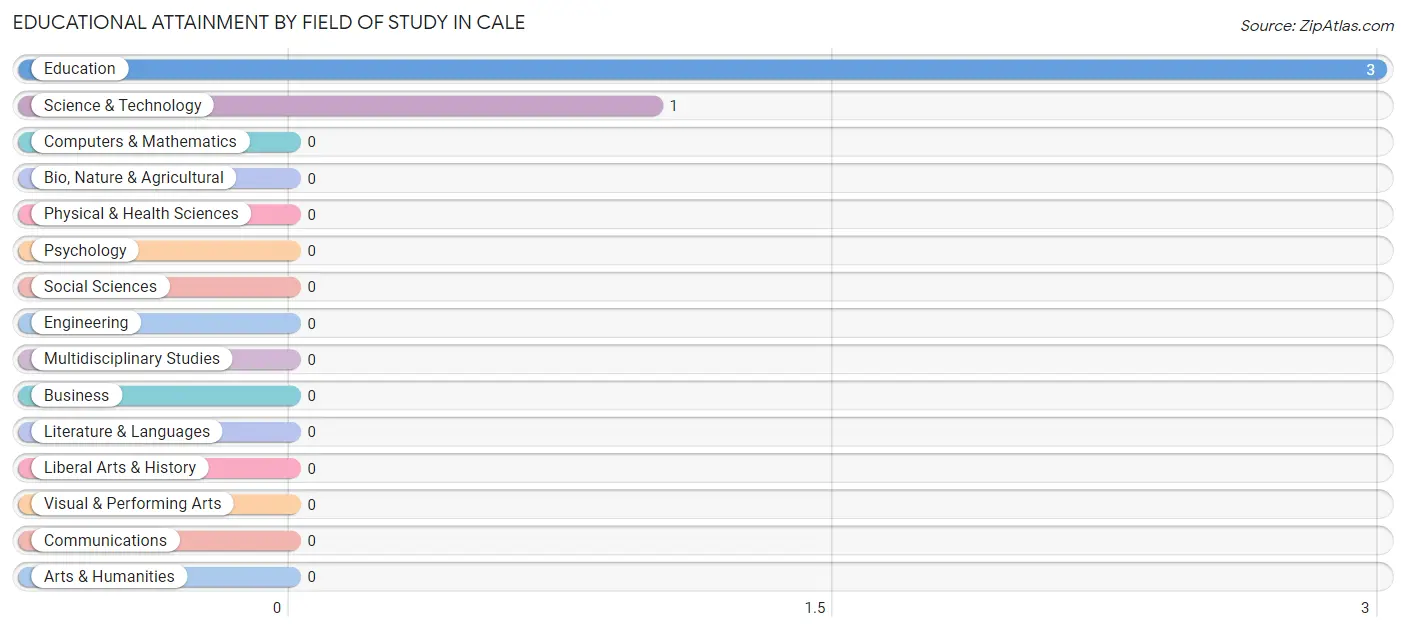
| Field of Study | # Graduates | % Graduates |
| Computers & Mathematics | 0 | 0.0% |
| Bio, Nature & Agricultural | 0 | 0.0% |
| Physical & Health Sciences | 0 | 0.0% |
| Psychology | 0 | 0.0% |
| Social Sciences | 0 | 0.0% |
| Engineering | 0 | 0.0% |
| Multidisciplinary Studies | 0 | 0.0% |
| Science & Technology | 1 | 25.0% |
| Business | 0 | 0.0% |
| Education | 3 | 75.0% |
| Literature & Languages | 0 | 0.0% |
| Liberal Arts & History | 0 | 0.0% |
| Visual & Performing Arts | 0 | 0.0% |
| Communications | 0 | 0.0% |
| Arts & Humanities | 0 | 0.0% |
| Total | 4 | 100.0% |
Transportation & Commute in Cale
Vehicle Availability by Sex in Cale
The most prevalent vehicle ownership categories in Cale are males with 2 vehicles (9, accounting for 69.2%) and females with 2 vehicles (6, making up 90.0%).
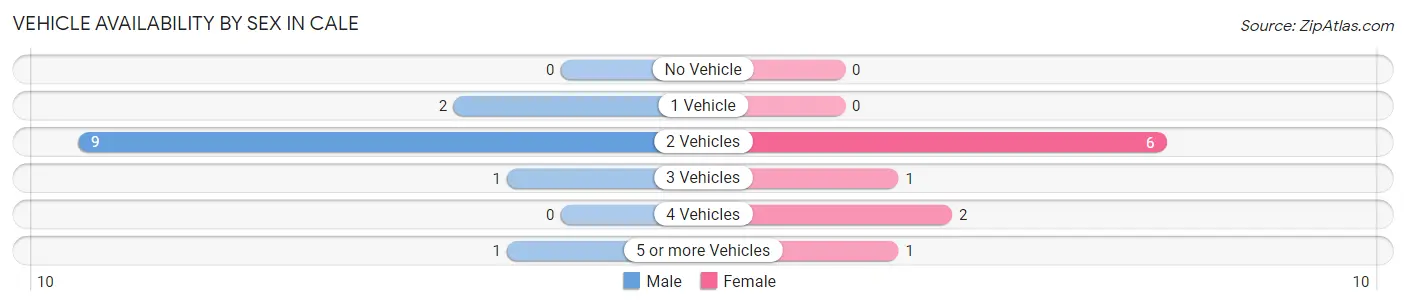
| Vehicles Available | Male | Female |
| No Vehicle | 0 (0.0%) | 0 (0.0%) |
| 1 Vehicle | 2 (15.4%) | 0 (0.0%) |
| 2 Vehicles | 9 (69.2%) | 6 (60.0%) |
| 3 Vehicles | 1 (7.7%) | 1 (10.0%) |
| 4 Vehicles | 0 (0.0%) | 2 (20.0%) |
| 5 or more Vehicles | 1 (7.7%) | 1 (10.0%) |
| Total | 13 (100.0%) | 10 (100.0%) |
Commute Time in Cale
The most frequently occuring commute durations in Cale are 45 to 59 minutes (14 commuters, 66.7%), 30 to 34 minutes (4 commuters, 19.1%), and less than 5 minutes (1 commuters, 4.8%).
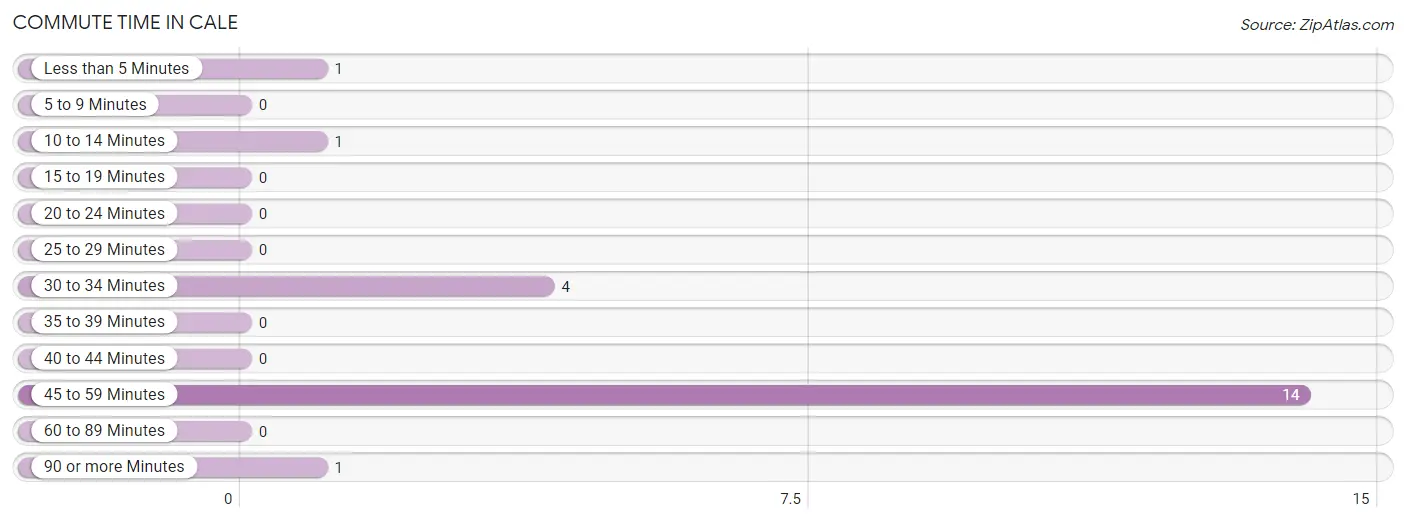
| Commute Time | # Commuters | % Commuters |
| Less than 5 Minutes | 1 | 4.8% |
| 5 to 9 Minutes | 0 | 0.0% |
| 10 to 14 Minutes | 1 | 4.8% |
| 15 to 19 Minutes | 0 | 0.0% |
| 20 to 24 Minutes | 0 | 0.0% |
| 25 to 29 Minutes | 0 | 0.0% |
| 30 to 34 Minutes | 4 | 19.1% |
| 35 to 39 Minutes | 0 | 0.0% |
| 40 to 44 Minutes | 0 | 0.0% |
| 45 to 59 Minutes | 14 | 66.7% |
| 60 to 89 Minutes | 0 | 0.0% |
| 90 or more Minutes | 1 | 4.8% |
Commute Time by Sex in Cale
The most common commute times in Cale are 45 to 59 minutes (7 commuters, 53.8%) for males and 45 to 59 minutes (7 commuters, 87.5%) for females.
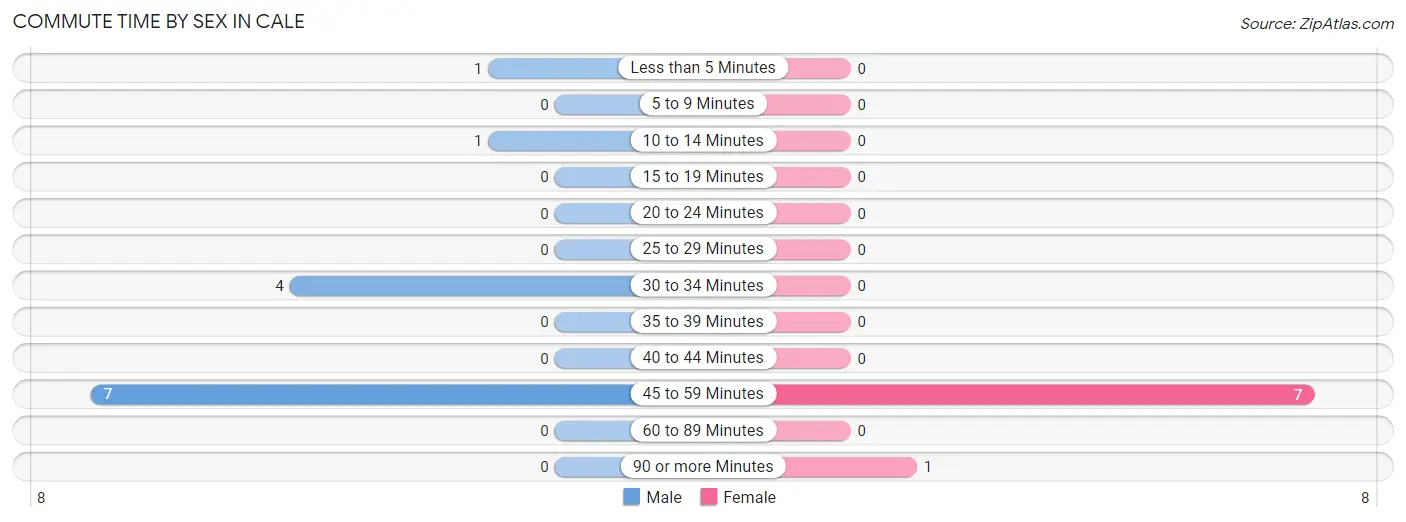
| Commute Time | Male | Female |
| Less than 5 Minutes | 1 (7.7%) | 0 (0.0%) |
| 5 to 9 Minutes | 0 (0.0%) | 0 (0.0%) |
| 10 to 14 Minutes | 1 (7.7%) | 0 (0.0%) |
| 15 to 19 Minutes | 0 (0.0%) | 0 (0.0%) |
| 20 to 24 Minutes | 0 (0.0%) | 0 (0.0%) |
| 25 to 29 Minutes | 0 (0.0%) | 0 (0.0%) |
| 30 to 34 Minutes | 4 (30.8%) | 0 (0.0%) |
| 35 to 39 Minutes | 0 (0.0%) | 0 (0.0%) |
| 40 to 44 Minutes | 0 (0.0%) | 0 (0.0%) |
| 45 to 59 Minutes | 7 (53.8%) | 7 (87.5%) |
| 60 to 89 Minutes | 0 (0.0%) | 0 (0.0%) |
| 90 or more Minutes | 0 (0.0%) | 1 (12.5%) |
Time of Departure to Work by Sex in Cale
The most frequent times of departure to work in Cale are 6:30 AM to 6:59 AM (6, 46.2%) for males and 7:00 AM to 7:29 AM (6, 75.0%) for females.
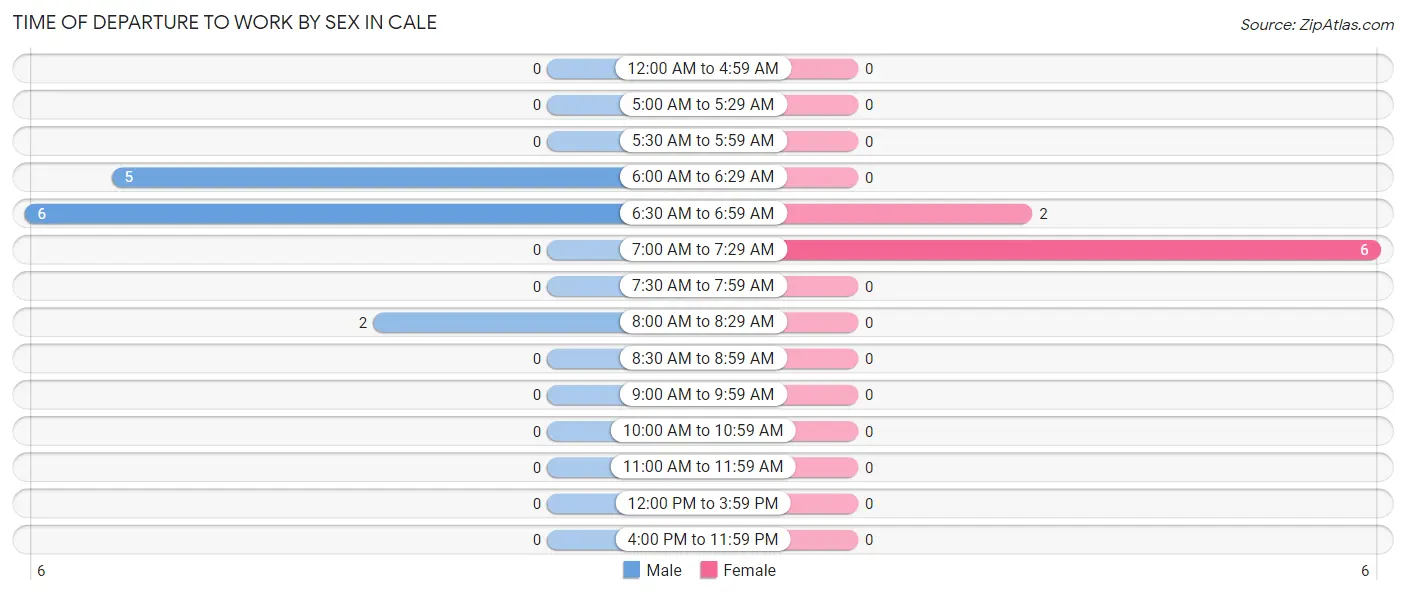
| Time of Departure | Male | Female |
| 12:00 AM to 4:59 AM | 0 (0.0%) | 0 (0.0%) |
| 5:00 AM to 5:29 AM | 0 (0.0%) | 0 (0.0%) |
| 5:30 AM to 5:59 AM | 0 (0.0%) | 0 (0.0%) |
| 6:00 AM to 6:29 AM | 5 (38.5%) | 0 (0.0%) |
| 6:30 AM to 6:59 AM | 6 (46.2%) | 2 (25.0%) |
| 7:00 AM to 7:29 AM | 0 (0.0%) | 6 (75.0%) |
| 7:30 AM to 7:59 AM | 0 (0.0%) | 0 (0.0%) |
| 8:00 AM to 8:29 AM | 2 (15.4%) | 0 (0.0%) |
| 8:30 AM to 8:59 AM | 0 (0.0%) | 0 (0.0%) |
| 9:00 AM to 9:59 AM | 0 (0.0%) | 0 (0.0%) |
| 10:00 AM to 10:59 AM | 0 (0.0%) | 0 (0.0%) |
| 11:00 AM to 11:59 AM | 0 (0.0%) | 0 (0.0%) |
| 12:00 PM to 3:59 PM | 0 (0.0%) | 0 (0.0%) |
| 4:00 PM to 11:59 PM | 0 (0.0%) | 0 (0.0%) |
| Total | 13 (100.0%) | 8 (100.0%) |
Housing Occupancy in Cale
Occupancy by Ownership in Cale
Of the total 32 dwellings in Cale, owner-occupied units account for 22 (68.8%), while renter-occupied units make up 10 (31.2%).
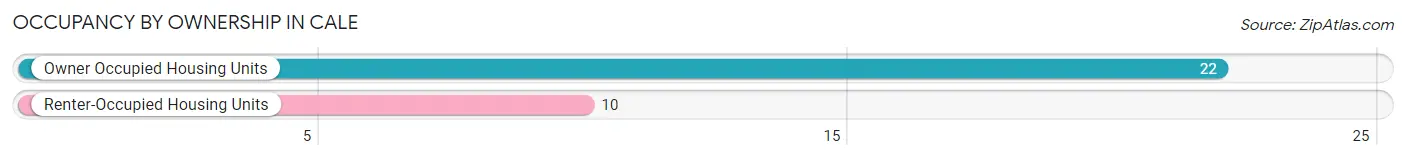
| Occupancy | # Housing Units | % Housing Units |
| Owner Occupied Housing Units | 22 | 68.8% |
| Renter-Occupied Housing Units | 10 | 31.2% |
| Total Occupied Housing Units | 32 | 100.0% |
Occupancy by Household Size in Cale
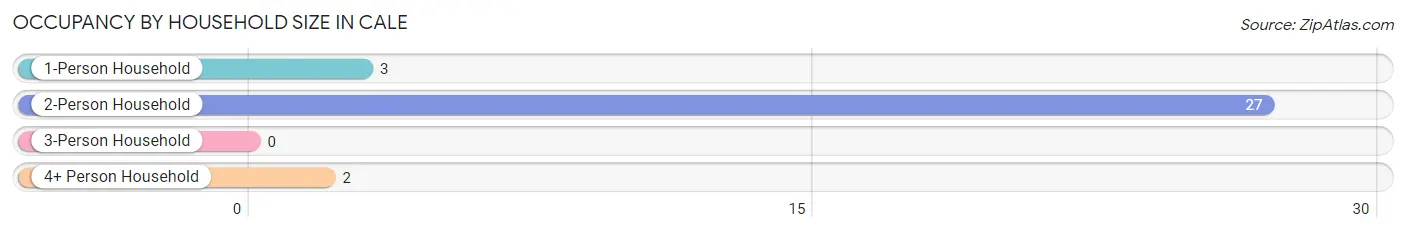
| Household Size | # Housing Units | % Housing Units |
| 1-Person Household | 3 | 9.4% |
| 2-Person Household | 27 | 84.4% |
| 3-Person Household | 0 | 0.0% |
| 4+ Person Household | 2 | 6.2% |
| Total Housing Units | 32 | 100.0% |
Occupancy by Ownership by Household Size in Cale
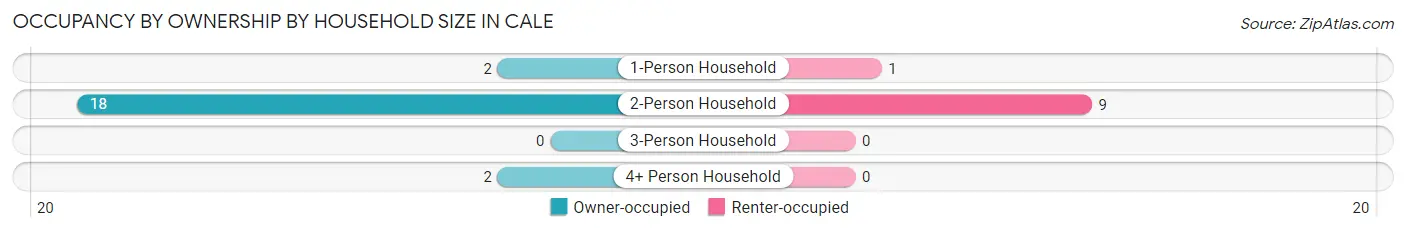
| Household Size | Owner-occupied | Renter-occupied |
| 1-Person Household | 2 (66.7%) | 1 (33.3%) |
| 2-Person Household | 18 (66.7%) | 9 (33.3%) |
| 3-Person Household | 0 (0.0%) | 0 (0.0%) |
| 4+ Person Household | 2 (100.0%) | 0 (0.0%) |
| Total Housing Units | 22 (68.8%) | 10 (31.2%) |
Occupancy by Educational Attainment in Cale
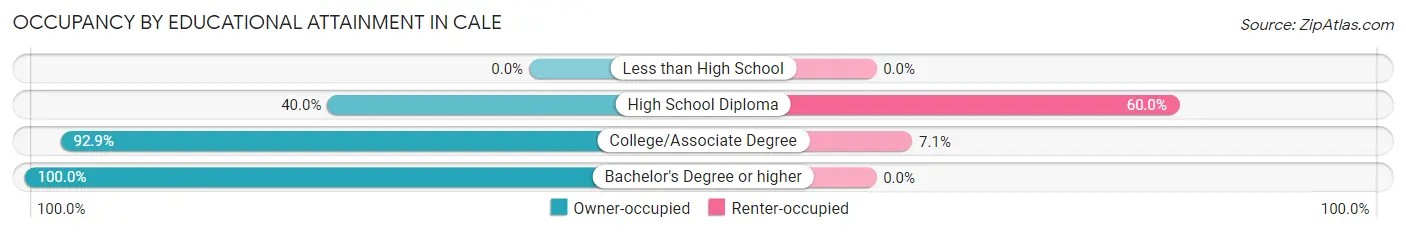
| Household Size | Owner-occupied | Renter-occupied |
| Less than High School | 0 (0.0%) | 0 (0.0%) |
| High School Diploma | 6 (40.0%) | 9 (60.0%) |
| College/Associate Degree | 13 (92.9%) | 1 (7.1%) |
| Bachelor's Degree or higher | 3 (100.0%) | 0 (0.0%) |
Occupancy by Age of Householder in Cale
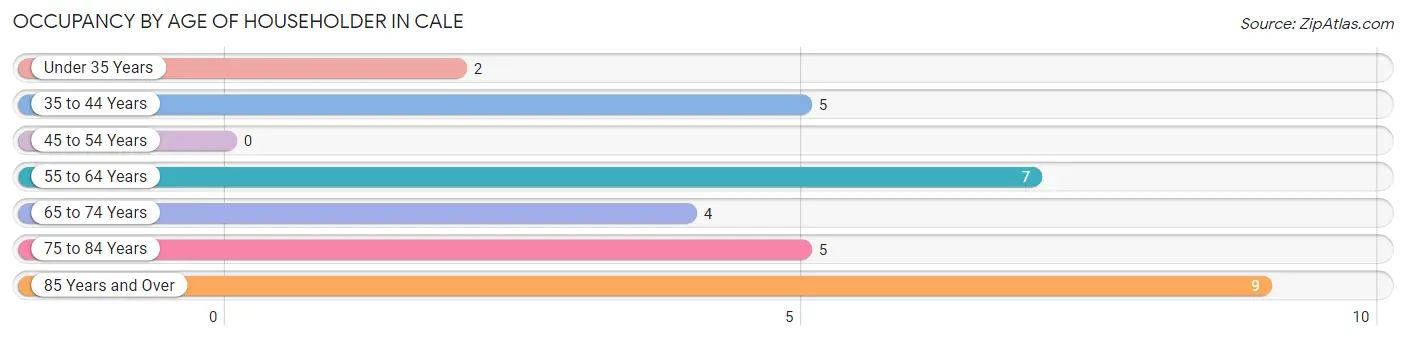
| Age Bracket | # Households | % Households |
| Under 35 Years | 2 | 6.2% |
| 35 to 44 Years | 5 | 15.6% |
| 45 to 54 Years | 0 | 0.0% |
| 55 to 64 Years | 7 | 21.9% |
| 65 to 74 Years | 4 | 12.5% |
| 75 to 84 Years | 5 | 15.6% |
| 85 Years and Over | 9 | 28.1% |
| Total | 32 | 100.0% |
Housing Finances in Cale
Median Income by Occupancy in Cale
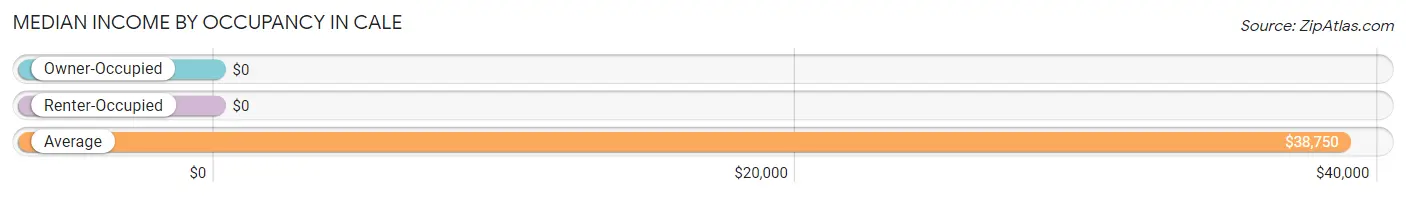
| Occupancy Type | # Households | Median Income |
| Owner-Occupied | 22 (68.8%) | $0 |
| Renter-Occupied | 10 (31.2%) | $0 |
| Average | 32 (100.0%) | $38,750 |
Occupancy by Householder Income Bracket in Cale
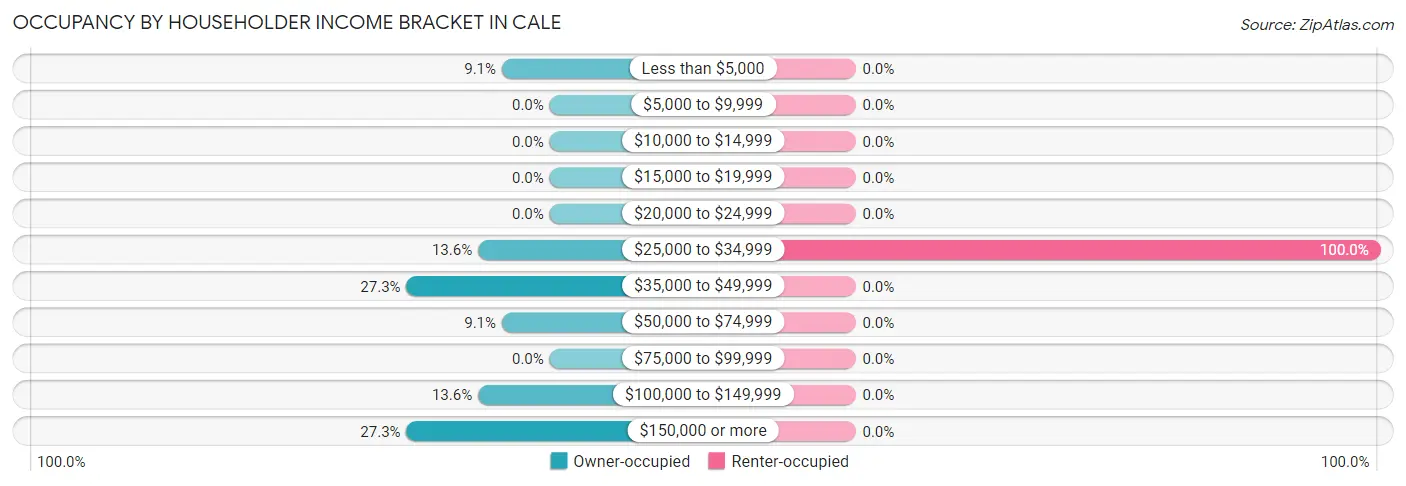
| Income Bracket | Owner-occupied | Renter-occupied |
| Less than $5,000 | 2 (9.1%) | 0 (0.0%) |
| $5,000 to $9,999 | 0 (0.0%) | 0 (0.0%) |
| $10,000 to $14,999 | 0 (0.0%) | 0 (0.0%) |
| $15,000 to $19,999 | 0 (0.0%) | 0 (0.0%) |
| $20,000 to $24,999 | 0 (0.0%) | 0 (0.0%) |
| $25,000 to $34,999 | 3 (13.6%) | 10 (100.0%) |
| $35,000 to $49,999 | 6 (27.3%) | 0 (0.0%) |
| $50,000 to $74,999 | 2 (9.1%) | 0 (0.0%) |
| $75,000 to $99,999 | 0 (0.0%) | 0 (0.0%) |
| $100,000 to $149,999 | 3 (13.6%) | 0 (0.0%) |
| $150,000 or more | 6 (27.3%) | 0 (0.0%) |
| Total | 22 (100.0%) | 10 (100.0%) |
Monthly Housing Cost Tiers in Cale
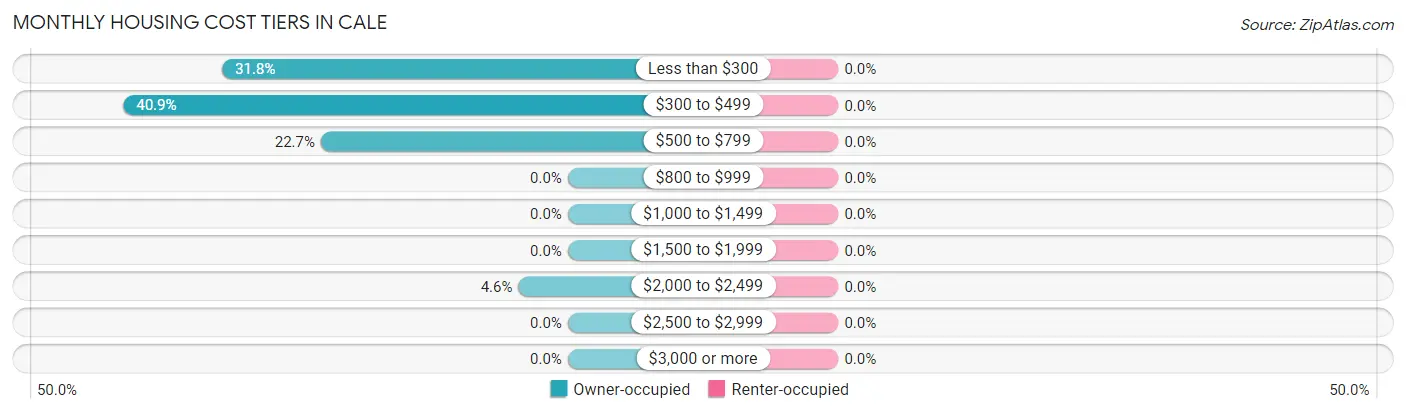
| Monthly Cost | Owner-occupied | Renter-occupied |
| Less than $300 | 7 (31.8%) | 0 (0.0%) |
| $300 to $499 | 9 (40.9%) | 0 (0.0%) |
| $500 to $799 | 5 (22.7%) | 0 (0.0%) |
| $800 to $999 | 0 (0.0%) | 0 (0.0%) |
| $1,000 to $1,499 | 0 (0.0%) | 0 (0.0%) |
| $1,500 to $1,999 | 0 (0.0%) | 0 (0.0%) |
| $2,000 to $2,499 | 1 (4.5%) | 0 (0.0%) |
| $2,500 to $2,999 | 0 (0.0%) | 0 (0.0%) |
| $3,000 or more | 0 (0.0%) | 0 (0.0%) |
| Total | 22 (100.0%) | 10 (100.0%) |
Physical Housing Characteristics in Cale
Housing Structures in Cale
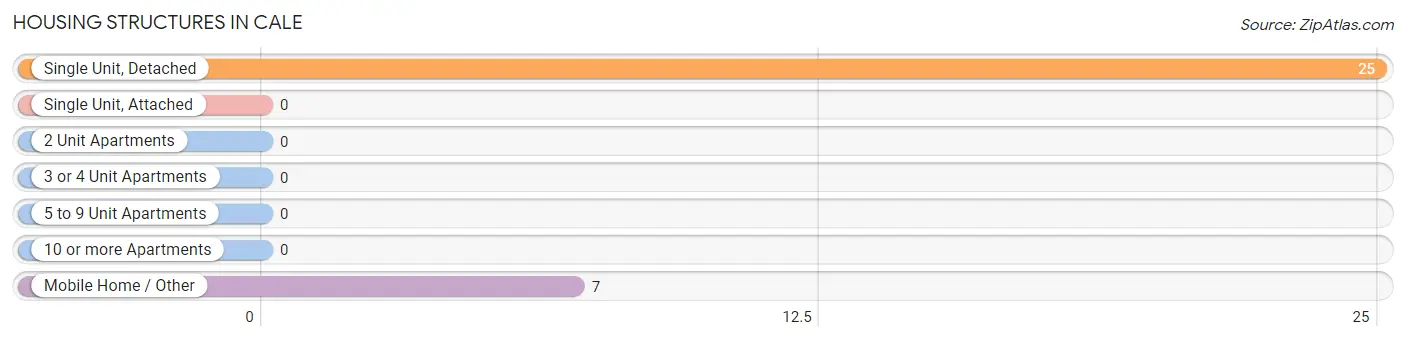
| Structure Type | # Housing Units | % Housing Units |
| Single Unit, Detached | 25 | 78.1% |
| Single Unit, Attached | 0 | 0.0% |
| 2 Unit Apartments | 0 | 0.0% |
| 3 or 4 Unit Apartments | 0 | 0.0% |
| 5 to 9 Unit Apartments | 0 | 0.0% |
| 10 or more Apartments | 0 | 0.0% |
| Mobile Home / Other | 7 | 21.9% |
| Total | 32 | 100.0% |
Housing Structures by Occupancy in Cale
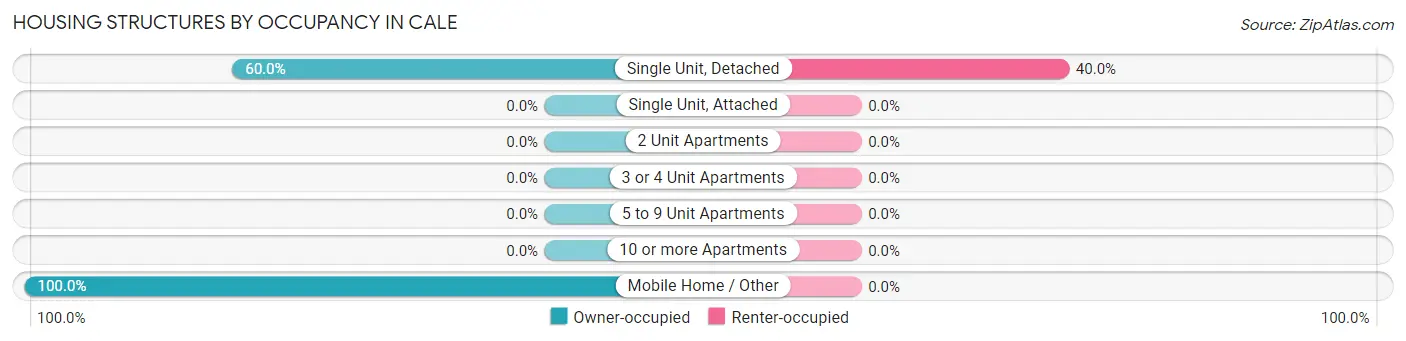
| Structure Type | Owner-occupied | Renter-occupied |
| Single Unit, Detached | 15 (60.0%) | 10 (40.0%) |
| Single Unit, Attached | 0 (0.0%) | 0 (0.0%) |
| 2 Unit Apartments | 0 (0.0%) | 0 (0.0%) |
| 3 or 4 Unit Apartments | 0 (0.0%) | 0 (0.0%) |
| 5 to 9 Unit Apartments | 0 (0.0%) | 0 (0.0%) |
| 10 or more Apartments | 0 (0.0%) | 0 (0.0%) |
| Mobile Home / Other | 7 (100.0%) | 0 (0.0%) |
| Total | 22 (68.8%) | 10 (31.2%) |
Housing Structures by Number of Rooms in Cale
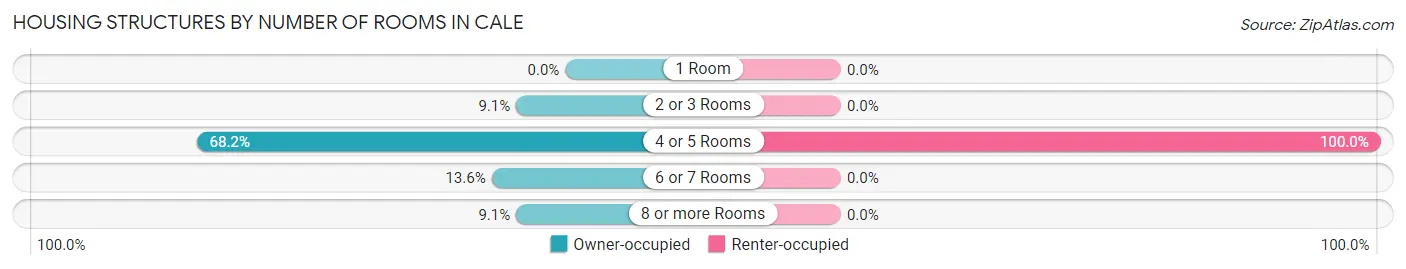
| Number of Rooms | Owner-occupied | Renter-occupied |
| 1 Room | 0 (0.0%) | 0 (0.0%) |
| 2 or 3 Rooms | 2 (9.1%) | 0 (0.0%) |
| 4 or 5 Rooms | 15 (68.2%) | 10 (100.0%) |
| 6 or 7 Rooms | 3 (13.6%) | 0 (0.0%) |
| 8 or more Rooms | 2 (9.1%) | 0 (0.0%) |
| Total | 22 (100.0%) | 10 (100.0%) |
Housing Structure by Heating Type in Cale
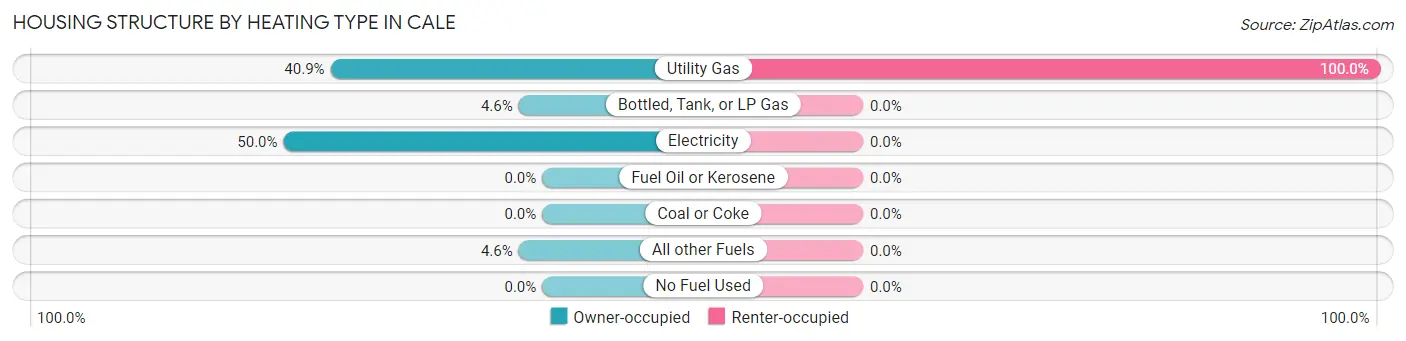
| Heating Type | Owner-occupied | Renter-occupied |
| Utility Gas | 9 (40.9%) | 10 (100.0%) |
| Bottled, Tank, or LP Gas | 1 (4.5%) | 0 (0.0%) |
| Electricity | 11 (50.0%) | 0 (0.0%) |
| Fuel Oil or Kerosene | 0 (0.0%) | 0 (0.0%) |
| Coal or Coke | 0 (0.0%) | 0 (0.0%) |
| All other Fuels | 1 (4.5%) | 0 (0.0%) |
| No Fuel Used | 0 (0.0%) | 0 (0.0%) |
| Total | 22 (100.0%) | 10 (100.0%) |
Household Vehicle Usage in Cale
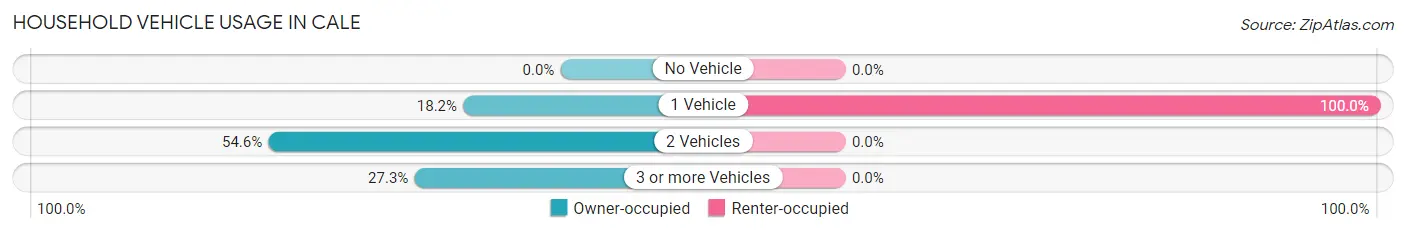
| Vehicles per Household | Owner-occupied | Renter-occupied |
| No Vehicle | 0 (0.0%) | 0 (0.0%) |
| 1 Vehicle | 4 (18.2%) | 10 (100.0%) |
| 2 Vehicles | 12 (54.5%) | 0 (0.0%) |
| 3 or more Vehicles | 6 (27.3%) | 0 (0.0%) |
| Total | 22 (100.0%) | 10 (100.0%) |
Real Estate & Mortgages in Cale
Real Estate and Mortgage Overview in Cale
| Characteristic | Without Mortgage | With Mortgage |
| Housing Units | 19 | 3 |
| Median Property Value | - | - |
| Median Household Income | - | - |
| Monthly Housing Costs | $425 | $0 |
| Real Estate Taxes | $475 | $2 |
Property Value by Mortgage Status in Cale
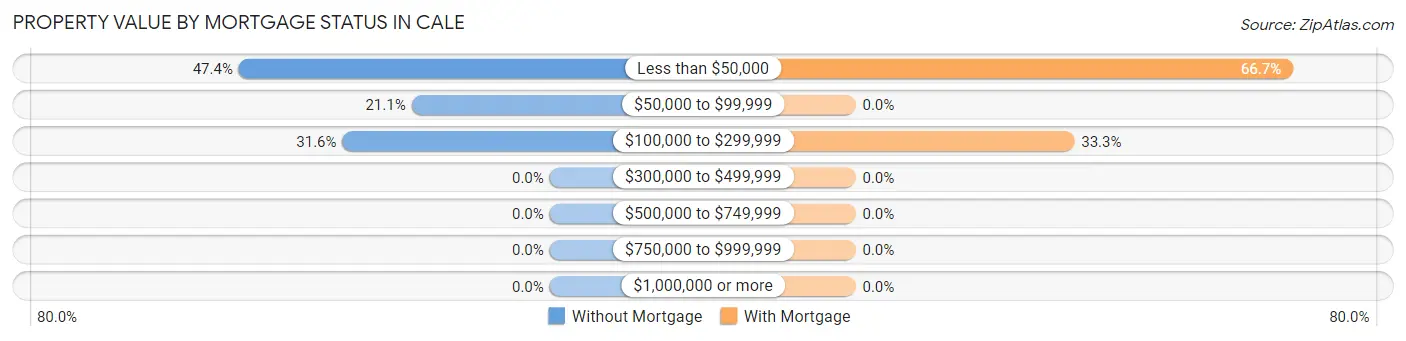
| Property Value | Without Mortgage | With Mortgage |
| Less than $50,000 | 9 (47.4%) | 2 (66.7%) |
| $50,000 to $99,999 | 4 (21.0%) | 0 (0.0%) |
| $100,000 to $299,999 | 6 (31.6%) | 1 (33.3%) |
| $300,000 to $499,999 | 0 (0.0%) | 0 (0.0%) |
| $500,000 to $749,999 | 0 (0.0%) | 0 (0.0%) |
| $750,000 to $999,999 | 0 (0.0%) | 0 (0.0%) |
| $1,000,000 or more | 0 (0.0%) | 0 (0.0%) |
| Total | 19 (100.0%) | 3 (100.0%) |
Household Income by Mortgage Status in Cale
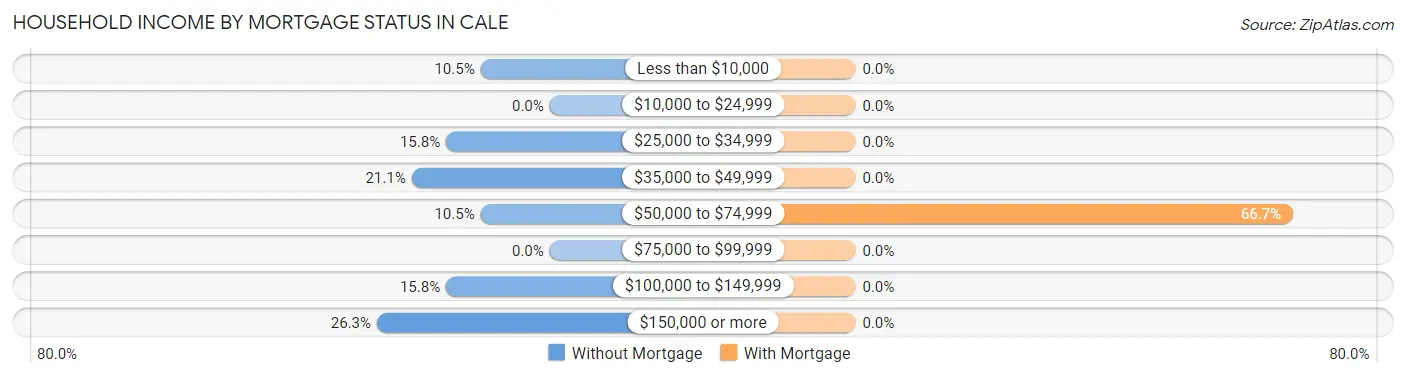
| Household Income | Without Mortgage | With Mortgage |
| Less than $10,000 | 2 (10.5%) | 0 (0.0%) |
| $10,000 to $24,999 | 0 (0.0%) | 0 (0.0%) |
| $25,000 to $34,999 | 3 (15.8%) | 0 (0.0%) |
| $35,000 to $49,999 | 4 (21.0%) | 0 (0.0%) |
| $50,000 to $74,999 | 2 (10.5%) | 2 (66.7%) |
| $75,000 to $99,999 | 0 (0.0%) | 0 (0.0%) |
| $100,000 to $149,999 | 3 (15.8%) | 0 (0.0%) |
| $150,000 or more | 5 (26.3%) | 0 (0.0%) |
| Total | 19 (100.0%) | 3 (100.0%) |
Property Value to Household Income Ratio in Cale
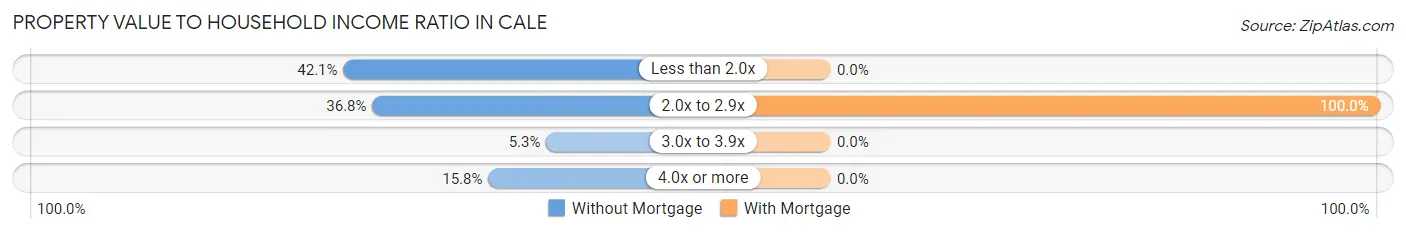
| Value-to-Income Ratio | Without Mortgage | With Mortgage |
| Less than 2.0x | 8 (42.1%) | 0 (0.0%) |
| 2.0x to 2.9x | 7 (36.8%) | 3 (100.0%) |
| 3.0x to 3.9x | 1 (5.3%) | 0 (0.0%) |
| 4.0x or more | 3 (15.8%) | 0 (0.0%) |
| Total | 19 (100.0%) | 3 (100.0%) |
Real Estate Taxes by Mortgage Status in Cale
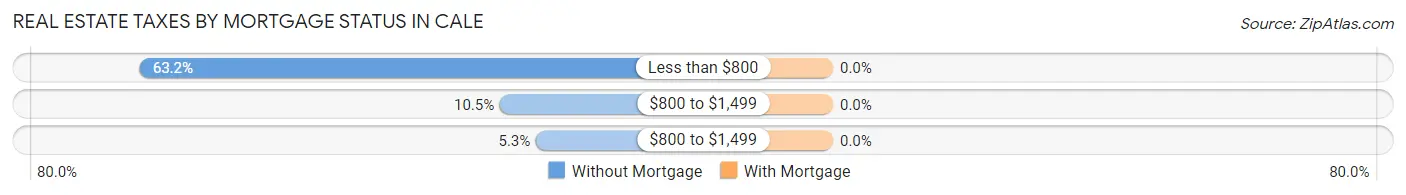
| Property Taxes | Without Mortgage | With Mortgage |
| Less than $800 | 12 (63.2%) | 0 (0.0%) |
| $800 to $1,499 | 2 (10.5%) | 0 (0.0%) |
| $800 to $1,499 | 1 (5.3%) | 0 (0.0%) |
| Total | 19 (100.0%) | 3 (100.0%) |
Health & Disability in Cale
Health Insurance Coverage by Age in Cale
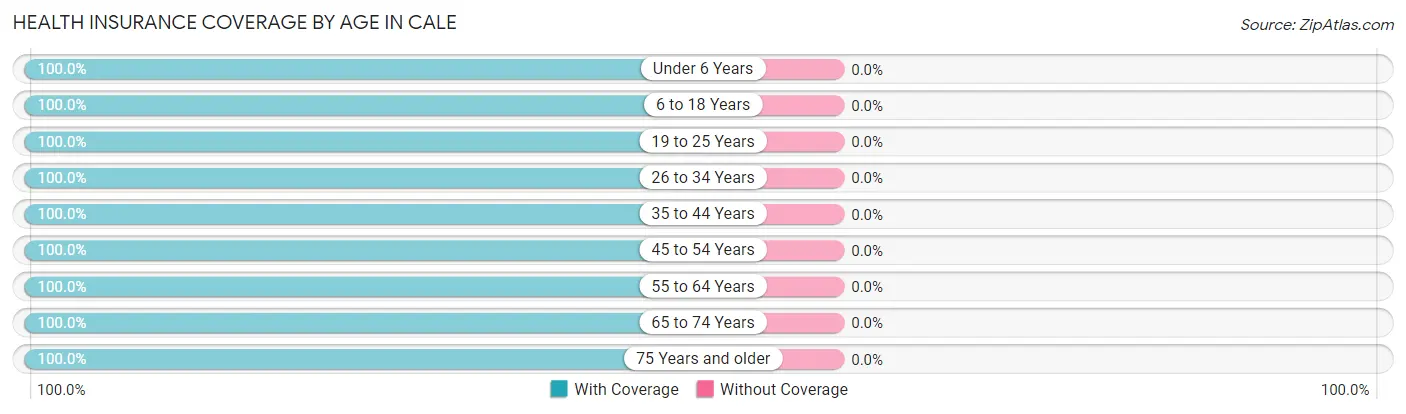
| Age Bracket | With Coverage | Without Coverage |
| Under 6 Years | 1 (100.0%) | 0 (0.0%) |
| 6 to 18 Years | 2 (100.0%) | 0 (0.0%) |
| 19 to 25 Years | 4 (100.0%) | 0 (0.0%) |
| 26 to 34 Years | 8 (100.0%) | 0 (0.0%) |
| 35 to 44 Years | 5 (100.0%) | 0 (0.0%) |
| 45 to 54 Years | 7 (100.0%) | 0 (0.0%) |
| 55 to 64 Years | 15 (100.0%) | 0 (0.0%) |
| 65 to 74 Years | 5 (100.0%) | 0 (0.0%) |
| 75 Years and older | 22 (100.0%) | 0 (0.0%) |
| Total | 69 (100.0%) | 0 (0.0%) |
Health Insurance Coverage by Citizenship Status in Cale
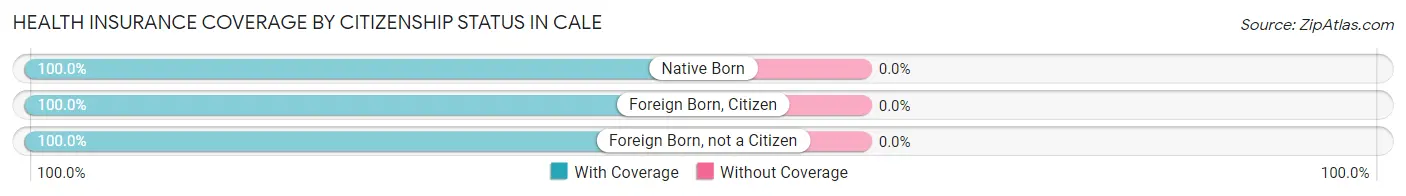
| Citizenship Status | With Coverage | Without Coverage |
| Native Born | 1 (100.0%) | 0 (0.0%) |
| Foreign Born, Citizen | 2 (100.0%) | 0 (0.0%) |
| Foreign Born, not a Citizen | 4 (100.0%) | 0 (0.0%) |
Health Insurance Coverage by Household Income in Cale
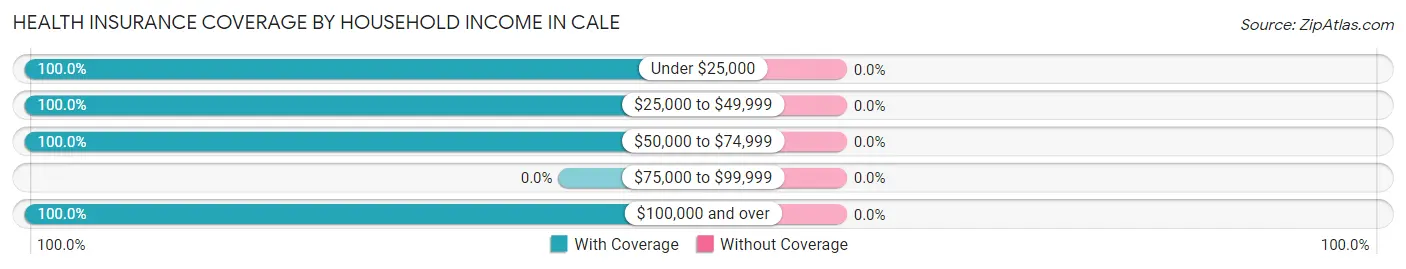
| Household Income | With Coverage | Without Coverage |
| Under $25,000 | 6 (100.0%) | 0 (0.0%) |
| $25,000 to $49,999 | 32 (100.0%) | 0 (0.0%) |
| $50,000 to $74,999 | 9 (100.0%) | 0 (0.0%) |
| $75,000 to $99,999 | 0 (0.0%) | 0 (0.0%) |
| $100,000 and over | 22 (100.0%) | 0 (0.0%) |
Public vs Private Health Insurance Coverage by Age in Cale
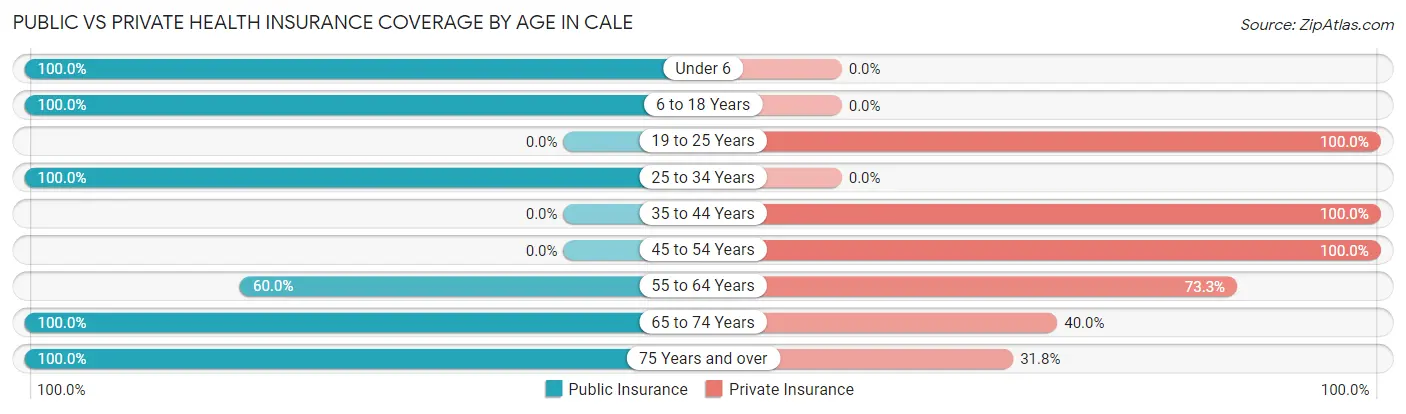
| Age Bracket | Public Insurance | Private Insurance |
| Under 6 | 1 (100.0%) | 0 (0.0%) |
| 6 to 18 Years | 2 (100.0%) | 0 (0.0%) |
| 19 to 25 Years | 0 (0.0%) | 4 (100.0%) |
| 25 to 34 Years | 8 (100.0%) | 0 (0.0%) |
| 35 to 44 Years | 0 (0.0%) | 5 (100.0%) |
| 45 to 54 Years | 0 (0.0%) | 7 (100.0%) |
| 55 to 64 Years | 9 (60.0%) | 11 (73.3%) |
| 65 to 74 Years | 5 (100.0%) | 2 (40.0%) |
| 75 Years and over | 22 (100.0%) | 7 (31.8%) |
| Total | 47 (68.1%) | 36 (52.2%) |
Disability Status by Sex by Age in Cale
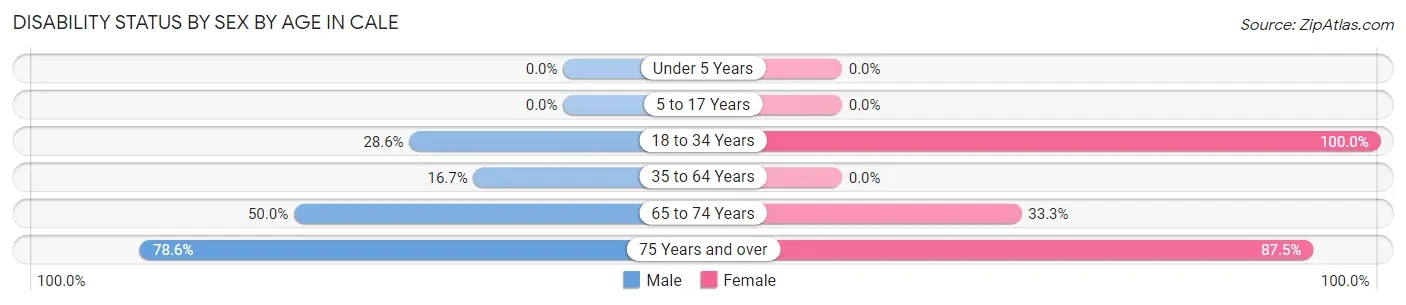
| Age Bracket | Male | Female |
| Under 5 Years | 0 (0.0%) | 0 (0.0%) |
| 5 to 17 Years | 0 (0.0%) | 0 (0.0%) |
| 18 to 34 Years | 2 (28.6%) | 5 (100.0%) |
| 35 to 64 Years | 2 (16.7%) | 0 (0.0%) |
| 65 to 74 Years | 1 (50.0%) | 1 (33.3%) |
| 75 Years and over | 11 (78.6%) | 7 (87.5%) |
Disability Class by Sex by Age in Cale
Disability Class: Hearing Difficulty
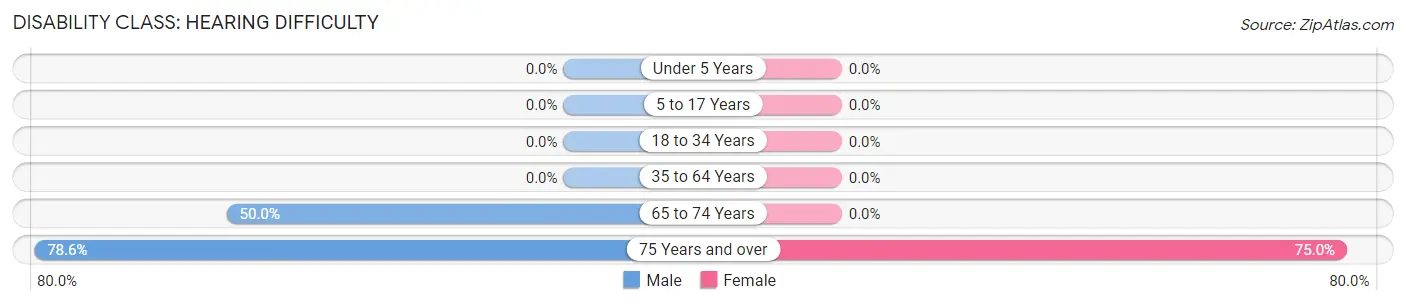
| Age Bracket | Male | Female |
| Under 5 Years | 0 (0.0%) | 0 (0.0%) |
| 5 to 17 Years | 0 (0.0%) | 0 (0.0%) |
| 18 to 34 Years | 0 (0.0%) | 0 (0.0%) |
| 35 to 64 Years | 0 (0.0%) | 0 (0.0%) |
| 65 to 74 Years | 1 (50.0%) | 0 (0.0%) |
| 75 Years and over | 11 (78.6%) | 6 (75.0%) |
Disability Class: Vision Difficulty
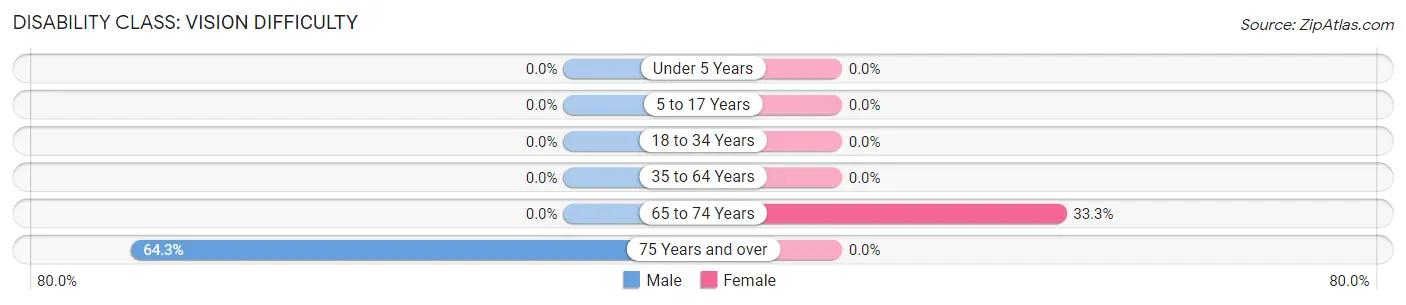
| Age Bracket | Male | Female |
| Under 5 Years | 0 (0.0%) | 0 (0.0%) |
| 5 to 17 Years | 0 (0.0%) | 0 (0.0%) |
| 18 to 34 Years | 0 (0.0%) | 0 (0.0%) |
| 35 to 64 Years | 0 (0.0%) | 0 (0.0%) |
| 65 to 74 Years | 0 (0.0%) | 1 (33.3%) |
| 75 Years and over | 9 (64.3%) | 0 (0.0%) |
Disability Class: Cognitive Difficulty
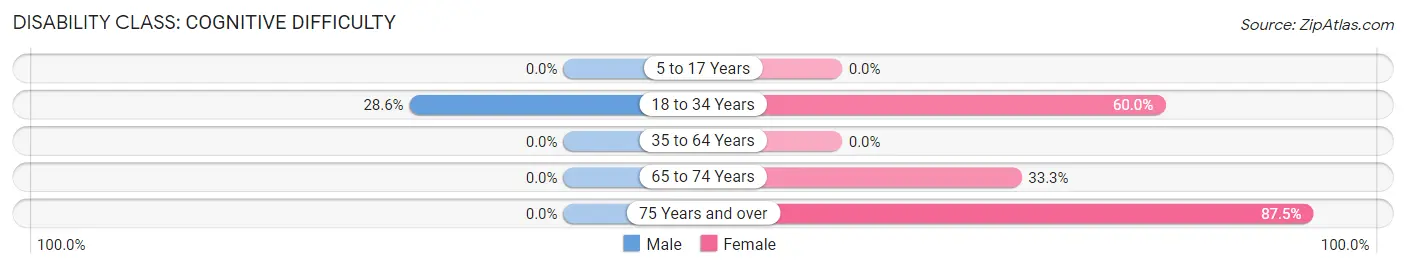
| Age Bracket | Male | Female |
| 5 to 17 Years | 0 (0.0%) | 0 (0.0%) |
| 18 to 34 Years | 2 (28.6%) | 3 (60.0%) |
| 35 to 64 Years | 0 (0.0%) | 0 (0.0%) |
| 65 to 74 Years | 0 (0.0%) | 1 (33.3%) |
| 75 Years and over | 0 (0.0%) | 7 (87.5%) |
Disability Class: Ambulatory Difficulty
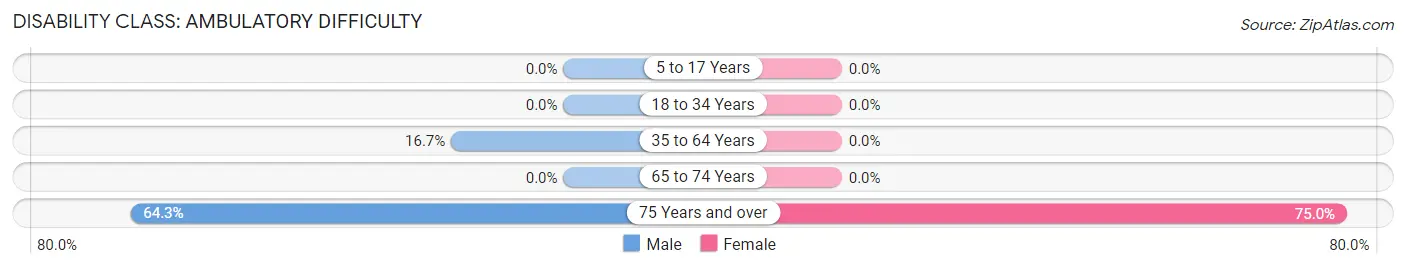
| Age Bracket | Male | Female |
| 5 to 17 Years | 0 (0.0%) | 0 (0.0%) |
| 18 to 34 Years | 0 (0.0%) | 0 (0.0%) |
| 35 to 64 Years | 2 (16.7%) | 0 (0.0%) |
| 65 to 74 Years | 0 (0.0%) | 0 (0.0%) |
| 75 Years and over | 9 (64.3%) | 6 (75.0%) |
Disability Class: Self-Care Difficulty
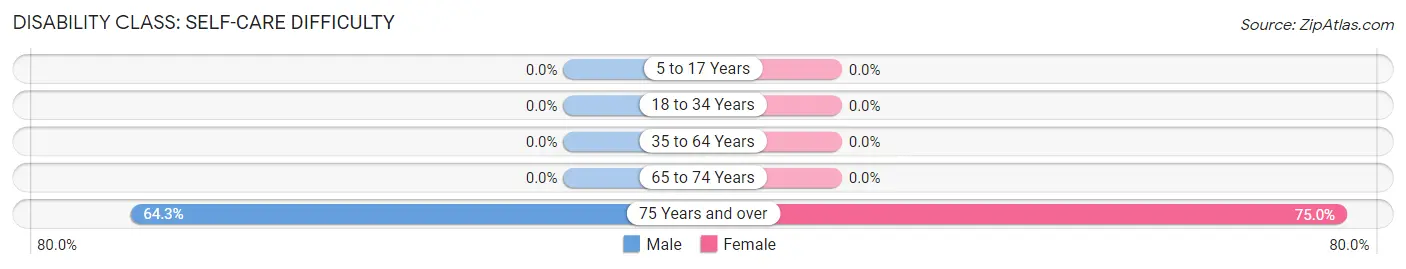
| Age Bracket | Male | Female |
| 5 to 17 Years | 0 (0.0%) | 0 (0.0%) |
| 18 to 34 Years | 0 (0.0%) | 0 (0.0%) |
| 35 to 64 Years | 0 (0.0%) | 0 (0.0%) |
| 65 to 74 Years | 0 (0.0%) | 0 (0.0%) |
| 75 Years and over | 9 (64.3%) | 6 (75.0%) |
Technology Access in Cale
Computing Device Access in Cale
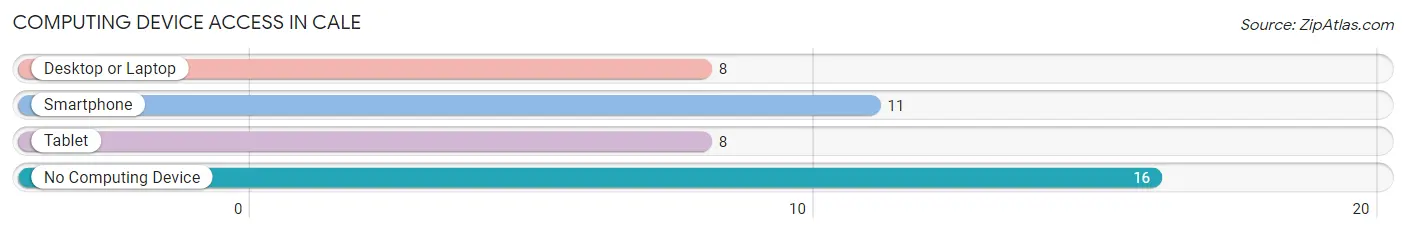
| Device Type | # Households | % Households |
| Desktop or Laptop | 8 | 25.0% |
| Smartphone | 11 | 34.4% |
| Tablet | 8 | 25.0% |
| No Computing Device | 16 | 50.0% |
| Total | 32 | 100.0% |
Internet Access in Cale
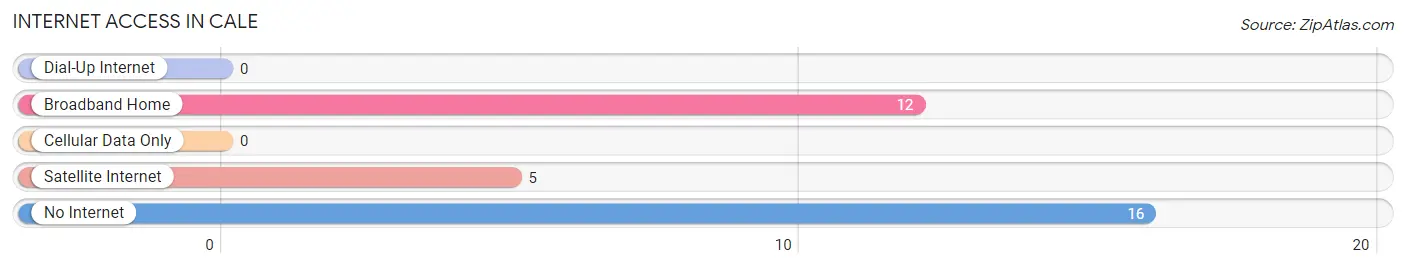
| Internet Type | # Households | % Households |
| Dial-Up Internet | 0 | 0.0% |
| Broadband Home | 12 | 37.5% |
| Cellular Data Only | 0 | 0.0% |
| Satellite Internet | 5 | 15.6% |
| No Internet | 16 | 50.0% |
| Total | 32 | 100.0% |
Cale Summary
Cale is a city located in the state of Arkansas, in the United States of America. It is the county seat of Pulaski County and is situated in the central part of the state. Cale is the largest city in the state and is the cultural, economic, and governmental center of the state.
History
Cale was founded in 1876 by the Arkansas and Louisiana Railroad. The city was named after the railroad's president, Cale B. Moore. The city was incorporated in 1881 and was the first city in the state to have electric streetcars. In the early 1900s, Cale was a major center for the timber industry and was home to several large sawmills. The city also had a thriving cotton industry and was home to several cotton mills.
In the 1950s, Cale experienced a period of rapid growth and development. The city was the site of the first shopping mall in the state, Park Plaza Mall, which opened in 1956. The city also saw the construction of several new highways, including Interstate 40, which connected Cale to Little Rock and Memphis.
Geography
Cale is located in the central part of the state, in Pulaski County. The city is situated on the Arkansas River and is surrounded by the Ouachita Mountains. The city has a total area of 97.3 square miles, of which 95.7 square miles is land and 1.6 square miles is water.
The climate in Cale is humid subtropical, with hot, humid summers and mild winters. The average annual temperature is 64.3°F, with an average high of 87.2°F in July and an average low of 41.2°F in January. The average annual precipitation is 48.3 inches.
Economy
Cale is the economic and governmental center of the state. The city is home to several major corporations, including Dillard's, Walmart, and Tyson Foods. The city is also home to the University of Arkansas at Cale, which is the state's largest university.
The city's economy is largely based on the service industry, with healthcare, education, and government being the largest employers. The city is also home to several major manufacturing companies, including General Electric, Whirlpool, and International Paper.
Demographics
As of the 2010 census, Cale had a population of 193,524. The racial makeup of the city was 63.2% White, 28.3% African American, 0.7% Native American, 2.2% Asian, and 5.6% from other races. The median household income was $41,945, and the median family income was $50,945.
Cale is home to a diverse population, with a variety of cultures and religions represented. The city is home to several churches, including the First United Methodist Church, the Cathedral of St. Andrew, and the Cathedral of St. John the Baptist. The city also has a large Jewish population, with several synagogues located in the city.
Common Questions
What is Per Capita Income in Cale?
Per Capita income in Cale is $35,732.
What is the Median Household income in Cale?
Median Household Income in Cale is $38,750.
What is Inequality or Gini Index in Cale?
Inequality or Gini Index in Cale is 0.48.
What is the Total Population of Cale?
Total Population of Cale is 69.
What is the Total Male Population of Cale?
Total Male Population of Cale is 36.
What is the Total Female Population of Cale?
Total Female Population of Cale is 33.
What is the Ratio of Males per 100 Females in Cale?
There are 109.09 Males per 100 Females in Cale.
What is the Ratio of Females per 100 Males in Cale?
There are 91.67 Females per 100 Males in Cale.
What is the Median Population Age in Cale?
Median Population Age in Cale is 61.6 Years.
What is the Average Family Size in Cale
Average Family Size in Cale is 2.2 People.
What is the Average Household Size in Cale
Average Household Size in Cale is 2.2 People.
How Large is the Labor Force in Cale?
There are 24 People in the Labor Forcein in Cale.
What is the Percentage of People in the Labor Force in Cale?
36.4% of People are in the Labor Force in Cale.