Landmark, AR Map & Demographics
Landmark Map
Landmark Overview
$33,453
PER CAPITA INCOME
$63,922
AVG FAMILY INCOME
$47,742
AVG HOUSEHOLD INCOME
41.0%
WAGE / INCOME GAP [ % ]
59.0¢/ $1
WAGE / INCOME GAP [ $ ]
$10,431
FAMILY INCOME DEFICIT
0.58
INEQUALITY / GINI INDEX
3,620
TOTAL POPULATION
1,710
MALE POPULATION
1,910
FEMALE POPULATION
89.53
MALES / 100 FEMALES
111.70
FEMALES / 100 MALES
47.8
MEDIAN AGE
3.4
AVG FAMILY SIZE
2.6
AVG HOUSEHOLD SIZE
1,450
LABOR FORCE [ PEOPLE ]
52.8%
PERCENT IN LABOR FORCE
4.5%
UNEMPLOYMENT RATE
Income in Landmark
Income Overview in Landmark
Per Capita Income in Landmark is $33,453, while median incomes of families and households are $63,922 and $47,742 respectively.
| Characteristic | Number | Measure |
| Per Capita Income | 3,620 | $33,453 |
| Median Family Income | 888 | $63,922 |
| Mean Family Income | 888 | $117,129 |
| Median Household Income | 1,364 | $47,742 |
| Mean Household Income | 1,364 | $88,398 |
| Income Deficit | 888 | $10,431 |
| Wage / Income Gap (%) | 3,620 | 40.99% |
| Wage / Income Gap ($) | 3,620 | 59.01¢ per $1 |
| Gini / Inequality Index | 3,620 | 0.58 |
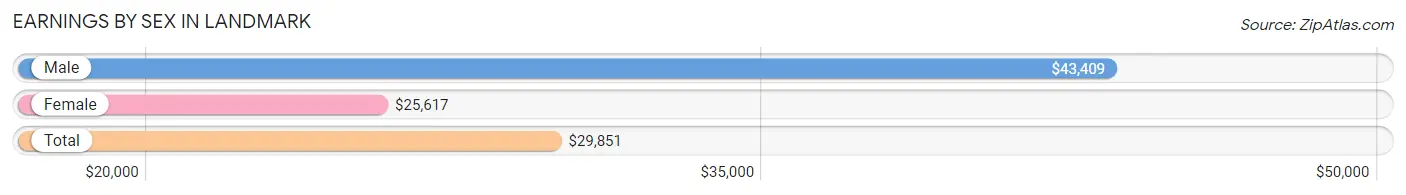
Earnings by Sex in Landmark
Average Earnings in Landmark are $29,851, $43,409 for men and $25,617 for women, a difference of 41.0%.
| Sex | Number | Average Earnings |
| Male | 752 (51.6%) | $43,409 |
| Female | 705 (48.4%) | $25,617 |
| Total | 1,457 (100.0%) | $29,851 |
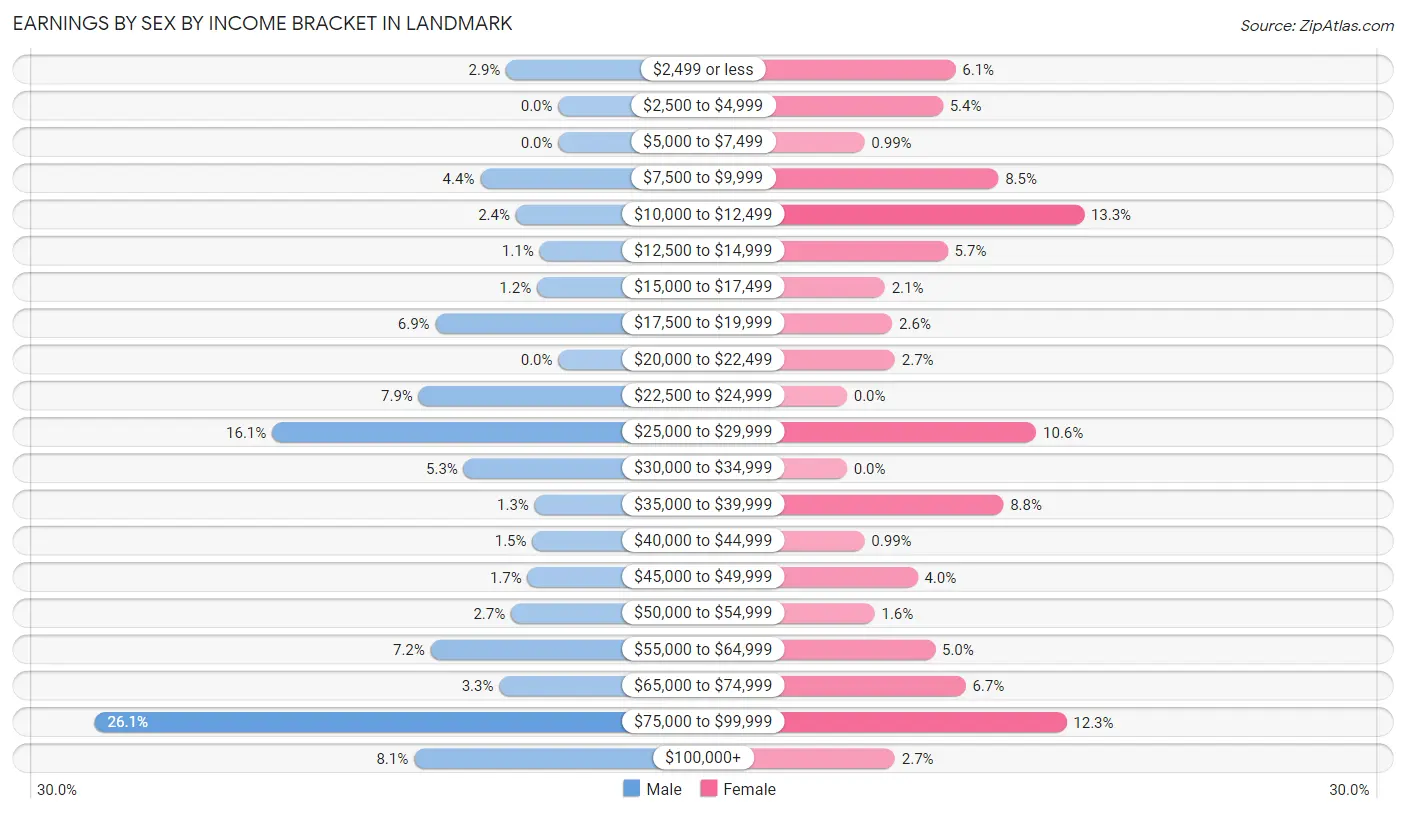
Earnings by Sex by Income Bracket in Landmark
The most common earnings brackets in Landmark are $75,000 to $99,999 for men (196 | 26.1%) and $10,000 to $12,499 for women (94 | 13.3%).
| Income | Male | Female |
| $2,499 or less | 22 (2.9%) | 43 (6.1%) |
| $2,500 to $4,999 | 0 (0.0%) | 38 (5.4%) |
| $5,000 to $7,499 | 0 (0.0%) | 7 (1.0%) |
| $7,500 to $9,999 | 33 (4.4%) | 60 (8.5%) |
| $10,000 to $12,499 | 18 (2.4%) | 94 (13.3%) |
| $12,500 to $14,999 | 8 (1.1%) | 40 (5.7%) |
| $15,000 to $17,499 | 9 (1.2%) | 15 (2.1%) |
| $17,500 to $19,999 | 52 (6.9%) | 18 (2.5%) |
| $20,000 to $22,499 | 0 (0.0%) | 19 (2.7%) |
| $22,500 to $24,999 | 59 (7.9%) | 0 (0.0%) |
| $25,000 to $29,999 | 121 (16.1%) | 75 (10.6%) |
| $30,000 to $34,999 | 40 (5.3%) | 0 (0.0%) |
| $35,000 to $39,999 | 10 (1.3%) | 62 (8.8%) |
| $40,000 to $44,999 | 11 (1.5%) | 7 (1.0%) |
| $45,000 to $49,999 | 13 (1.7%) | 28 (4.0%) |
| $50,000 to $54,999 | 20 (2.7%) | 11 (1.6%) |
| $55,000 to $64,999 | 54 (7.2%) | 35 (5.0%) |
| $65,000 to $74,999 | 25 (3.3%) | 47 (6.7%) |
| $75,000 to $99,999 | 196 (26.1%) | 87 (12.3%) |
| $100,000+ | 61 (8.1%) | 19 (2.7%) |
| Total | 752 (100.0%) | 705 (100.0%) |
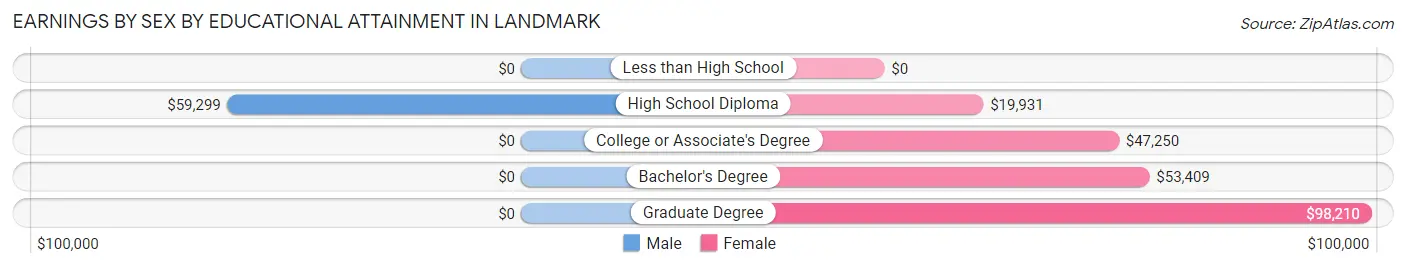
Earnings by Sex by Educational Attainment in Landmark
Average earnings in Landmark are $52,778 for men and $27,300 for women, a difference of 48.3%. Men with an educational attainment of high school diploma enjoy the highest average annual earnings of $59,299, while those with high school diploma education earn the least with $59,299. Women with an educational attainment of graduate degree earn the most with the average annual earnings of $98,210, while those with high school diploma education have the smallest earnings of $19,931.
| Educational Attainment | Male Income | Female Income |
| Less than High School | - | - |
| High School Diploma | $59,299 | $19,931 |
| College or Associate's Degree | - | - |
| Bachelor's Degree | - | - |
| Graduate Degree | - | - |
| Total | $52,778 | $27,300 |
Family Income in Landmark
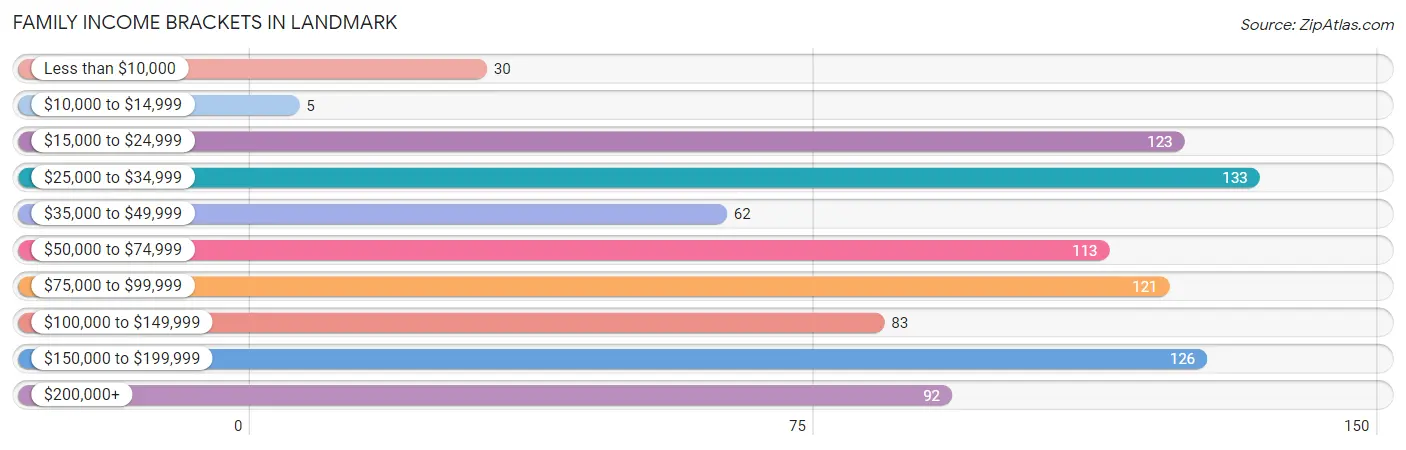
Family Income Brackets in Landmark
According to the Landmark family income data, there are 133 families falling into the $25,000 to $34,999 income range, which is the most common income bracket and makes up 15.0% of all families. Conversely, the $10,000 to $14,999 income bracket is the least frequent group with only 5 families (0.6%) belonging to this category.
| Income Bracket | # Families | % Families |
| Less than $10,000 | 30 | 3.4% |
| $10,000 to $14,999 | 5 | 0.6% |
| $15,000 to $24,999 | 123 | 13.9% |
| $25,000 to $34,999 | 133 | 15.0% |
| $35,000 to $49,999 | 62 | 7.0% |
| $50,000 to $74,999 | 113 | 12.7% |
| $75,000 to $99,999 | 121 | 13.6% |
| $100,000 to $149,999 | 83 | 9.3% |
| $150,000 to $199,999 | 126 | 14.2% |
| $200,000+ | 92 | 10.4% |
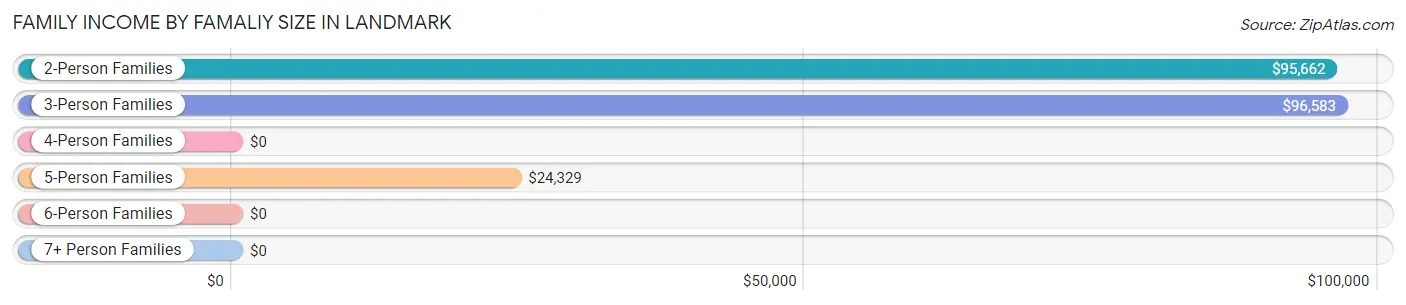
Family Income by Famaliy Size in Landmark
3-person families (203 | 22.9%) account for the highest median family income in Landmark with $96,583 per family, while 2-person families (422 | 47.5%) have the highest median income of $47,831 per family member.
| Income Bracket | # Families | Median Income |
| 2-Person Families | 422 (47.5%) | $95,662 |
| 3-Person Families | 203 (22.9%) | $96,583 |
| 4-Person Families | 97 (10.9%) | $0 |
| 5-Person Families | 70 (7.9%) | $24,329 |
| 6-Person Families | 96 (10.8%) | $0 |
| 7+ Person Families | 0 (0.0%) | $0 |
| Total | 888 (100.0%) | $63,922 |
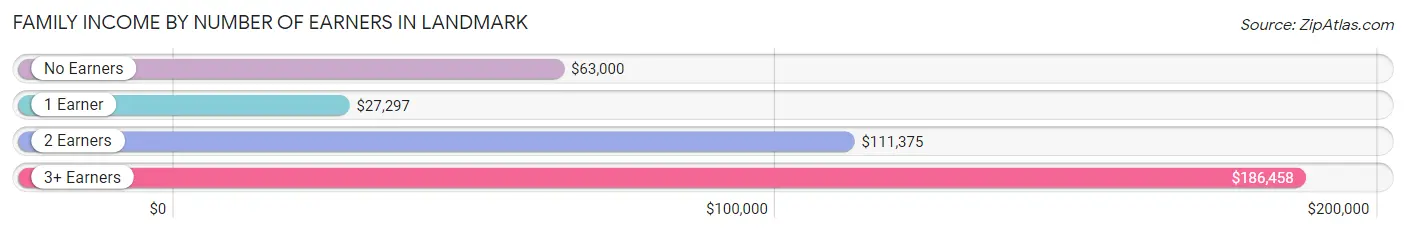
Family Income by Number of Earners in Landmark
The median family income in Landmark is $63,922, with families comprising 3+ earners (58) having the highest median family income of $186,458, while families with 1 earner (381) have the lowest median family income of $27,297, accounting for 6.5% and 42.9% of families, respectively.
| Number of Earners | # Families | Median Income |
| No Earners | 176 (19.8%) | $63,000 |
| 1 Earner | 381 (42.9%) | $27,297 |
| 2 Earners | 273 (30.7%) | $111,375 |
| 3+ Earners | 58 (6.5%) | $186,458 |
| Total | 888 (100.0%) | $63,922 |
Household Income in Landmark
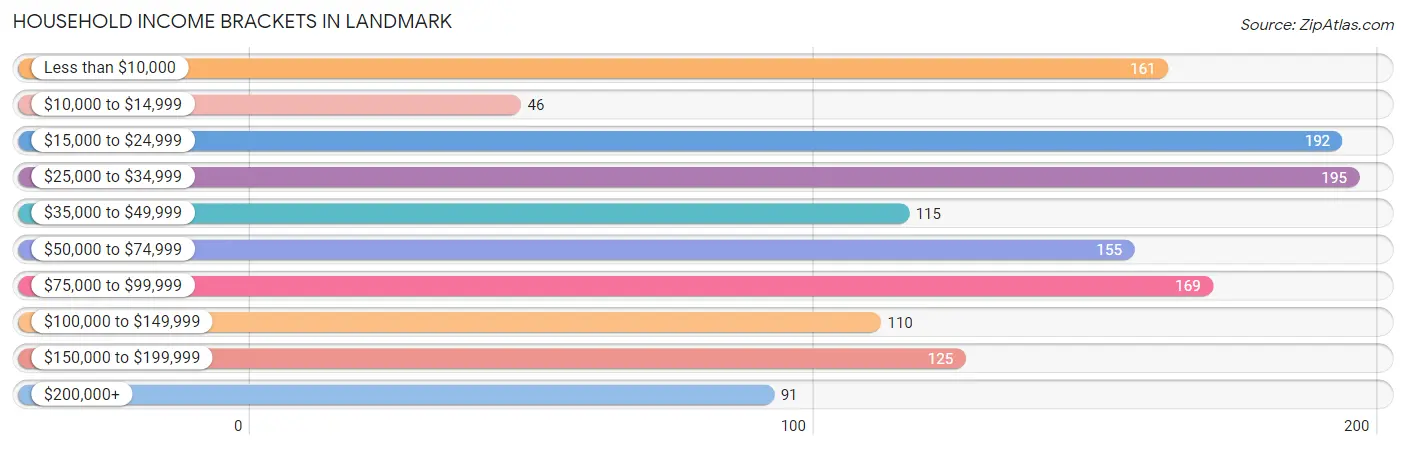
Household Income Brackets in Landmark
With 195 households falling in the category, the $25,000 to $34,999 income range is the most frequent in Landmark, accounting for 14.3% of all households. In contrast, only 46 households (3.4%) fall into the $10,000 to $14,999 income bracket, making it the least populous group.
| Income Bracket | # Households | % Households |
| Less than $10,000 | 161 | 11.8% |
| $10,000 to $14,999 | 46 | 3.4% |
| $15,000 to $24,999 | 192 | 14.1% |
| $25,000 to $34,999 | 195 | 14.3% |
| $35,000 to $49,999 | 115 | 8.4% |
| $50,000 to $74,999 | 155 | 11.4% |
| $75,000 to $99,999 | 169 | 12.4% |
| $100,000 to $149,999 | 110 | 8.1% |
| $150,000 to $199,999 | 125 | 9.2% |
| $200,000+ | 91 | 6.7% |
Household Income by Householder Age in Landmark
The median household income in Landmark is $47,742, with the highest median household income of $63,407 found in the 65+ years age bracket for the primary householder. A total of 451 households (33.1%) fall into this category. Meanwhile, the 15 to 24 years age bracket for the primary householder has the lowest median household income of $0, with 7 households (0.5%) in this group.
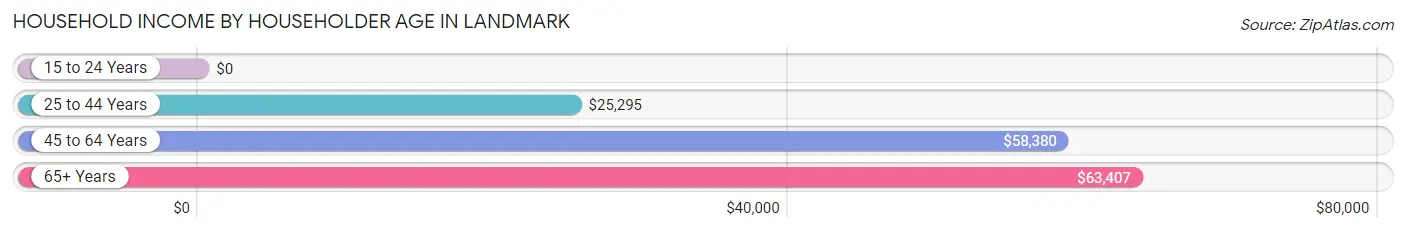
| Income Bracket | # Households | Median Income |
| 15 to 24 Years | 7 (0.5%) | $0 |
| 25 to 44 Years | 297 (21.8%) | $25,295 |
| 45 to 64 Years | 609 (44.7%) | $58,380 |
| 65+ Years | 451 (33.1%) | $63,407 |
| Total | 1,364 (100.0%) | $47,742 |
Poverty in Landmark
Income Below Poverty by Sex and Age in Landmark
With 46.3% poverty level for males and 40.0% for females among the residents of Landmark, 15 year old males and 12 to 14 year old females are the most vulnerable to poverty, with 32 males (100.0%) and 98 females (100.0%) in their respective age groups living below the poverty level.
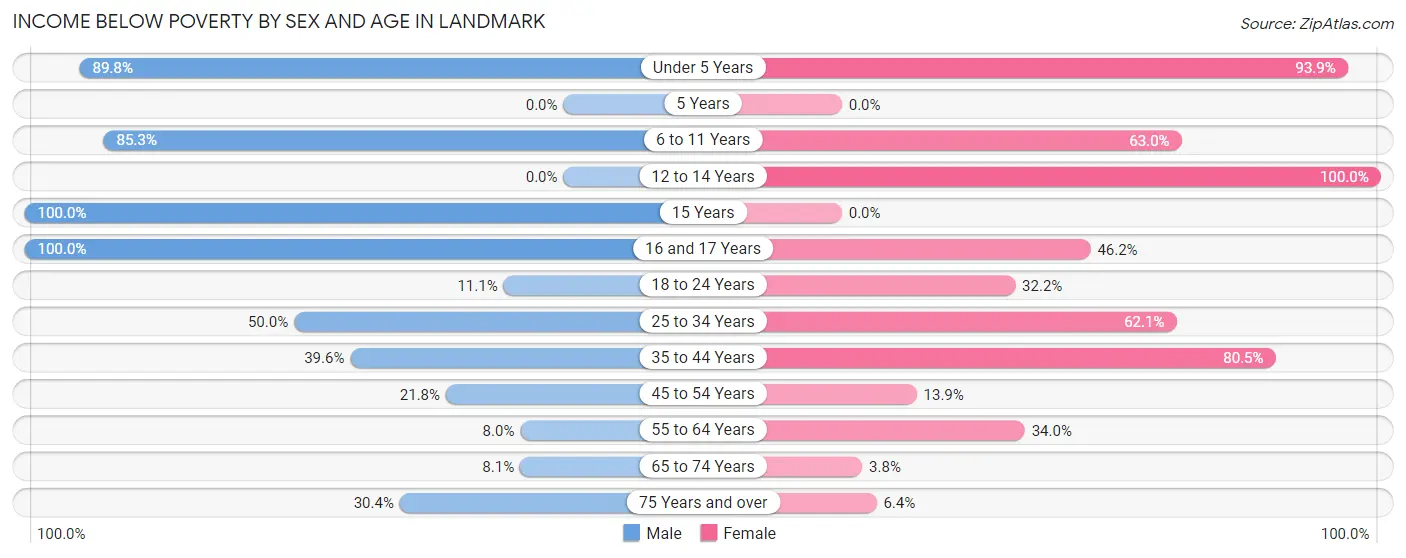
| Age Bracket | Male | Female |
| Under 5 Years | 264 (89.8%) | 153 (93.9%) |
| 5 Years | 0 (0.0%) | 0 (0.0%) |
| 6 to 11 Years | 163 (85.3%) | 29 (63.0%) |
| 12 to 14 Years | 0 (0.0%) | 98 (100.0%) |
| 15 Years | 32 (100.0%) | 0 (0.0%) |
| 16 and 17 Years | 63 (100.0%) | 24 (46.2%) |
| 18 to 24 Years | 8 (11.1%) | 28 (32.2%) |
| 25 to 34 Years | 50 (50.0%) | 108 (62.1%) |
| 35 to 44 Years | 72 (39.6%) | 136 (80.5%) |
| 45 to 54 Years | 70 (21.8%) | 40 (13.9%) |
| 55 to 64 Years | 10 (8.0%) | 127 (34.0%) |
| 65 to 74 Years | 14 (8.1%) | 11 (3.8%) |
| 75 Years and over | 41 (30.4%) | 9 (6.4%) |
| Total | 787 (46.3%) | 763 (40.0%) |
Income Above Poverty by Sex and Age in Landmark
According to the poverty statistics in Landmark, males aged 12 to 14 years and females aged 15 years are the age groups that are most secure financially, with 100.0% of males and 100.0% of females in these age groups living above the poverty line.
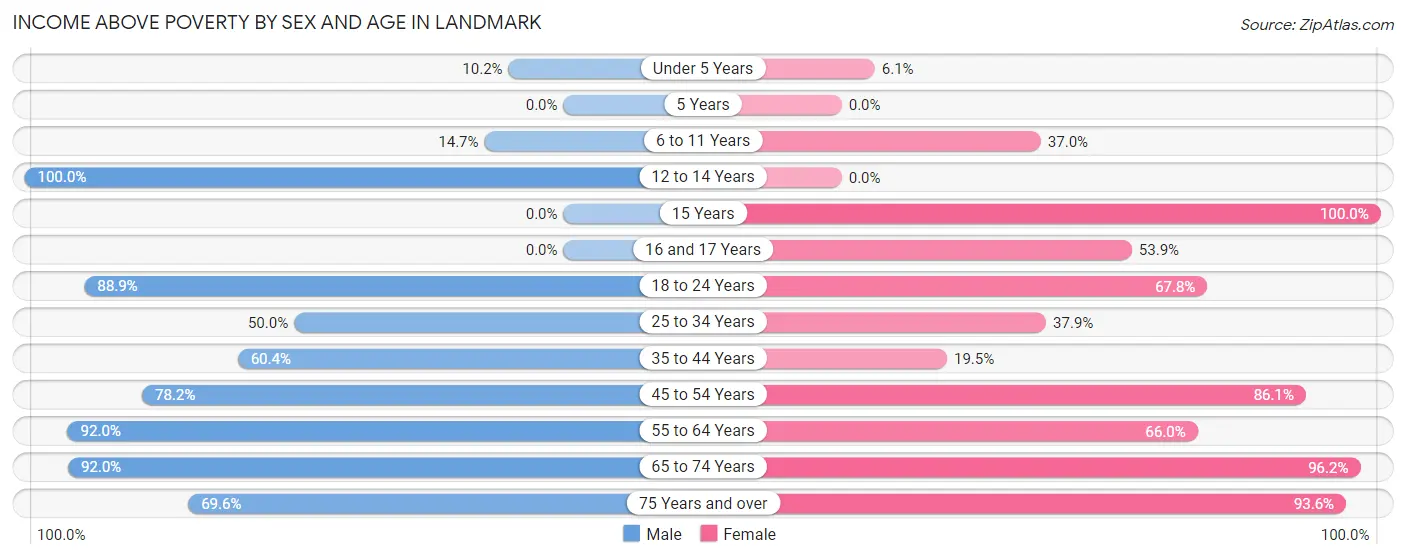
| Age Bracket | Male | Female |
| Under 5 Years | 30 (10.2%) | 10 (6.1%) |
| 5 Years | 0 (0.0%) | 0 (0.0%) |
| 6 to 11 Years | 28 (14.7%) | 17 (37.0%) |
| 12 to 14 Years | 12 (100.0%) | 0 (0.0%) |
| 15 Years | 0 (0.0%) | 28 (100.0%) |
| 16 and 17 Years | 0 (0.0%) | 28 (53.8%) |
| 18 to 24 Years | 64 (88.9%) | 59 (67.8%) |
| 25 to 34 Years | 50 (50.0%) | 66 (37.9%) |
| 35 to 44 Years | 110 (60.4%) | 33 (19.5%) |
| 45 to 54 Years | 251 (78.2%) | 248 (86.1%) |
| 55 to 64 Years | 115 (92.0%) | 247 (66.0%) |
| 65 to 74 Years | 160 (91.9%) | 280 (96.2%) |
| 75 Years and over | 94 (69.6%) | 131 (93.6%) |
| Total | 914 (53.7%) | 1,147 (60.1%) |
Income Below Poverty Among Married-Couple Families in Landmark
The poverty statistics for married-couple families in Landmark show that 27.0% or 181 of the total 670 families live below the poverty line. Families with 3 or 4 children have the highest poverty rate of 100.0%, comprising of 113 families. On the other hand, families with no children have the lowest poverty rate of 0.0%, which includes 0 families.
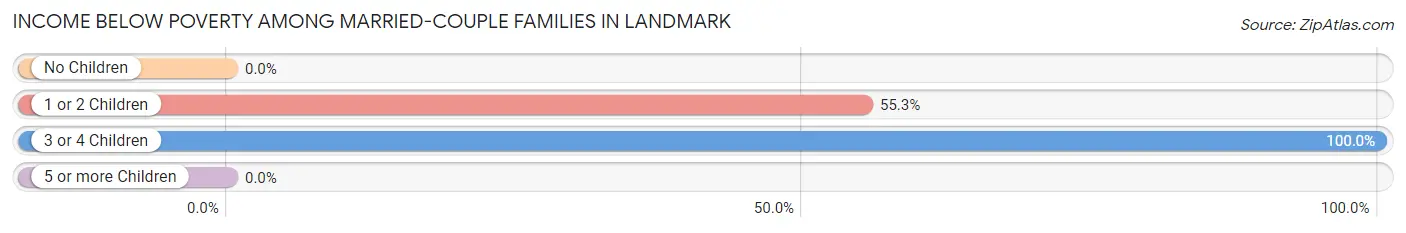
| Children | Above Poverty | Below Poverty |
| No Children | 434 (100.0%) | 0 (0.0%) |
| 1 or 2 Children | 55 (44.7%) | 68 (55.3%) |
| 3 or 4 Children | 0 (0.0%) | 113 (100.0%) |
| 5 or more Children | 0 (0.0%) | 0 (0.0%) |
| Total | 489 (73.0%) | 181 (27.0%) |
Income Below Poverty Among Single-Parent Households in Landmark
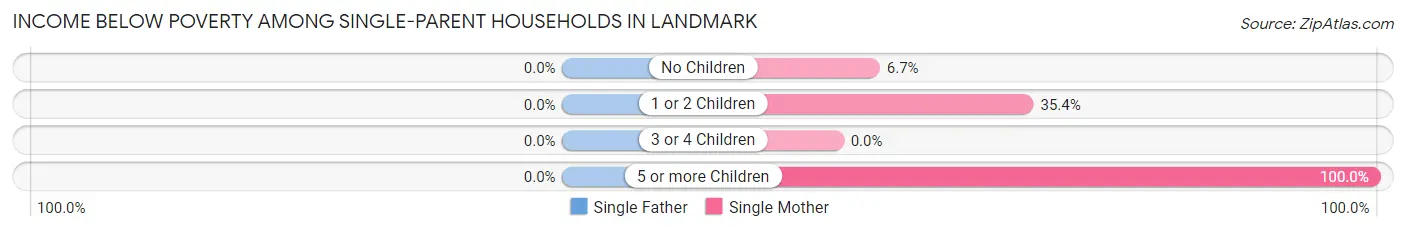
| Children | Single Father | Single Mother |
| No Children | 0 (0.0%) | 6 (6.7%) |
| 1 or 2 Children | 0 (0.0%) | 29 (35.4%) |
| 3 or 4 Children | 0 (0.0%) | 0 (0.0%) |
| 5 or more Children | 0 (0.0%) | 24 (100.0%) |
| Total | 0 (0.0%) | 59 (30.3%) |
Income Below Poverty Among Married-Couple vs Single-Parent Households in Landmark
The poverty data for Landmark shows that 181 of the married-couple family households (27.0%) and 59 of the single-parent households (27.1%) are living below the poverty level. Within the married-couple family households, those with 3 or 4 children have the highest poverty rate, with 113 households (100.0%) falling below the poverty line. Among the single-parent households, those with 5 or more children have the highest poverty rate, with 24 household (100.0%) living below poverty.
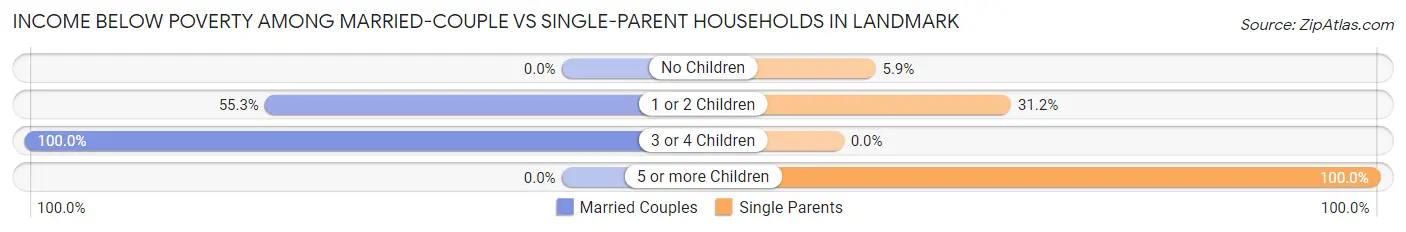
| Children | Married-Couple Families | Single-Parent Households |
| No Children | 0 (0.0%) | 6 (5.9%) |
| 1 or 2 Children | 68 (55.3%) | 29 (31.2%) |
| 3 or 4 Children | 113 (100.0%) | 0 (0.0%) |
| 5 or more Children | 0 (0.0%) | 24 (100.0%) |
| Total | 181 (27.0%) | 59 (27.1%) |
Race in Landmark
The most populous races in Landmark are White / Caucasian (2,631 | 72.7%), Black / African American (604 | 16.7%), and Hispanic or Latino (236 | 6.5%).
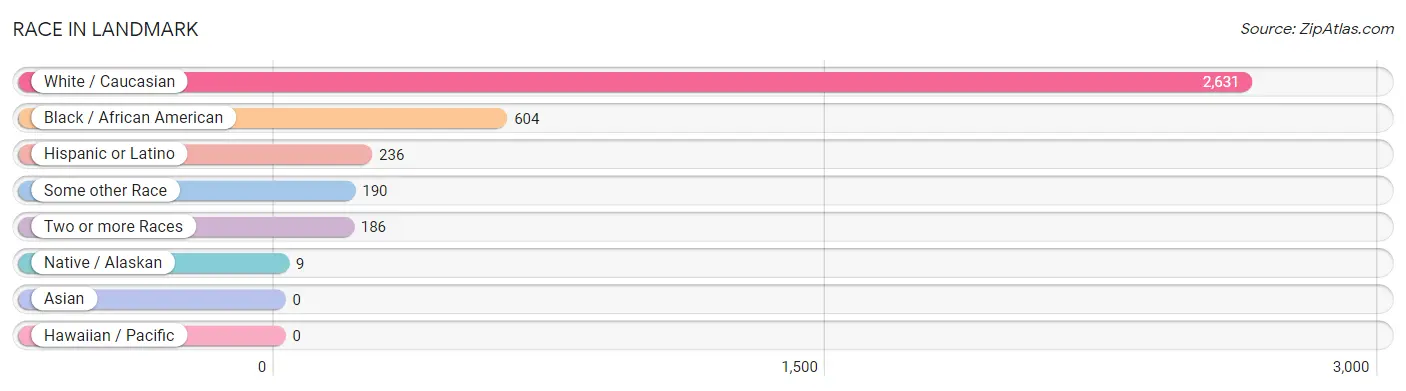
| Race | # Population | % Population |
| Asian | 0 | 0.0% |
| Black / African American | 604 | 16.7% |
| Hawaiian / Pacific | 0 | 0.0% |
| Hispanic or Latino | 236 | 6.5% |
| Native / Alaskan | 9 | 0.3% |
| White / Caucasian | 2,631 | 72.7% |
| Two or more Races | 186 | 5.1% |
| Some other Race | 190 | 5.2% |
| Total | 3,620 | 100.0% |
Ancestry in Landmark
The most populous ancestries reported in Landmark are English (619 | 17.1%), Irish (380 | 10.5%), American (360 | 9.9%), Mexican (236 | 6.5%), and German (167 | 4.6%), together accounting for 48.7% of all Landmark residents.
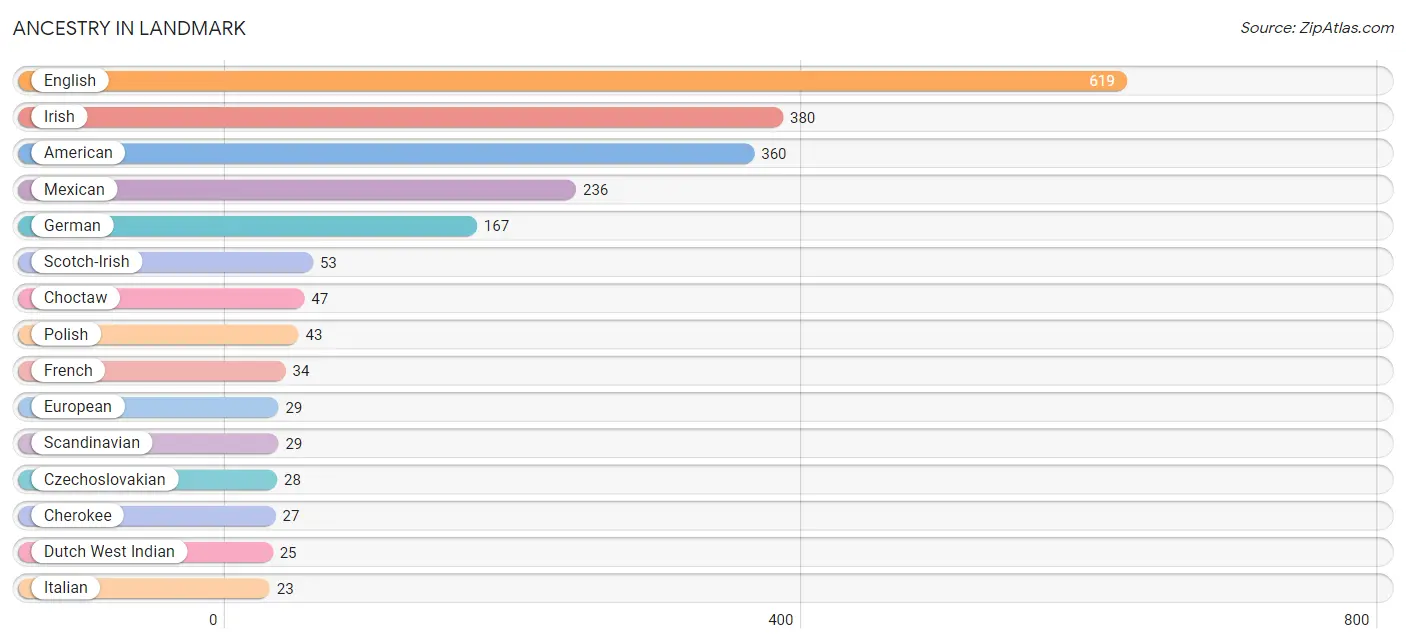
| Ancestry | # Population | % Population |
| American | 360 | 9.9% |
| Cherokee | 27 | 0.7% |
| Choctaw | 47 | 1.3% |
| Czech | 8 | 0.2% |
| Czechoslovakian | 28 | 0.8% |
| Dutch | 19 | 0.5% |
| Dutch West Indian | 25 | 0.7% |
| Eastern European | 7 | 0.2% |
| English | 619 | 17.1% |
| European | 29 | 0.8% |
| French | 34 | 0.9% |
| German | 167 | 4.6% |
| Irish | 380 | 10.5% |
| Italian | 23 | 0.6% |
| Jamaican | 23 | 0.6% |
| Lithuanian | 8 | 0.2% |
| Mexican | 236 | 6.5% |
| Polish | 43 | 1.2% |
| Scandinavian | 29 | 0.8% |
| Scotch-Irish | 53 | 1.5% |
| Scottish | 16 | 0.4% |
| Welsh | 7 | 0.2% | View All 22 Rows |
Immigrants in Landmark
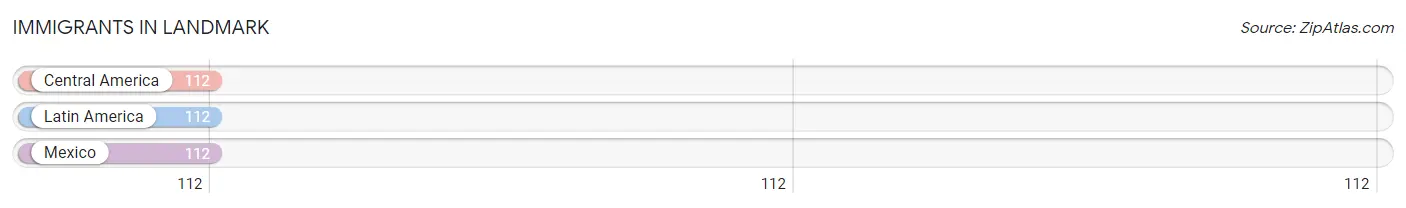
The most numerous immigrant groups reported in Landmark came from Central America (112 | 3.1%), Latin America (112 | 3.1%), and Mexico (112 | 3.1%), together accounting for 9.3% of all Landmark residents.
| Immigration Origin | # Population | % Population |
| Central America | 112 | 3.1% |
| Latin America | 112 | 3.1% |
| Mexico | 112 | 3.1% | View All 3 Rows |
Sex and Age in Landmark
Sex and Age in Landmark
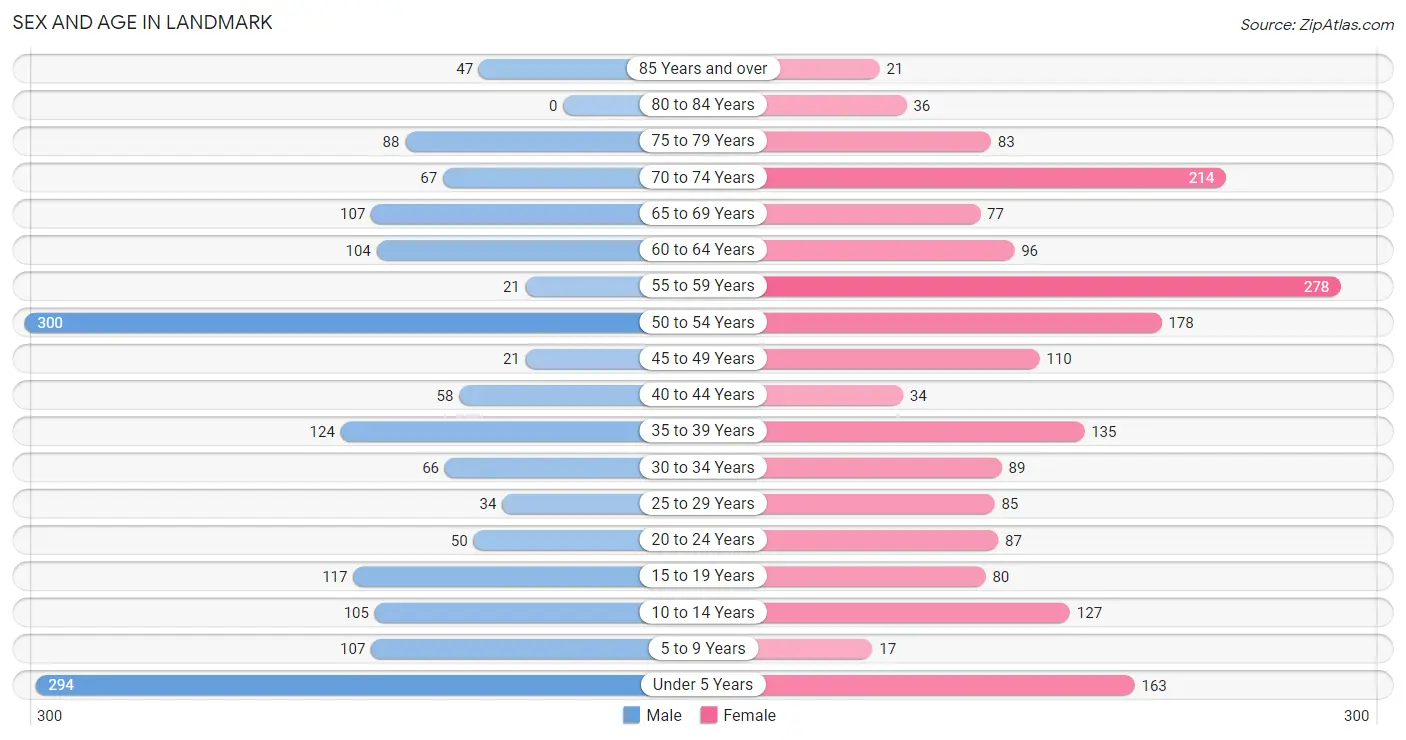
The most populous age groups in Landmark are 50 to 54 Years (300 | 17.5%) for men and 55 to 59 Years (278 | 14.5%) for women.
| Age Bracket | Male | Female |
| Under 5 Years | 294 (17.2%) | 163 (8.5%) |
| 5 to 9 Years | 107 (6.3%) | 17 (0.9%) |
| 10 to 14 Years | 105 (6.1%) | 127 (6.7%) |
| 15 to 19 Years | 117 (6.8%) | 80 (4.2%) |
| 20 to 24 Years | 50 (2.9%) | 87 (4.5%) |
| 25 to 29 Years | 34 (2.0%) | 85 (4.4%) |
| 30 to 34 Years | 66 (3.9%) | 89 (4.7%) |
| 35 to 39 Years | 124 (7.2%) | 135 (7.1%) |
| 40 to 44 Years | 58 (3.4%) | 34 (1.8%) |
| 45 to 49 Years | 21 (1.2%) | 110 (5.8%) |
| 50 to 54 Years | 300 (17.5%) | 178 (9.3%) |
| 55 to 59 Years | 21 (1.2%) | 278 (14.5%) |
| 60 to 64 Years | 104 (6.1%) | 96 (5.0%) |
| 65 to 69 Years | 107 (6.3%) | 77 (4.0%) |
| 70 to 74 Years | 67 (3.9%) | 214 (11.2%) |
| 75 to 79 Years | 88 (5.1%) | 83 (4.3%) |
| 80 to 84 Years | 0 (0.0%) | 36 (1.9%) |
| 85 Years and over | 47 (2.8%) | 21 (1.1%) |
| Total | 1,710 (100.0%) | 1,910 (100.0%) |
Families and Households in Landmark
Median Family Size in Landmark
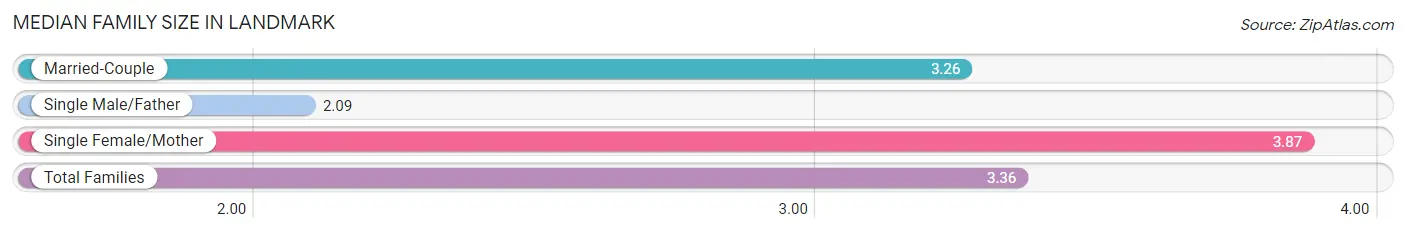
The median family size in Landmark is 3.36 persons per family, with single female/mother families (195 | 22.0%) accounting for the largest median family size of 3.87 persons per family. On the other hand, single male/father families (23 | 2.6%) represent the smallest median family size with 2.09 persons per family.
| Family Type | # Families | Family Size |
| Married-Couple | 670 (75.4%) | 3.26 |
| Single Male/Father | 23 (2.6%) | 2.09 |
| Single Female/Mother | 195 (22.0%) | 3.87 |
| Total Families | 888 (100.0%) | 3.36 |
Median Household Size in Landmark
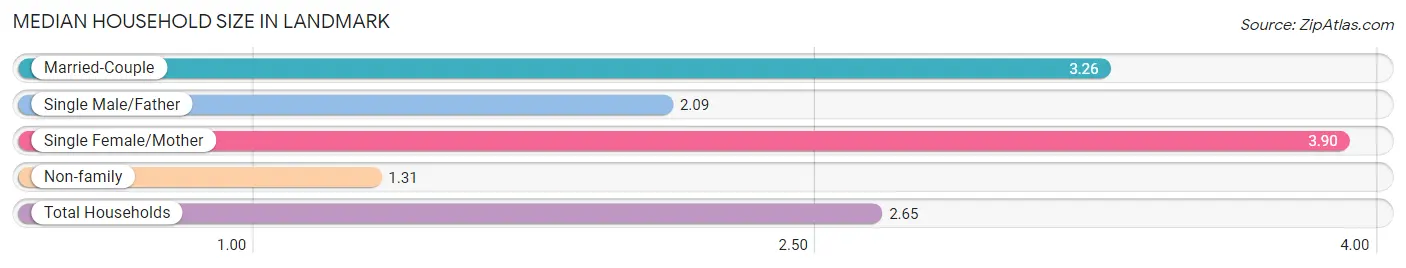
The median household size in Landmark is 2.65 persons per household, with single female/mother households (195 | 14.3%) accounting for the largest median household size of 3.9 persons per household. non-family households (476 | 34.9%) represent the smallest median household size with 1.31 persons per household.
| Household Type | # Households | Household Size |
| Married-Couple | 670 (49.1%) | 3.26 |
| Single Male/Father | 23 (1.7%) | 2.09 |
| Single Female/Mother | 195 (14.3%) | 3.90 |
| Non-family | 476 (34.9%) | 1.31 |
| Total Households | 1,364 (100.0%) | 2.65 |
Household Size by Marriage Status in Landmark
Out of a total of 1,364 households in Landmark, 888 (65.1%) are family households, while 476 (34.9%) are nonfamily households. The most numerous type of family households are 2-person households, comprising 422, and the most common type of nonfamily households are 1-person households, comprising 402.
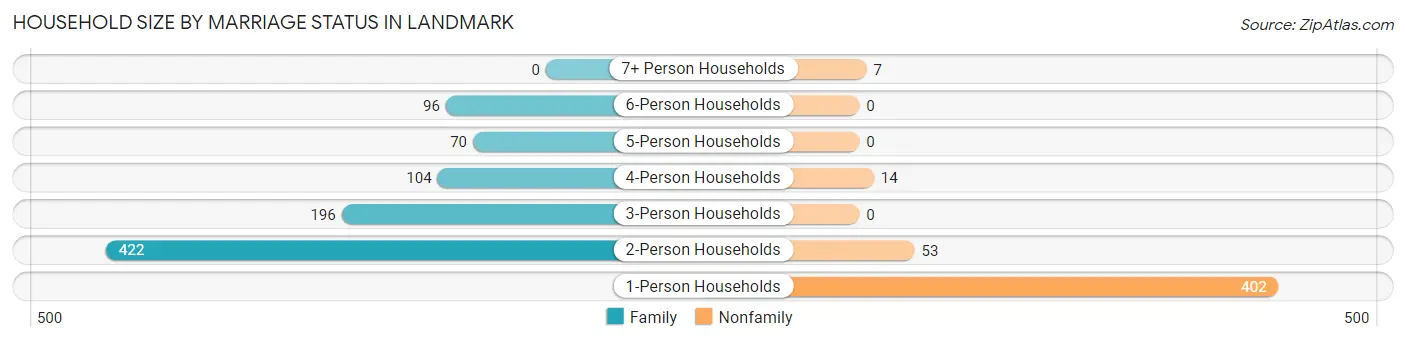
| Household Size | Family Households | Nonfamily Households |
| 1-Person Households | - | 402 (29.5%) |
| 2-Person Households | 422 (30.9%) | 53 (3.9%) |
| 3-Person Households | 196 (14.4%) | 0 (0.0%) |
| 4-Person Households | 104 (7.6%) | 14 (1.0%) |
| 5-Person Households | 70 (5.1%) | 0 (0.0%) |
| 6-Person Households | 96 (7.0%) | 0 (0.0%) |
| 7+ Person Households | 0 (0.0%) | 7 (0.5%) |
| Total | 888 (65.1%) | 476 (34.9%) |
Female Fertility in Landmark
Fertility by Age in Landmark
Average fertility rate in Landmark is 200.0 births per 1,000 women. Women in the age bracket of 35 to 50 years have the highest fertility rate with 251.0 births per 1,000 women. Women in the age bracket of 35 to 50 years acount for 56.5% of all women with births.
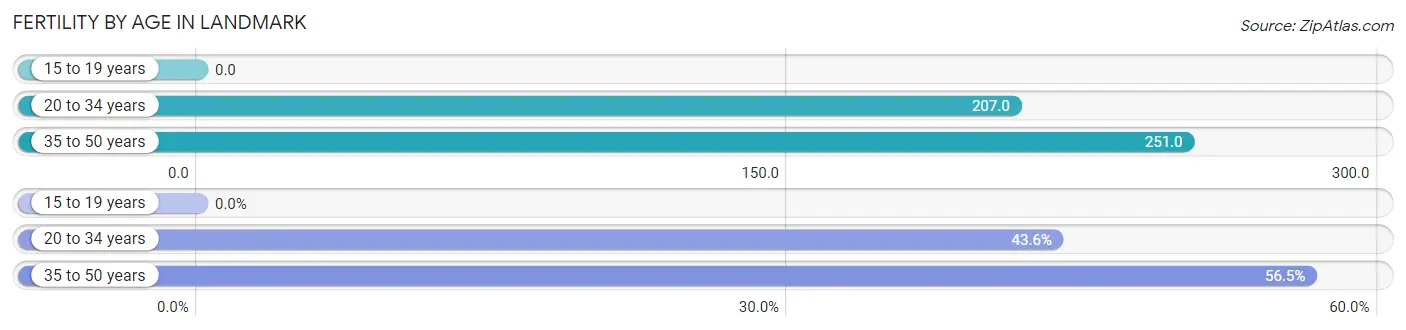
| Age Bracket | Women with Births | Births / 1,000 Women |
| 15 to 19 years | 0 (0.0%) | 0.0 |
| 20 to 34 years | 54 (43.5%) | 207.0 |
| 35 to 50 years | 70 (56.5%) | 251.0 |
| Total | 124 (100.0%) | 200.0 |
Fertility by Age by Marriage Status in Landmark
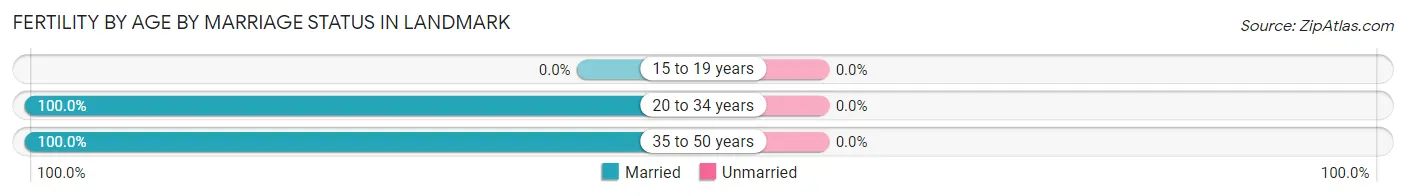
| Age Bracket | Married | Unmarried |
| 15 to 19 years | 0 (0.0%) | 0 (0.0%) |
| 20 to 34 years | 54 (100.0%) | 0 (0.0%) |
| 35 to 50 years | 70 (100.0%) | 0 (0.0%) |
| Total | 124 (100.0%) | 0 (0.0%) |
Fertility by Education in Landmark
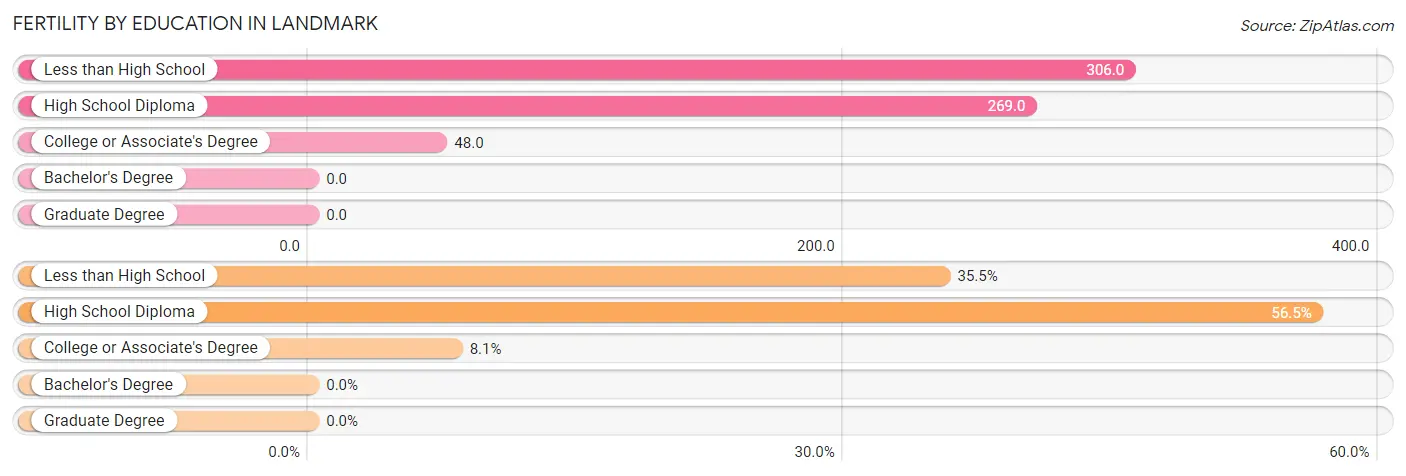
| Educational Attainment | Women with Births | Births / 1,000 Women |
| Less than High School | 44 (35.5%) | 306.0 |
| High School Diploma | 70 (56.5%) | 269.0 |
| College or Associate's Degree | 10 (8.1%) | 48.0 |
| Bachelor's Degree | 0 (0.0%) | 0.0 |
| Graduate Degree | 0 (0.0%) | 0.0 |
| Total | 124 (100.0%) | 200.0 |
Fertility by Education by Marriage Status in Landmark
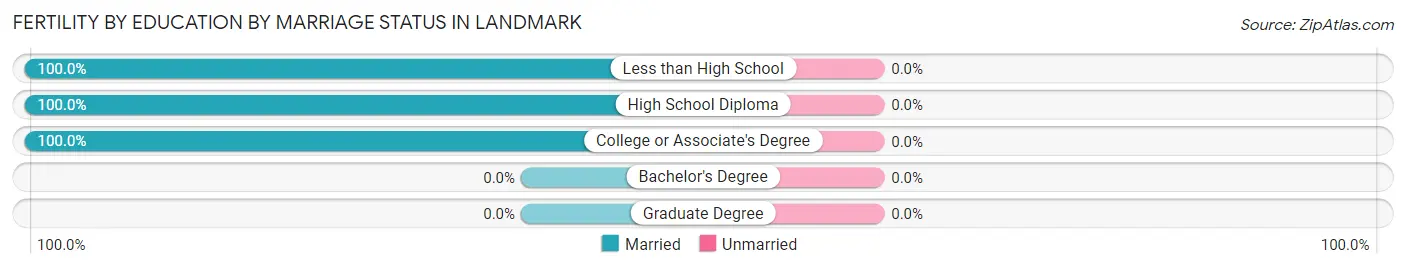
| Educational Attainment | Married | Unmarried |
| Less than High School | 44 (100.0%) | 0 (0.0%) |
| High School Diploma | 70 (100.0%) | 0 (0.0%) |
| College or Associate's Degree | 10 (100.0%) | 0 (0.0%) |
| Bachelor's Degree | 0 (0.0%) | 0 (0.0%) |
| Graduate Degree | 0 (0.0%) | 0 (0.0%) |
| Total | 124 (100.0%) | 0 (0.0%) |
Employment Characteristics in Landmark
Employment by Class of Employer in Landmark
Among the 1,354 employed individuals in Landmark, private company employees (1,055 | 77.9%), state government employees (100 | 7.4%), and self-employed (not incorporated) (51 | 3.8%) make up the most common classes of employment.
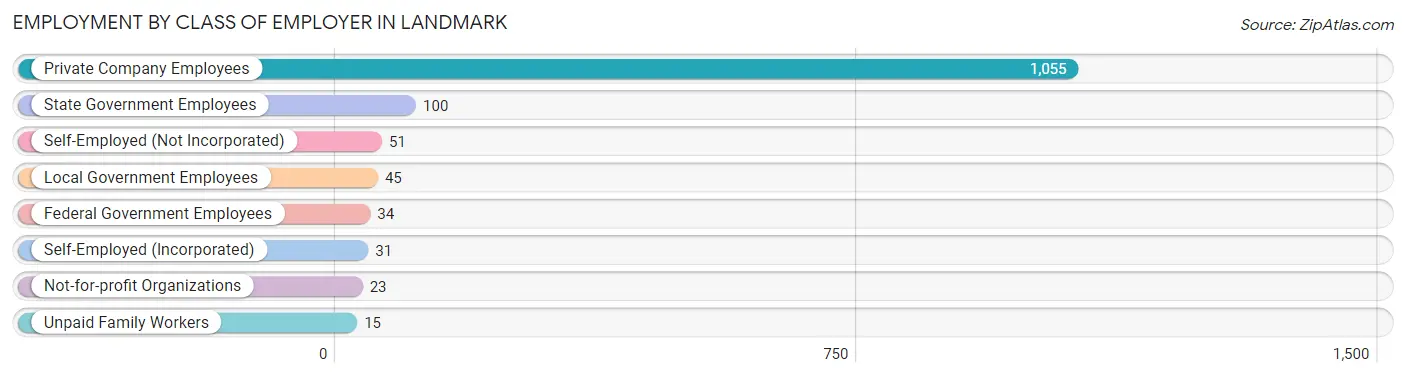
| Employer Class | # Employees | % Employees |
| Private Company Employees | 1,055 | 77.9% |
| Self-Employed (Incorporated) | 31 | 2.3% |
| Self-Employed (Not Incorporated) | 51 | 3.8% |
| Not-for-profit Organizations | 23 | 1.7% |
| Local Government Employees | 45 | 3.3% |
| State Government Employees | 100 | 7.4% |
| Federal Government Employees | 34 | 2.5% |
| Unpaid Family Workers | 15 | 1.1% |
| Total | 1,354 | 100.0% |
Employment Status by Age in Landmark
According to the labor force statistics for Landmark, out of the total population over 16 years of age (2,747), 52.8% or 1,450 individuals are in the labor force, with 4.5% or 65 of them unemployed. The age group with the highest labor force participation rate is 20 to 24 years, with 94.2% or 129 individuals in the labor force. Within the labor force, the 16 to 19 years age range has the highest percentage of unemployed individuals, with 61.1% or 22 of them being unemployed.
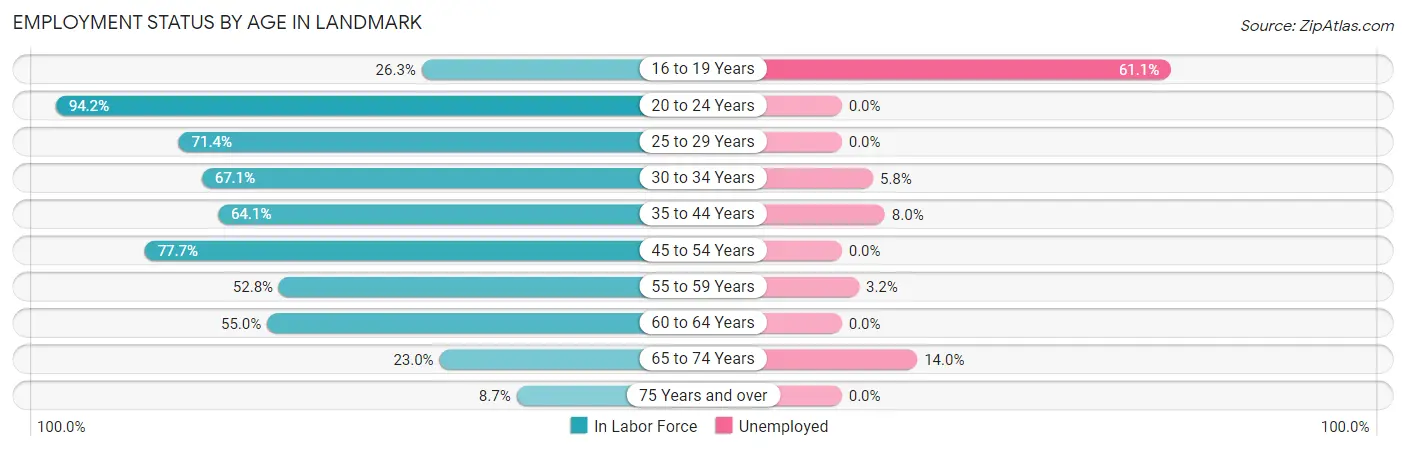
| Age Bracket | In Labor Force | Unemployed |
| 16 to 19 Years | 36 (26.3%) | 22 (61.1%) |
| 20 to 24 Years | 129 (94.2%) | 0 (0.0%) |
| 25 to 29 Years | 85 (71.4%) | 0 (0.0%) |
| 30 to 34 Years | 104 (67.1%) | 6 (5.8%) |
| 35 to 44 Years | 225 (64.1%) | 18 (8.0%) |
| 45 to 54 Years | 473 (77.7%) | 0 (0.0%) |
| 55 to 59 Years | 158 (52.8%) | 5 (3.2%) |
| 60 to 64 Years | 110 (55.0%) | 0 (0.0%) |
| 65 to 74 Years | 107 (23.0%) | 15 (14.0%) |
| 75 Years and over | 24 (8.7%) | 0 (0.0%) |
| Total | 1,450 (52.8%) | 65 (4.5%) |
Employment Status by Educational Attainment in Landmark
According to labor force statistics for Landmark, 66.6% of individuals (1,154) out of the total population between 25 and 64 years of age (1,733) are in the labor force, with 2.5% or 29 of them being unemployed. The group with the highest labor force participation rate are those with the educational attainment of bachelor's degree or higher, with 96.7% or 208 individuals in the labor force. Within the labor force, individuals with high school diploma education have the highest percentage of unemployment, with 5.9% or 29 of them being unemployed.
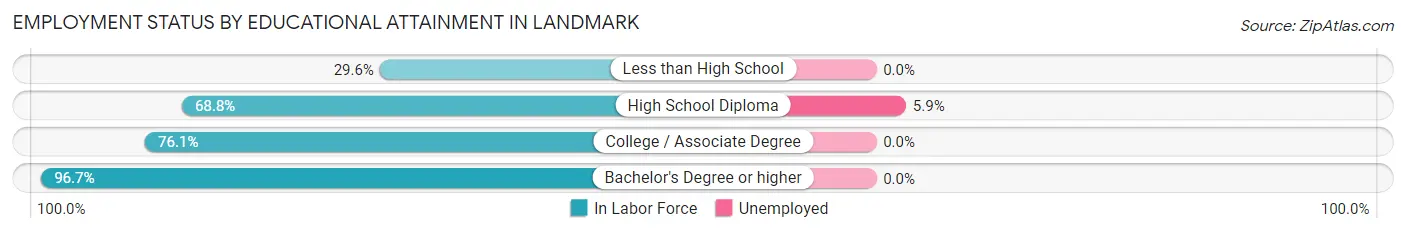
| Educational Attainment | In Labor Force | Unemployed |
| Less than High School | 99 (29.6%) | 0 (0.0%) |
| High School Diploma | 491 (68.8%) | 42 (5.9%) |
| College / Associate Degree | 357 (76.1%) | 0 (0.0%) |
| Bachelor's Degree or higher | 208 (96.7%) | 0 (0.0%) |
| Total | 1,154 (66.6%) | 43 (2.5%) |
Employment Occupations by Sex in Landmark
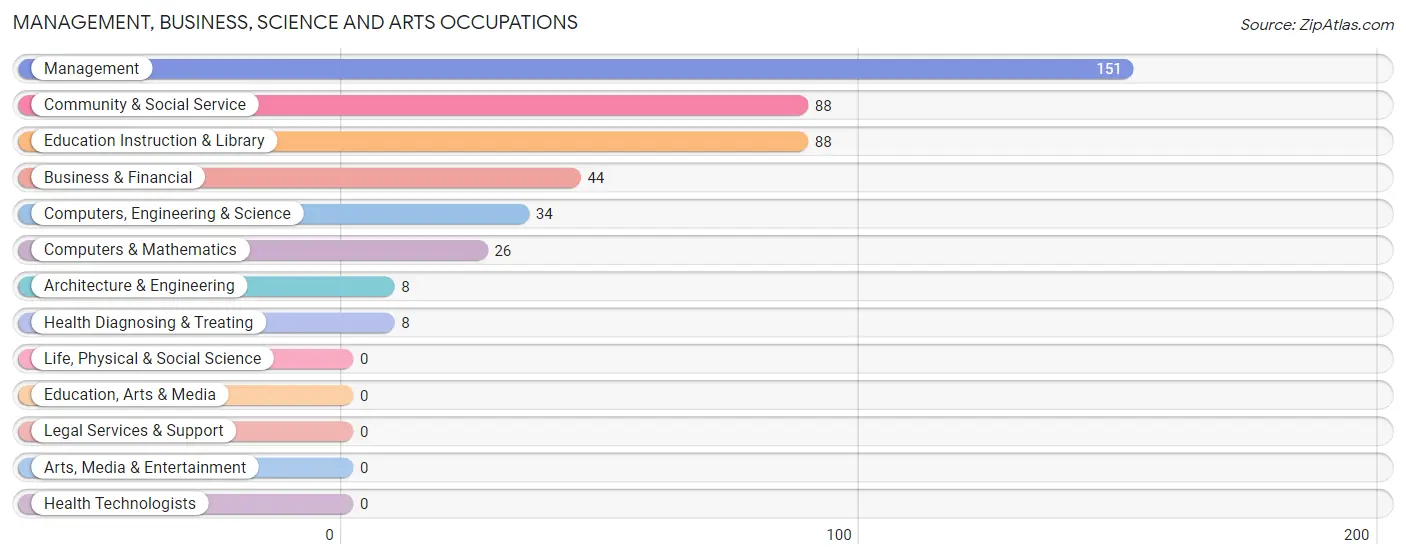
Management, Business, Science and Arts Occupations
The most common Management, Business, Science and Arts occupations in Landmark are Management (151 | 10.9%), Community & Social Service (88 | 6.4%), Education Instruction & Library (88 | 6.4%), Business & Financial (44 | 3.2%), and Computers, Engineering & Science (34 | 2.5%).
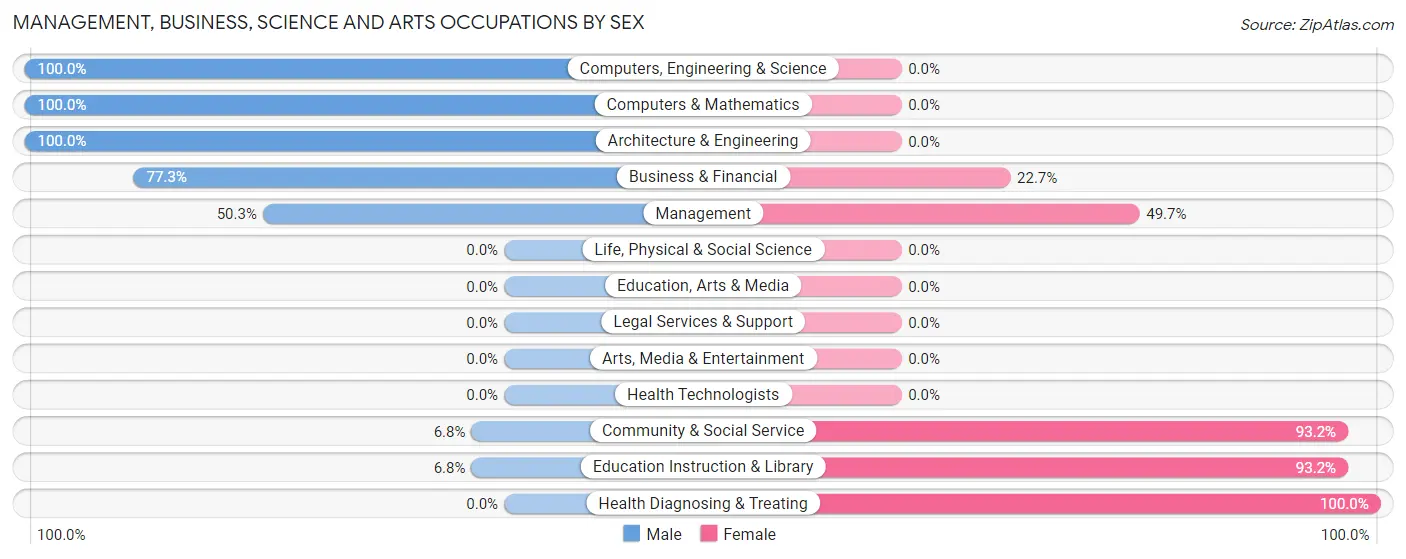
Management, Business, Science and Arts Occupations by Sex
Within the Management, Business, Science and Arts occupations in Landmark, the most male-oriented occupations are Computers, Engineering & Science (100.0%), Computers & Mathematics (100.0%), and Architecture & Engineering (100.0%), while the most female-oriented occupations are Health Diagnosing & Treating (100.0%), Community & Social Service (93.2%), and Education Instruction & Library (93.2%).
| Occupation | Male | Female |
| Management | 76 (50.3%) | 75 (49.7%) |
| Business & Financial | 34 (77.3%) | 10 (22.7%) |
| Computers, Engineering & Science | 34 (100.0%) | 0 (0.0%) |
| Computers & Mathematics | 26 (100.0%) | 0 (0.0%) |
| Architecture & Engineering | 8 (100.0%) | 0 (0.0%) |
| Life, Physical & Social Science | 0 (0.0%) | 0 (0.0%) |
| Community & Social Service | 6 (6.8%) | 82 (93.2%) |
| Education, Arts & Media | 0 (0.0%) | 0 (0.0%) |
| Legal Services & Support | 0 (0.0%) | 0 (0.0%) |
| Education Instruction & Library | 6 (6.8%) | 82 (93.2%) |
| Arts, Media & Entertainment | 0 (0.0%) | 0 (0.0%) |
| Health Diagnosing & Treating | 0 (0.0%) | 8 (100.0%) |
| Health Technologists | 0 (0.0%) | 0 (0.0%) |
| Total (Category) | 150 (46.2%) | 175 (53.8%) |
| Total (Overall) | 695 (50.2%) | 690 (49.8%) |
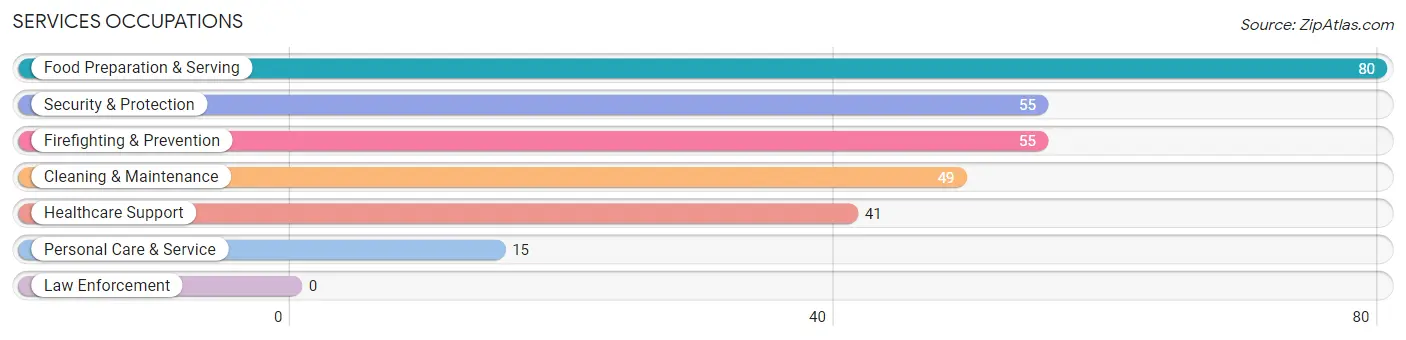
Services Occupations
The most common Services occupations in Landmark are Food Preparation & Serving (80 | 5.8%), Security & Protection (55 | 4.0%), Firefighting & Prevention (55 | 4.0%), Cleaning & Maintenance (49 | 3.5%), and Healthcare Support (41 | 3.0%).
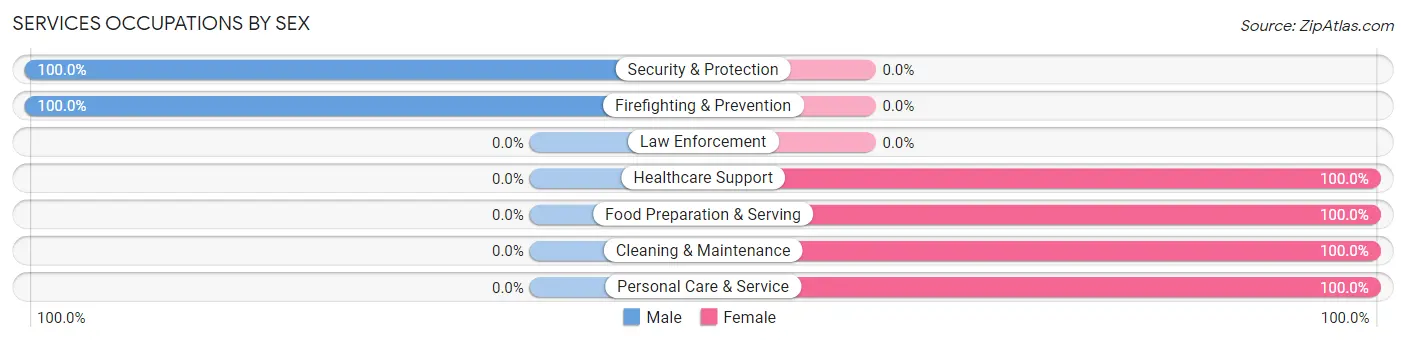
Services Occupations by Sex
Within the Services occupations in Landmark, the most male-oriented occupations are Security & Protection (100.0%), and Firefighting & Prevention (100.0%), while the most female-oriented occupations are Healthcare Support (100.0%), Food Preparation & Serving (100.0%), and Cleaning & Maintenance (100.0%).
| Occupation | Male | Female |
| Healthcare Support | 0 (0.0%) | 41 (100.0%) |
| Security & Protection | 55 (100.0%) | 0 (0.0%) |
| Firefighting & Prevention | 55 (100.0%) | 0 (0.0%) |
| Law Enforcement | 0 (0.0%) | 0 (0.0%) |
| Food Preparation & Serving | 0 (0.0%) | 80 (100.0%) |
| Cleaning & Maintenance | 0 (0.0%) | 49 (100.0%) |
| Personal Care & Service | 0 (0.0%) | 15 (100.0%) |
| Total (Category) | 55 (22.9%) | 185 (77.1%) |
| Total (Overall) | 695 (50.2%) | 690 (49.8%) |
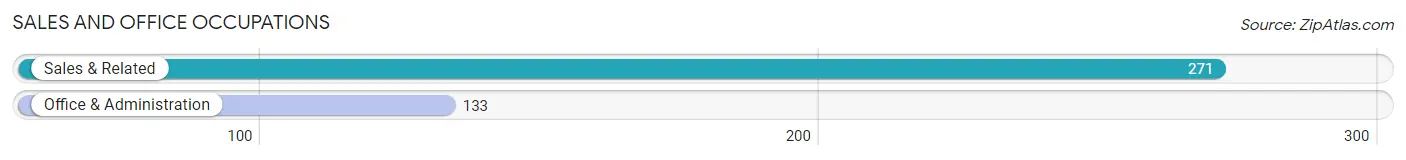
Sales and Office Occupations
The most common Sales and Office occupations in Landmark are Sales & Related (271 | 19.6%), and Office & Administration (133 | 9.6%).
Sales and Office Occupations by Sex
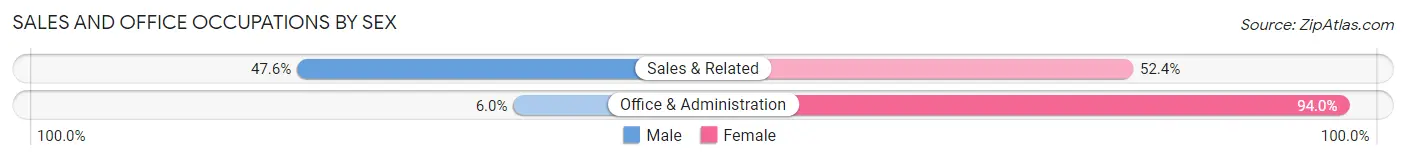
| Occupation | Male | Female |
| Sales & Related | 129 (47.6%) | 142 (52.4%) |
| Office & Administration | 8 (6.0%) | 125 (94.0%) |
| Total (Category) | 137 (33.9%) | 267 (66.1%) |
| Total (Overall) | 695 (50.2%) | 690 (49.8%) |
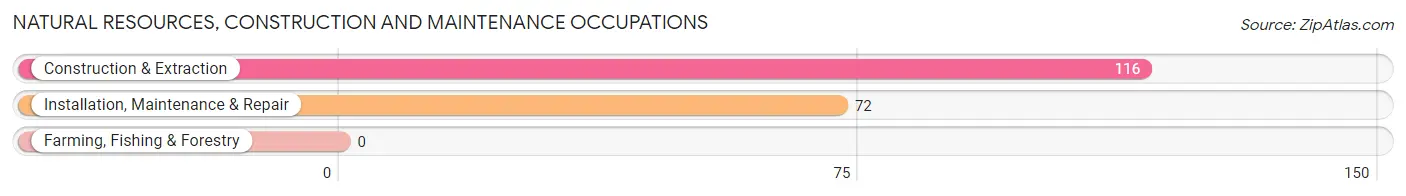
Natural Resources, Construction and Maintenance Occupations
The most common Natural Resources, Construction and Maintenance occupations in Landmark are Construction & Extraction (116 | 8.4%), and Installation, Maintenance & Repair (72 | 5.2%).
Natural Resources, Construction and Maintenance Occupations by Sex
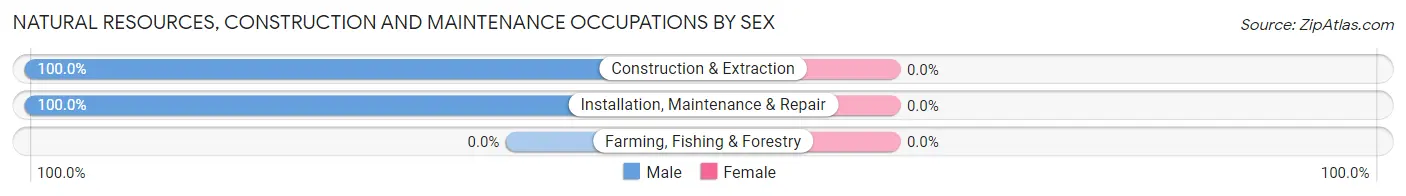
| Occupation | Male | Female |
| Farming, Fishing & Forestry | 0 (0.0%) | 0 (0.0%) |
| Construction & Extraction | 116 (100.0%) | 0 (0.0%) |
| Installation, Maintenance & Repair | 72 (100.0%) | 0 (0.0%) |
| Total (Category) | 188 (100.0%) | 0 (0.0%) |
| Total (Overall) | 695 (50.2%) | 690 (49.8%) |
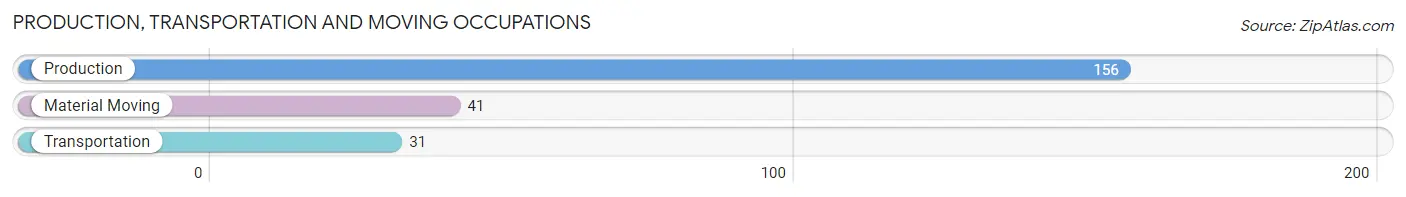
Production, Transportation and Moving Occupations
The most common Production, Transportation and Moving occupations in Landmark are Production (156 | 11.3%), Material Moving (41 | 3.0%), and Transportation (31 | 2.2%).
Production, Transportation and Moving Occupations by Sex
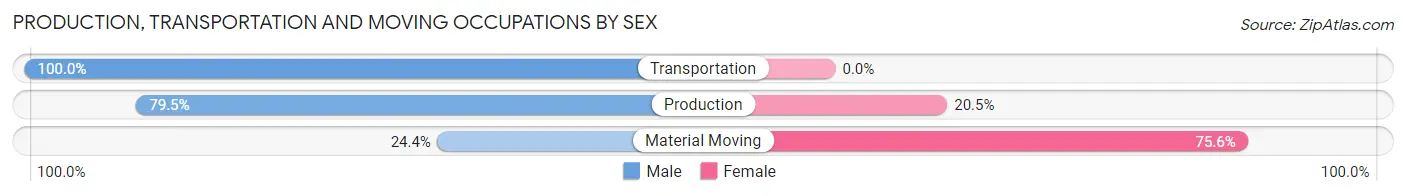
| Occupation | Male | Female |
| Production | 124 (79.5%) | 32 (20.5%) |
| Transportation | 31 (100.0%) | 0 (0.0%) |
| Material Moving | 10 (24.4%) | 31 (75.6%) |
| Total (Category) | 165 (72.4%) | 63 (27.6%) |
| Total (Overall) | 695 (50.2%) | 690 (49.8%) |
Employment Industries by Sex in Landmark
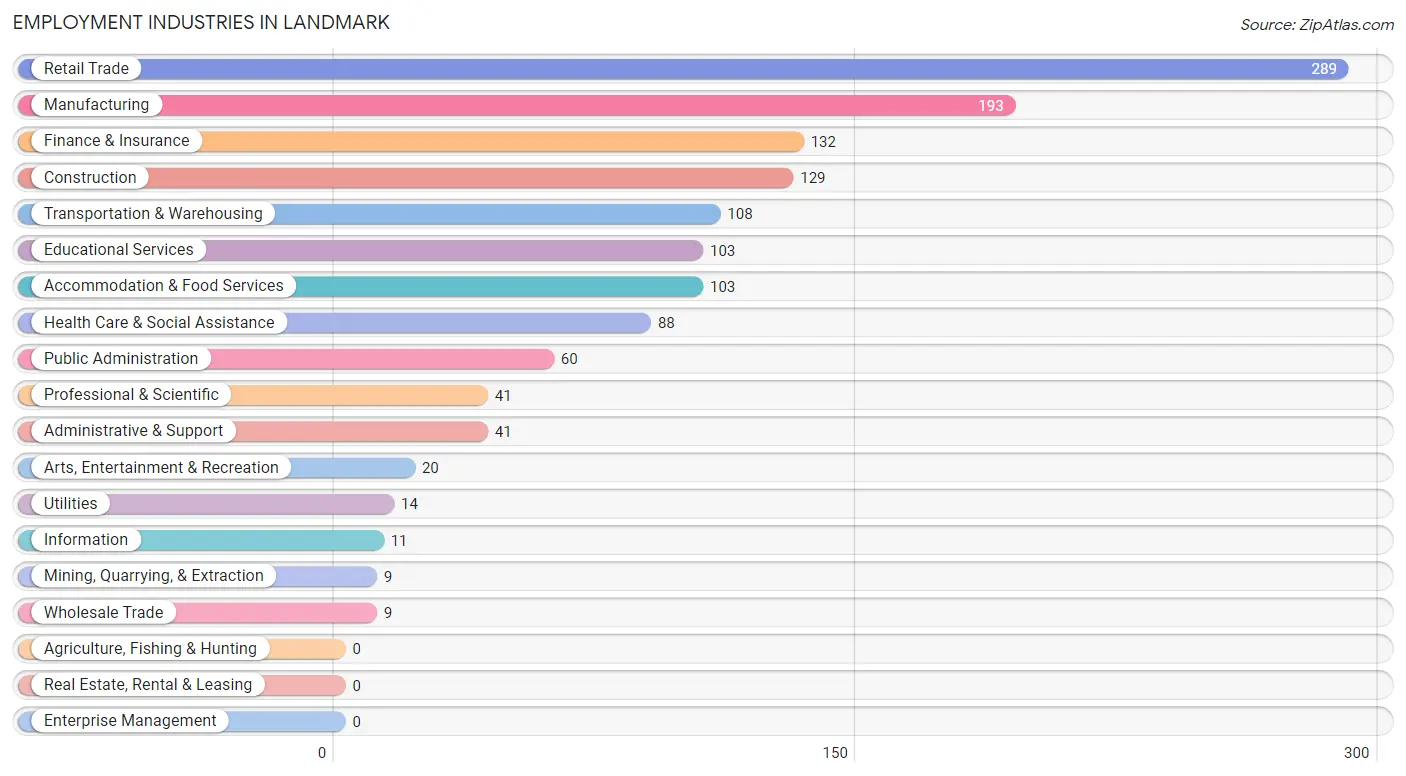
Employment Industries in Landmark
The major employment industries in Landmark include Retail Trade (289 | 20.9%), Manufacturing (193 | 13.9%), Finance & Insurance (132 | 9.5%), Construction (129 | 9.3%), and Transportation & Warehousing (108 | 7.8%).
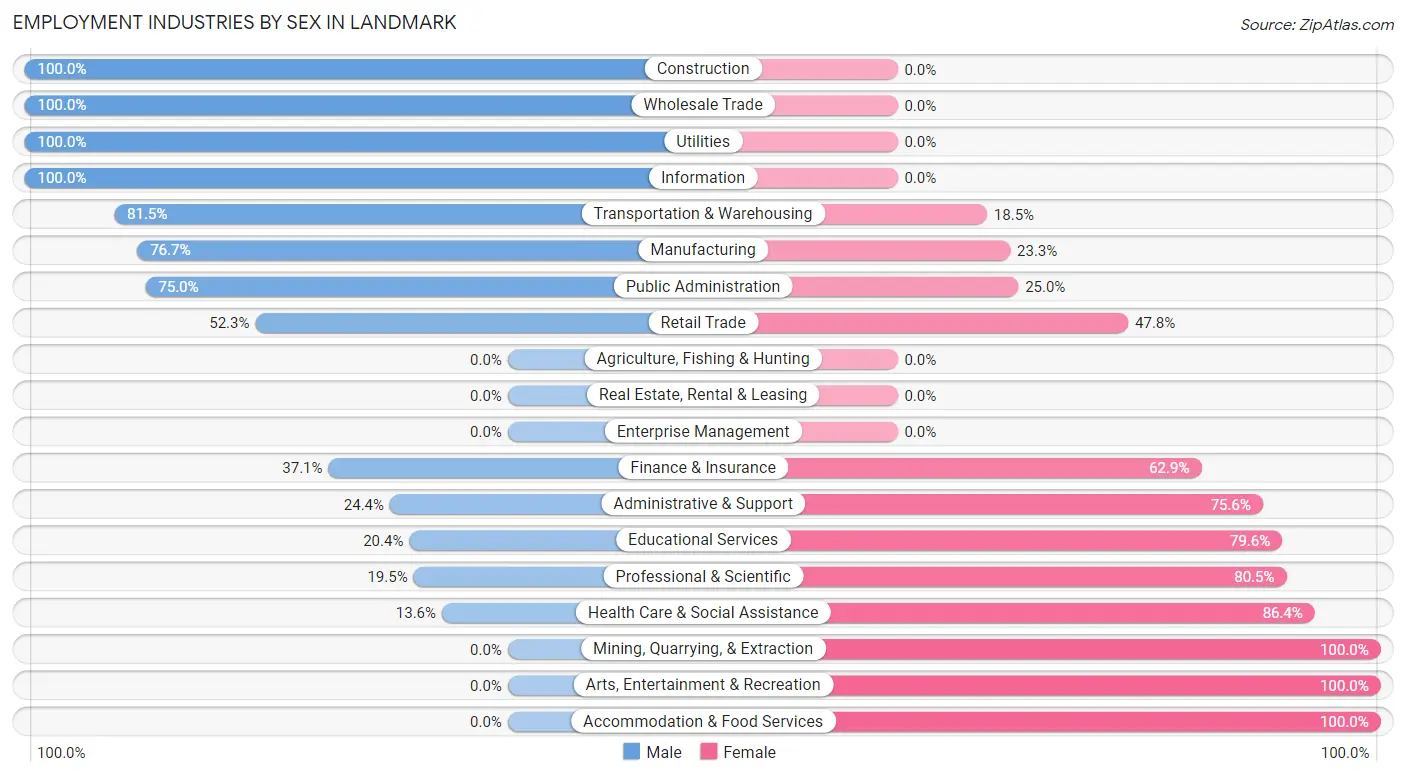
Employment Industries by Sex in Landmark
The Landmark industries that see more men than women are Construction (100.0%), Wholesale Trade (100.0%), and Utilities (100.0%), whereas the industries that tend to have a higher number of women are Mining, Quarrying, & Extraction (100.0%), Arts, Entertainment & Recreation (100.0%), and Accommodation & Food Services (100.0%).
| Industry | Male | Female |
| Agriculture, Fishing & Hunting | 0 (0.0%) | 0 (0.0%) |
| Mining, Quarrying, & Extraction | 0 (0.0%) | 9 (100.0%) |
| Construction | 129 (100.0%) | 0 (0.0%) |
| Manufacturing | 148 (76.7%) | 45 (23.3%) |
| Wholesale Trade | 9 (100.0%) | 0 (0.0%) |
| Retail Trade | 151 (52.2%) | 138 (47.7%) |
| Transportation & Warehousing | 88 (81.5%) | 20 (18.5%) |
| Utilities | 14 (100.0%) | 0 (0.0%) |
| Information | 11 (100.0%) | 0 (0.0%) |
| Finance & Insurance | 49 (37.1%) | 83 (62.9%) |
| Real Estate, Rental & Leasing | 0 (0.0%) | 0 (0.0%) |
| Professional & Scientific | 8 (19.5%) | 33 (80.5%) |
| Enterprise Management | 0 (0.0%) | 0 (0.0%) |
| Administrative & Support | 10 (24.4%) | 31 (75.6%) |
| Educational Services | 21 (20.4%) | 82 (79.6%) |
| Health Care & Social Assistance | 12 (13.6%) | 76 (86.4%) |
| Arts, Entertainment & Recreation | 0 (0.0%) | 20 (100.0%) |
| Accommodation & Food Services | 0 (0.0%) | 103 (100.0%) |
| Public Administration | 45 (75.0%) | 15 (25.0%) |
| Total | 695 (50.2%) | 690 (49.8%) |
Education in Landmark
School Enrollment in Landmark
The most common levels of schooling among the 600 students in Landmark are elementary school (237 | 39.5%), high school (162 | 27.0%), and middle school (123 | 20.5%).
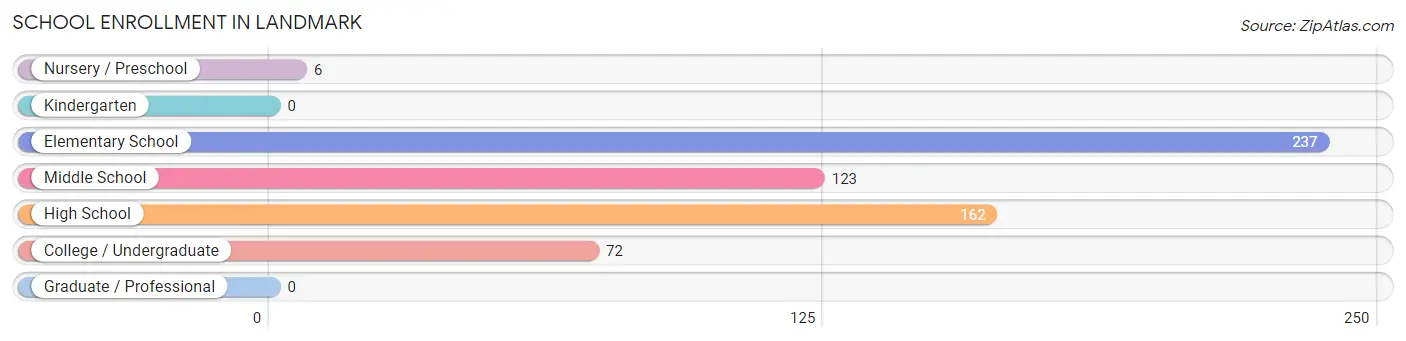
| School Level | # Students | % Students |
| Nursery / Preschool | 6 | 1.0% |
| Kindergarten | 0 | 0.0% |
| Elementary School | 237 | 39.5% |
| Middle School | 123 | 20.5% |
| High School | 162 | 27.0% |
| College / Undergraduate | 72 | 12.0% |
| Graduate / Professional | 0 | 0.0% |
| Total | 600 | 100.0% |
School Enrollment by Age by Funding Source in Landmark
Out of a total of 600 students who are enrolled in schools in Landmark, 195 (32.5%) attend a private institution, while the remaining 405 (67.5%) are enrolled in public schools. The age group of 10 to 14 year olds has the highest likelihood of being enrolled in private schools, with 170 (73.3% in the age bracket) enrolled. Conversely, the age group of 3 to 4 year olds has the lowest likelihood of being enrolled in a private school, with 6 (100.0% in the age bracket) attending a public institution.
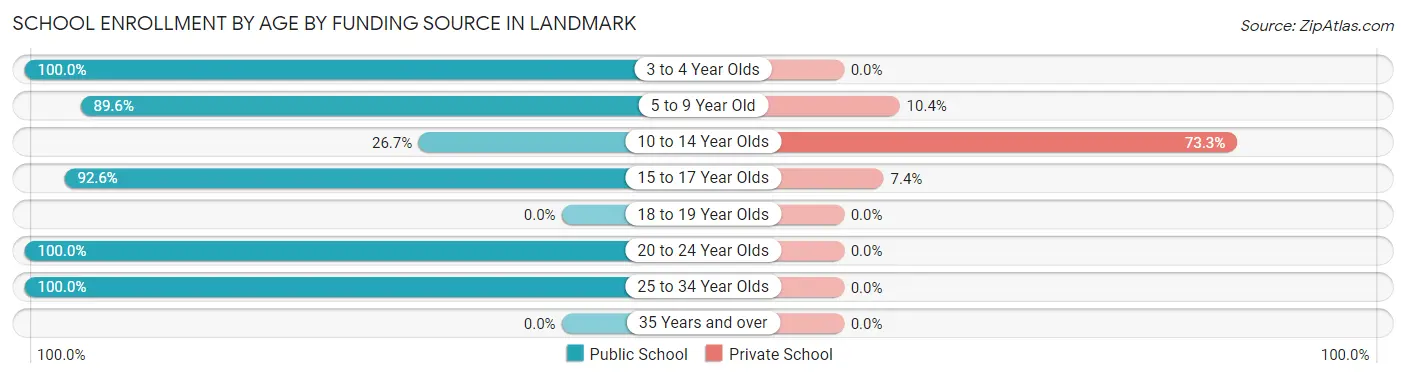
| Age Bracket | Public School | Private School |
| 3 to 4 Year Olds | 6 (100.0%) | 0 (0.0%) |
| 5 to 9 Year Old | 103 (89.6%) | 12 (10.4%) |
| 10 to 14 Year Olds | 62 (26.7%) | 170 (73.3%) |
| 15 to 17 Year Olds | 162 (92.6%) | 13 (7.4%) |
| 18 to 19 Year Olds | 0 (0.0%) | 0 (0.0%) |
| 20 to 24 Year Olds | 34 (100.0%) | 0 (0.0%) |
| 25 to 34 Year Olds | 38 (100.0%) | 0 (0.0%) |
| 35 Years and over | 0 (0.0%) | 0 (0.0%) |
| Total | 405 (67.5%) | 195 (32.5%) |
Educational Attainment by Field of Study in Landmark
Computers & mathematics (78 | 28.8%), bio, nature & agricultural (49 | 18.1%), business (44 | 16.2%), education (30 | 11.1%), and liberal arts & history (27 | 10.0%) are the most common fields of study among 271 individuals in Landmark who have obtained a bachelor's degree or higher.
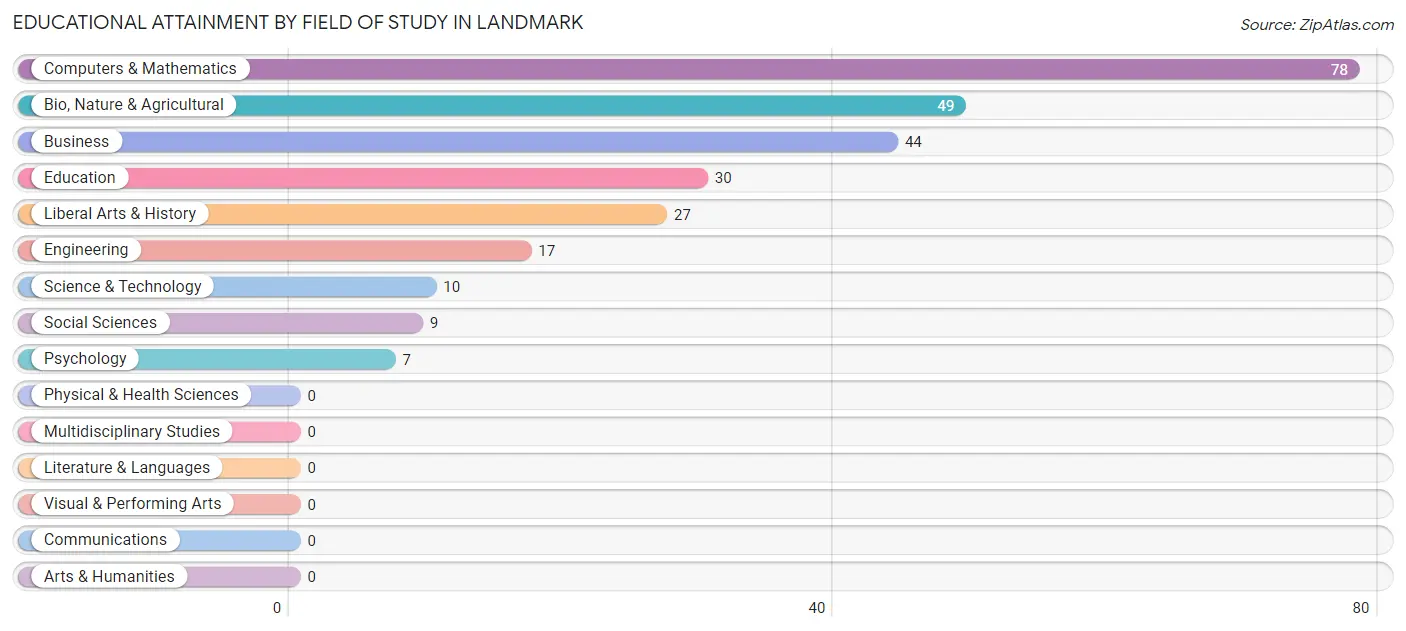
| Field of Study | # Graduates | % Graduates |
| Computers & Mathematics | 78 | 28.8% |
| Bio, Nature & Agricultural | 49 | 18.1% |
| Physical & Health Sciences | 0 | 0.0% |
| Psychology | 7 | 2.6% |
| Social Sciences | 9 | 3.3% |
| Engineering | 17 | 6.3% |
| Multidisciplinary Studies | 0 | 0.0% |
| Science & Technology | 10 | 3.7% |
| Business | 44 | 16.2% |
| Education | 30 | 11.1% |
| Literature & Languages | 0 | 0.0% |
| Liberal Arts & History | 27 | 10.0% |
| Visual & Performing Arts | 0 | 0.0% |
| Communications | 0 | 0.0% |
| Arts & Humanities | 0 | 0.0% |
| Total | 271 | 100.0% |
Transportation & Commute in Landmark
Vehicle Availability by Sex in Landmark
The most prevalent vehicle ownership categories in Landmark are males with 2 vehicles (238, accounting for 34.2%) and females with 2 vehicles (258, making up 36.1%).
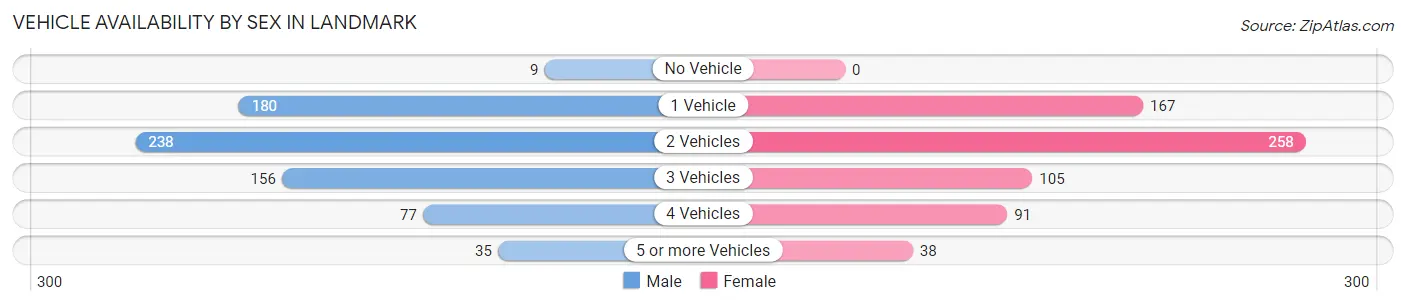
| Vehicles Available | Male | Female |
| No Vehicle | 9 (1.3%) | 0 (0.0%) |
| 1 Vehicle | 180 (25.9%) | 167 (25.3%) |
| 2 Vehicles | 238 (34.2%) | 258 (39.2%) |
| 3 Vehicles | 156 (22.5%) | 105 (15.9%) |
| 4 Vehicles | 77 (11.1%) | 91 (13.8%) |
| 5 or more Vehicles | 35 (5.0%) | 38 (5.8%) |
| Total | 695 (100.0%) | 659 (100.0%) |
Commute Time in Landmark
The most frequently occuring commute durations in Landmark are 30 to 34 minutes (446 commuters, 33.4%), 20 to 24 minutes (310 commuters, 23.2%), and 35 to 39 minutes (131 commuters, 9.8%).
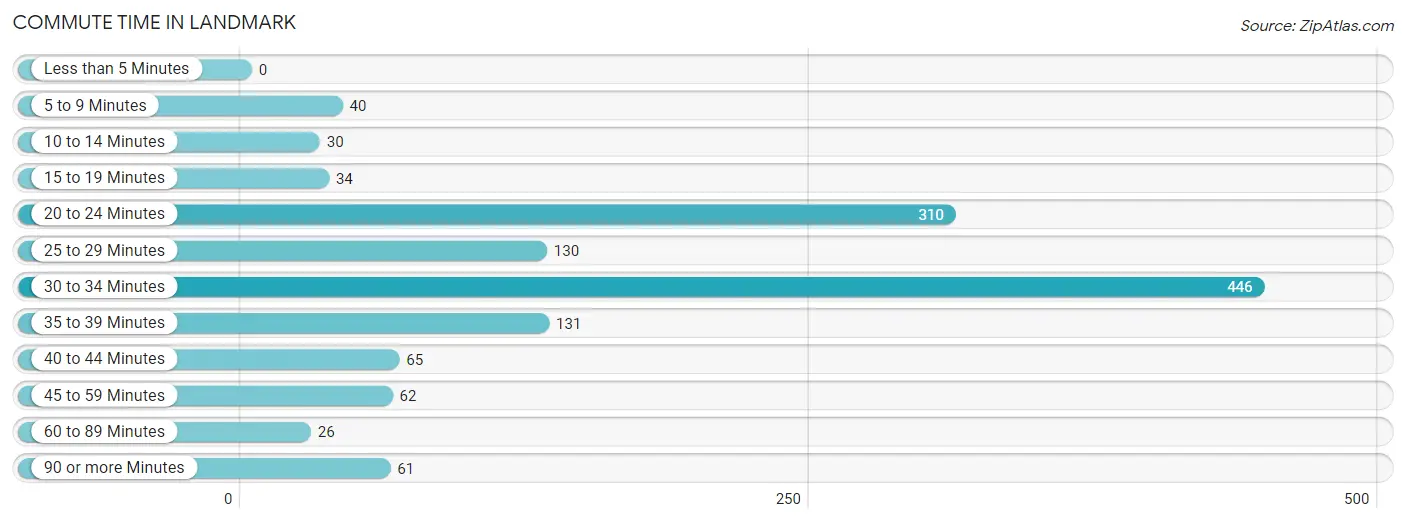
| Commute Time | # Commuters | % Commuters |
| Less than 5 Minutes | 0 | 0.0% |
| 5 to 9 Minutes | 40 | 3.0% |
| 10 to 14 Minutes | 30 | 2.2% |
| 15 to 19 Minutes | 34 | 2.5% |
| 20 to 24 Minutes | 310 | 23.2% |
| 25 to 29 Minutes | 130 | 9.7% |
| 30 to 34 Minutes | 446 | 33.4% |
| 35 to 39 Minutes | 131 | 9.8% |
| 40 to 44 Minutes | 65 | 4.9% |
| 45 to 59 Minutes | 62 | 4.6% |
| 60 to 89 Minutes | 26 | 1.9% |
| 90 or more Minutes | 61 | 4.6% |
Commute Time by Sex in Landmark
The most common commute times in Landmark are 30 to 34 minutes (238 commuters, 35.2%) for males and 30 to 34 minutes (208 commuters, 31.6%) for females.
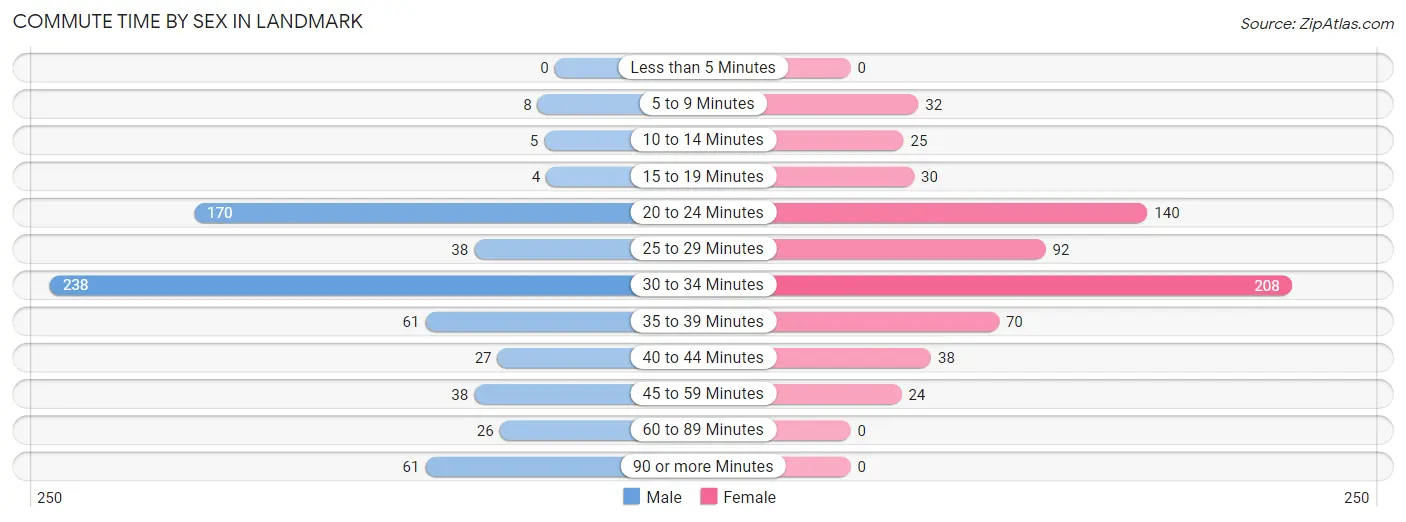
| Commute Time | Male | Female |
| Less than 5 Minutes | 0 (0.0%) | 0 (0.0%) |
| 5 to 9 Minutes | 8 (1.2%) | 32 (4.9%) |
| 10 to 14 Minutes | 5 (0.7%) | 25 (3.8%) |
| 15 to 19 Minutes | 4 (0.6%) | 30 (4.5%) |
| 20 to 24 Minutes | 170 (25.2%) | 140 (21.2%) |
| 25 to 29 Minutes | 38 (5.6%) | 92 (14.0%) |
| 30 to 34 Minutes | 238 (35.2%) | 208 (31.6%) |
| 35 to 39 Minutes | 61 (9.0%) | 70 (10.6%) |
| 40 to 44 Minutes | 27 (4.0%) | 38 (5.8%) |
| 45 to 59 Minutes | 38 (5.6%) | 24 (3.6%) |
| 60 to 89 Minutes | 26 (3.8%) | 0 (0.0%) |
| 90 or more Minutes | 61 (9.0%) | 0 (0.0%) |
Time of Departure to Work by Sex in Landmark
The most frequent times of departure to work in Landmark are 6:30 AM to 6:59 AM (144, 21.3%) for males and 7:00 AM to 7:29 AM (131, 19.9%) for females.
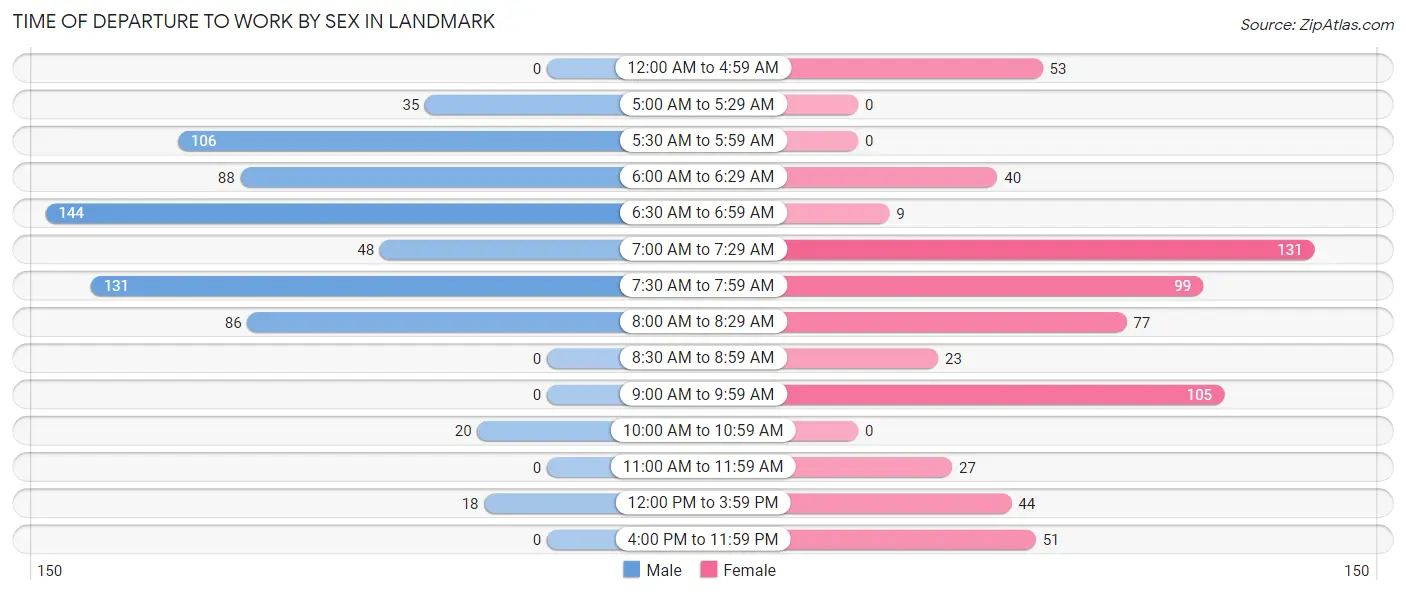
| Time of Departure | Male | Female |
| 12:00 AM to 4:59 AM | 0 (0.0%) | 53 (8.0%) |
| 5:00 AM to 5:29 AM | 35 (5.2%) | 0 (0.0%) |
| 5:30 AM to 5:59 AM | 106 (15.7%) | 0 (0.0%) |
| 6:00 AM to 6:29 AM | 88 (13.0%) | 40 (6.1%) |
| 6:30 AM to 6:59 AM | 144 (21.3%) | 9 (1.4%) |
| 7:00 AM to 7:29 AM | 48 (7.1%) | 131 (19.9%) |
| 7:30 AM to 7:59 AM | 131 (19.4%) | 99 (15.0%) |
| 8:00 AM to 8:29 AM | 86 (12.7%) | 77 (11.7%) |
| 8:30 AM to 8:59 AM | 0 (0.0%) | 23 (3.5%) |
| 9:00 AM to 9:59 AM | 0 (0.0%) | 105 (15.9%) |
| 10:00 AM to 10:59 AM | 20 (3.0%) | 0 (0.0%) |
| 11:00 AM to 11:59 AM | 0 (0.0%) | 27 (4.1%) |
| 12:00 PM to 3:59 PM | 18 (2.7%) | 44 (6.7%) |
| 4:00 PM to 11:59 PM | 0 (0.0%) | 51 (7.7%) |
| Total | 676 (100.0%) | 659 (100.0%) |
Housing Occupancy in Landmark
Occupancy by Ownership in Landmark
Of the total 1,364 dwellings in Landmark, owner-occupied units account for 1,129 (82.8%), while renter-occupied units make up 235 (17.2%).
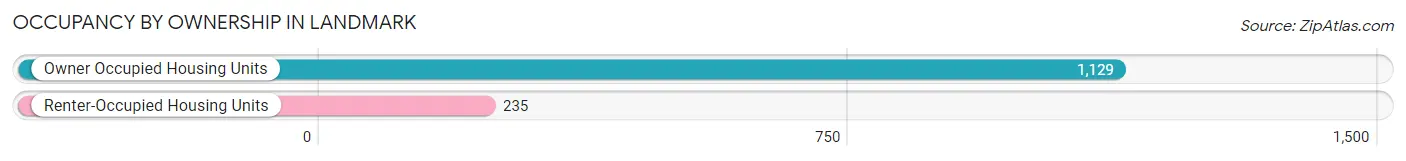
| Occupancy | # Housing Units | % Housing Units |
| Owner Occupied Housing Units | 1,129 | 82.8% |
| Renter-Occupied Housing Units | 235 | 17.2% |
| Total Occupied Housing Units | 1,364 | 100.0% |
Occupancy by Household Size in Landmark
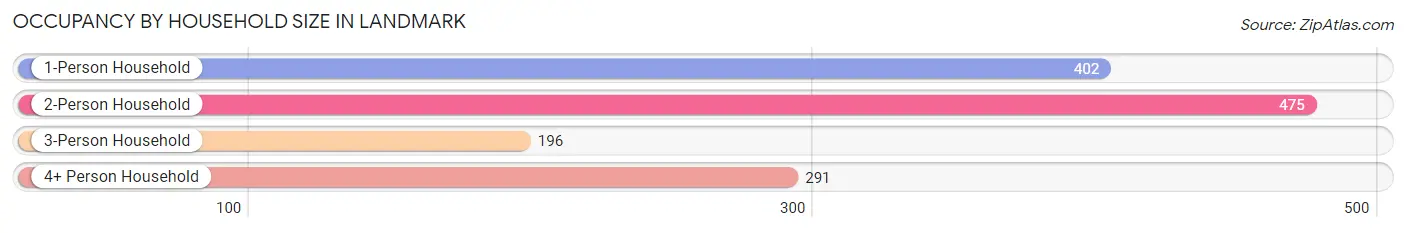
| Household Size | # Housing Units | % Housing Units |
| 1-Person Household | 402 | 29.5% |
| 2-Person Household | 475 | 34.8% |
| 3-Person Household | 196 | 14.4% |
| 4+ Person Household | 291 | 21.3% |
| Total Housing Units | 1,364 | 100.0% |
Occupancy by Ownership by Household Size in Landmark
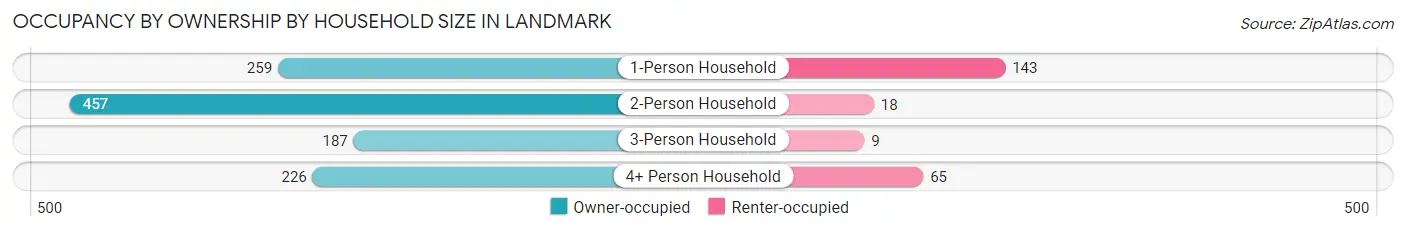
| Household Size | Owner-occupied | Renter-occupied |
| 1-Person Household | 259 (64.4%) | 143 (35.6%) |
| 2-Person Household | 457 (96.2%) | 18 (3.8%) |
| 3-Person Household | 187 (95.4%) | 9 (4.6%) |
| 4+ Person Household | 226 (77.7%) | 65 (22.3%) |
| Total Housing Units | 1,129 (82.8%) | 235 (17.2%) |
Occupancy by Educational Attainment in Landmark
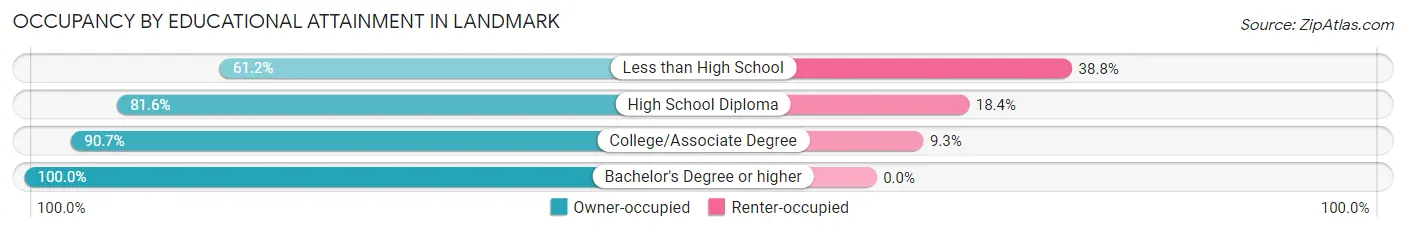
| Household Size | Owner-occupied | Renter-occupied |
| Less than High School | 158 (61.2%) | 100 (38.8%) |
| High School Diploma | 400 (81.6%) | 90 (18.4%) |
| College/Associate Degree | 440 (90.7%) | 45 (9.3%) |
| Bachelor's Degree or higher | 131 (100.0%) | 0 (0.0%) |
Occupancy by Age of Householder in Landmark
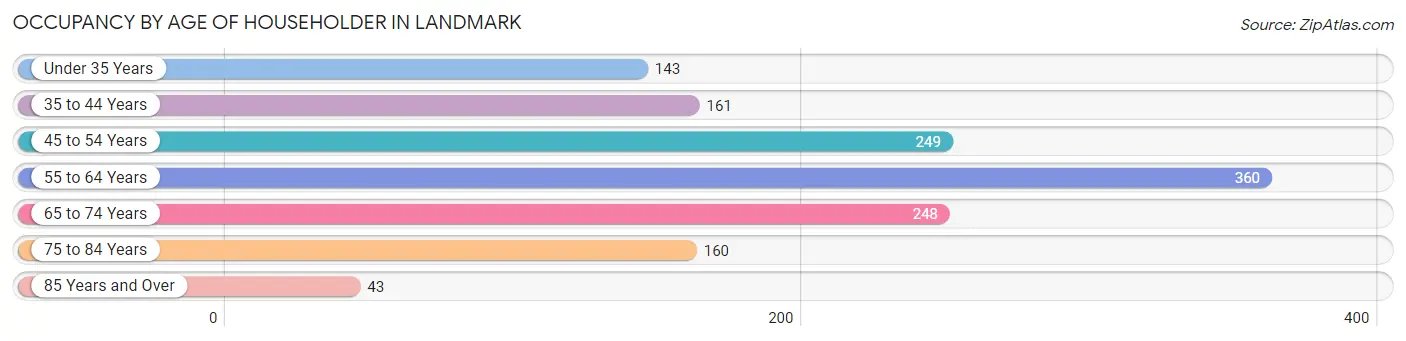
| Age Bracket | # Households | % Households |
| Under 35 Years | 143 | 10.5% |
| 35 to 44 Years | 161 | 11.8% |
| 45 to 54 Years | 249 | 18.3% |
| 55 to 64 Years | 360 | 26.4% |
| 65 to 74 Years | 248 | 18.2% |
| 75 to 84 Years | 160 | 11.7% |
| 85 Years and Over | 43 | 3.2% |
| Total | 1,364 | 100.0% |
Housing Finances in Landmark
Median Income by Occupancy in Landmark
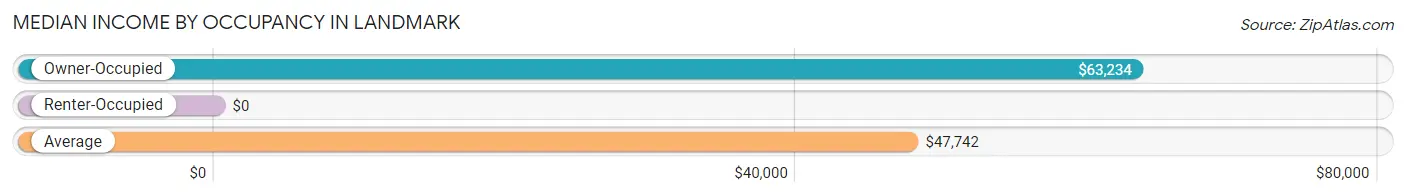
| Occupancy Type | # Households | Median Income |
| Owner-Occupied | 1,129 (82.8%) | $63,234 |
| Renter-Occupied | 235 (17.2%) | $0 |
| Average | 1,364 (100.0%) | $47,742 |
Occupancy by Householder Income Bracket in Landmark
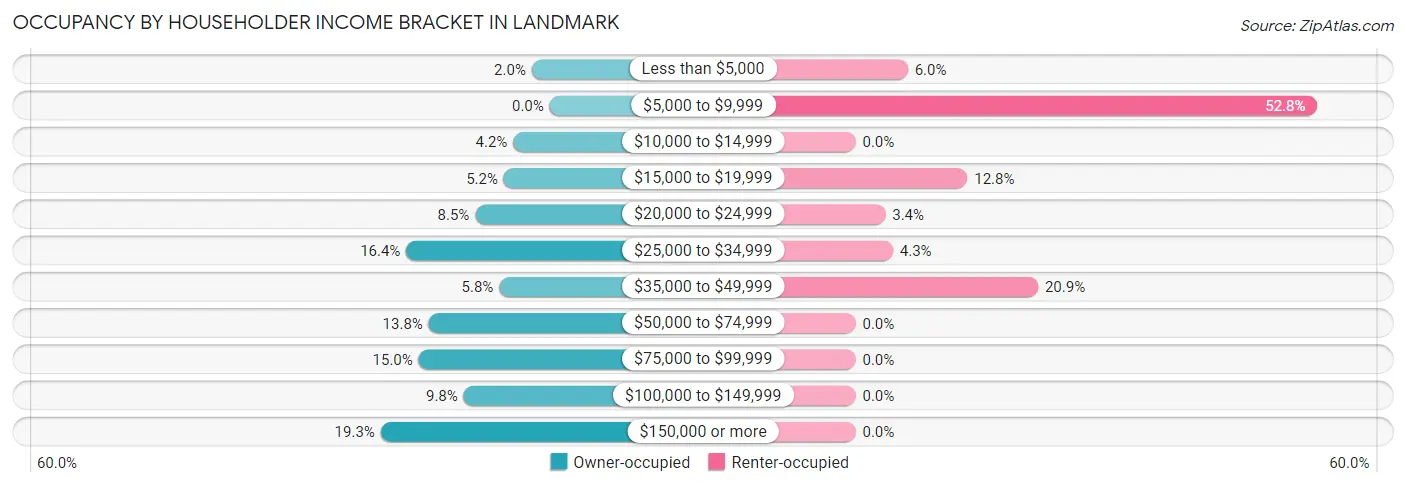
| Income Bracket | Owner-occupied | Renter-occupied |
| Less than $5,000 | 23 (2.0%) | 14 (6.0%) |
| $5,000 to $9,999 | 0 (0.0%) | 124 (52.8%) |
| $10,000 to $14,999 | 47 (4.2%) | 0 (0.0%) |
| $15,000 to $19,999 | 59 (5.2%) | 30 (12.8%) |
| $20,000 to $24,999 | 96 (8.5%) | 8 (3.4%) |
| $25,000 to $34,999 | 185 (16.4%) | 10 (4.3%) |
| $35,000 to $49,999 | 65 (5.8%) | 49 (20.8%) |
| $50,000 to $74,999 | 156 (13.8%) | 0 (0.0%) |
| $75,000 to $99,999 | 169 (15.0%) | 0 (0.0%) |
| $100,000 to $149,999 | 111 (9.8%) | 0 (0.0%) |
| $150,000 or more | 218 (19.3%) | 0 (0.0%) |
| Total | 1,129 (100.0%) | 235 (100.0%) |
Monthly Housing Cost Tiers in Landmark
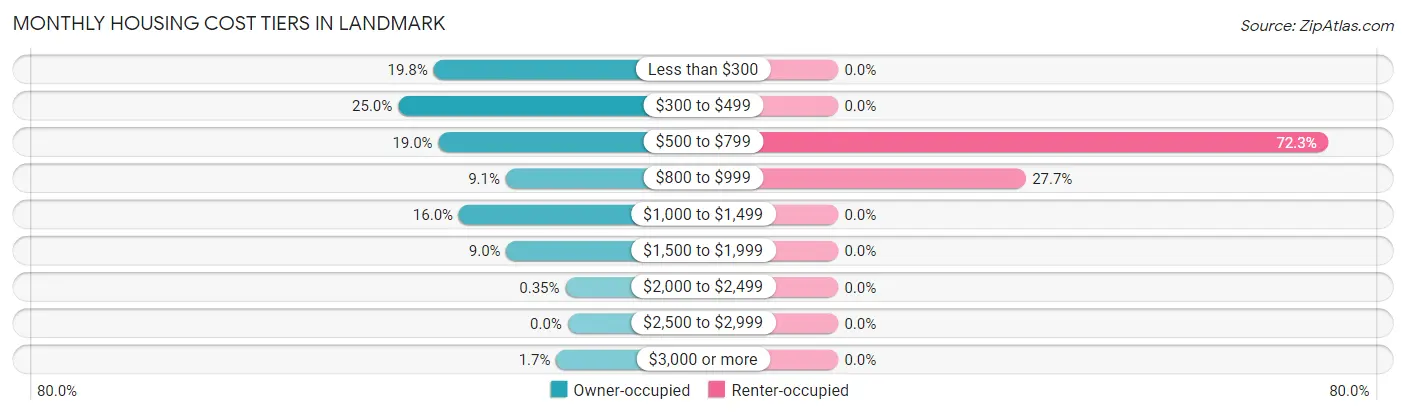
| Monthly Cost | Owner-occupied | Renter-occupied |
| Less than $300 | 223 (19.8%) | 0 (0.0%) |
| $300 to $499 | 282 (25.0%) | 0 (0.0%) |
| $500 to $799 | 215 (19.0%) | 170 (72.3%) |
| $800 to $999 | 103 (9.1%) | 65 (27.7%) |
| $1,000 to $1,499 | 181 (16.0%) | 0 (0.0%) |
| $1,500 to $1,999 | 102 (9.0%) | 0 (0.0%) |
| $2,000 to $2,499 | 4 (0.4%) | 0 (0.0%) |
| $2,500 to $2,999 | 0 (0.0%) | 0 (0.0%) |
| $3,000 or more | 19 (1.7%) | 0 (0.0%) |
| Total | 1,129 (100.0%) | 235 (100.0%) |
Physical Housing Characteristics in Landmark
Housing Structures in Landmark
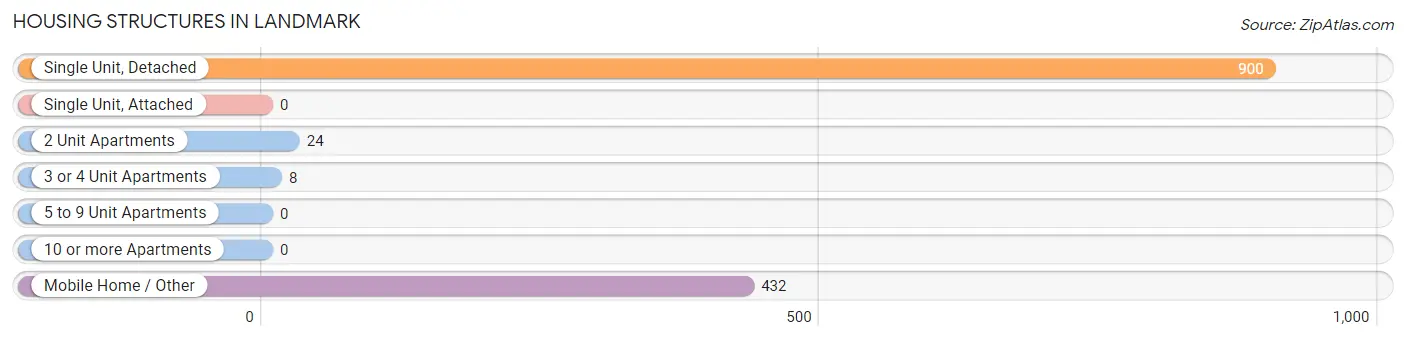
| Structure Type | # Housing Units | % Housing Units |
| Single Unit, Detached | 900 | 66.0% |
| Single Unit, Attached | 0 | 0.0% |
| 2 Unit Apartments | 24 | 1.8% |
| 3 or 4 Unit Apartments | 8 | 0.6% |
| 5 to 9 Unit Apartments | 0 | 0.0% |
| 10 or more Apartments | 0 | 0.0% |
| Mobile Home / Other | 432 | 31.7% |
| Total | 1,364 | 100.0% |
Housing Structures by Occupancy in Landmark
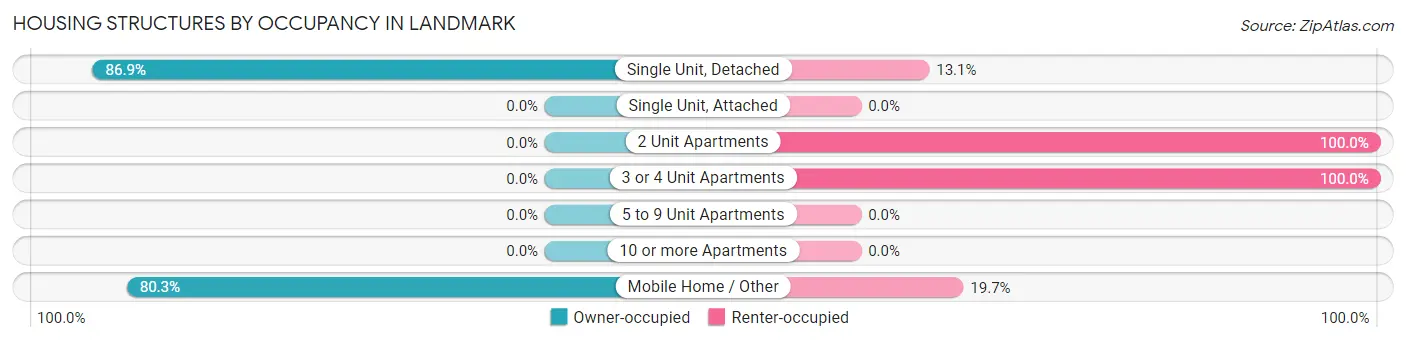
| Structure Type | Owner-occupied | Renter-occupied |
| Single Unit, Detached | 782 (86.9%) | 118 (13.1%) |
| Single Unit, Attached | 0 (0.0%) | 0 (0.0%) |
| 2 Unit Apartments | 0 (0.0%) | 24 (100.0%) |
| 3 or 4 Unit Apartments | 0 (0.0%) | 8 (100.0%) |
| 5 to 9 Unit Apartments | 0 (0.0%) | 0 (0.0%) |
| 10 or more Apartments | 0 (0.0%) | 0 (0.0%) |
| Mobile Home / Other | 347 (80.3%) | 85 (19.7%) |
| Total | 1,129 (82.8%) | 235 (17.2%) |
Housing Structures by Number of Rooms in Landmark
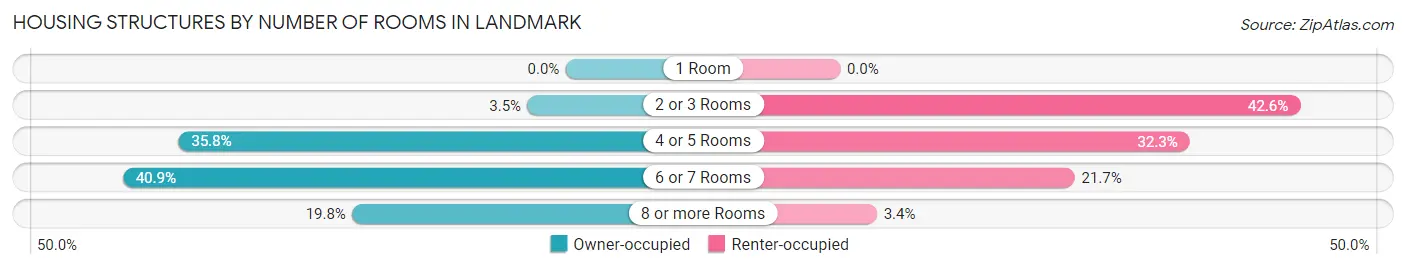
| Number of Rooms | Owner-occupied | Renter-occupied |
| 1 Room | 0 (0.0%) | 0 (0.0%) |
| 2 or 3 Rooms | 40 (3.5%) | 100 (42.5%) |
| 4 or 5 Rooms | 404 (35.8%) | 76 (32.3%) |
| 6 or 7 Rooms | 462 (40.9%) | 51 (21.7%) |
| 8 or more Rooms | 223 (19.8%) | 8 (3.4%) |
| Total | 1,129 (100.0%) | 235 (100.0%) |
Housing Structure by Heating Type in Landmark
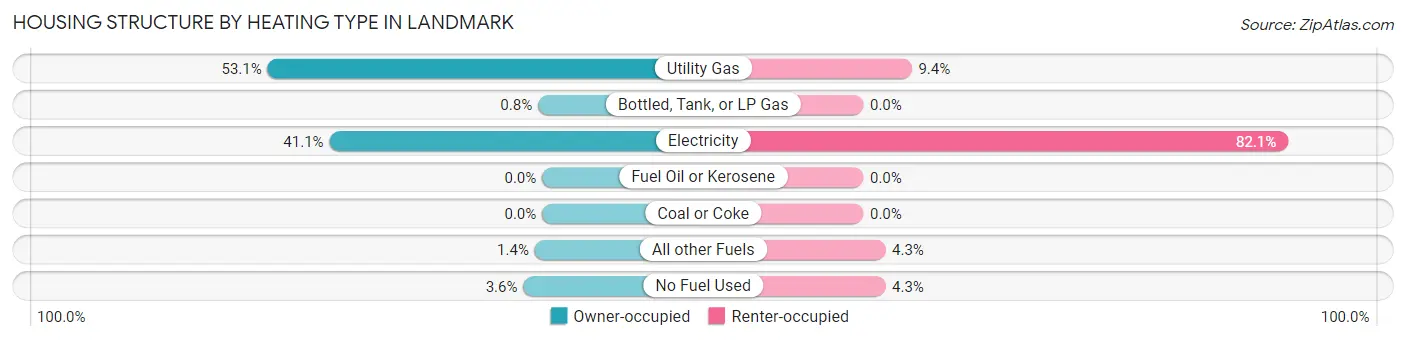
| Heating Type | Owner-occupied | Renter-occupied |
| Utility Gas | 599 (53.1%) | 22 (9.4%) |
| Bottled, Tank, or LP Gas | 9 (0.8%) | 0 (0.0%) |
| Electricity | 464 (41.1%) | 193 (82.1%) |
| Fuel Oil or Kerosene | 0 (0.0%) | 0 (0.0%) |
| Coal or Coke | 0 (0.0%) | 0 (0.0%) |
| All other Fuels | 16 (1.4%) | 10 (4.3%) |
| No Fuel Used | 41 (3.6%) | 10 (4.3%) |
| Total | 1,129 (100.0%) | 235 (100.0%) |
Household Vehicle Usage in Landmark
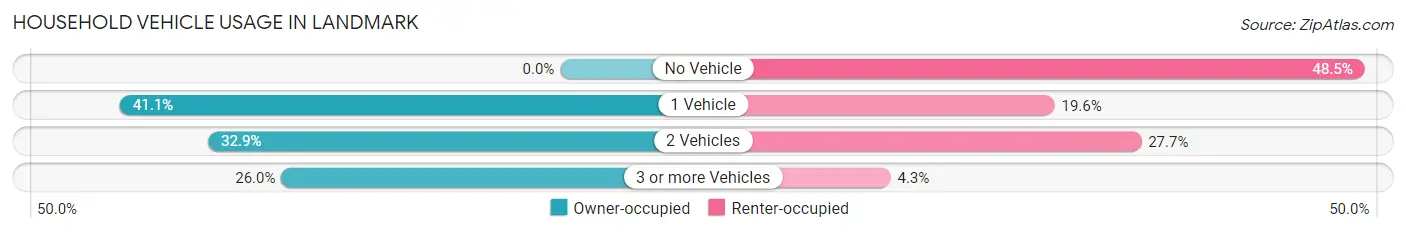
| Vehicles per Household | Owner-occupied | Renter-occupied |
| No Vehicle | 0 (0.0%) | 114 (48.5%) |
| 1 Vehicle | 464 (41.1%) | 46 (19.6%) |
| 2 Vehicles | 371 (32.9%) | 65 (27.7%) |
| 3 or more Vehicles | 294 (26.0%) | 10 (4.3%) |
| Total | 1,129 (100.0%) | 235 (100.0%) |
Real Estate & Mortgages in Landmark
Real Estate and Mortgage Overview in Landmark
| Characteristic | Without Mortgage | With Mortgage |
| Housing Units | 634 | 495 |
| Median Property Value | $87,500 | $129,600 |
| Median Household Income | $40,357 | $174 |
| Monthly Housing Costs | $376 | $19 |
| Real Estate Taxes | $520 | $54 |
Property Value by Mortgage Status in Landmark
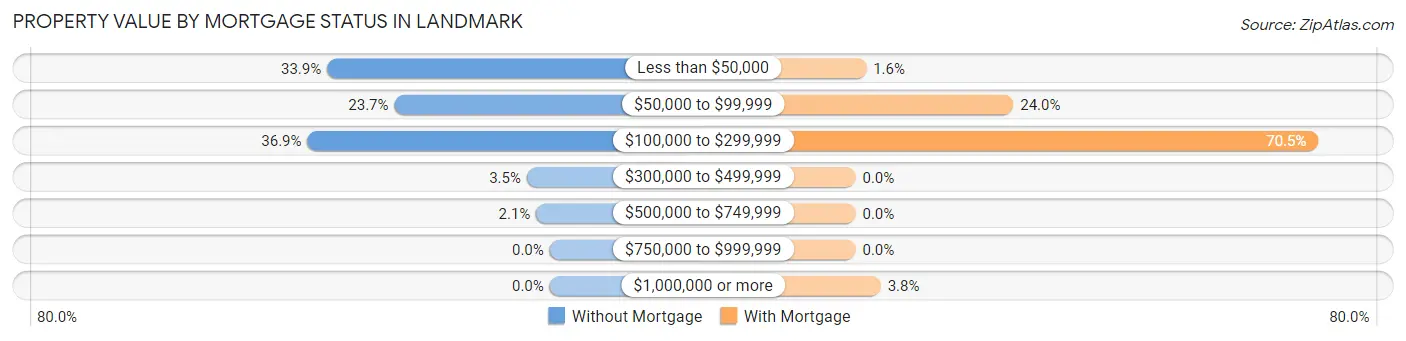
| Property Value | Without Mortgage | With Mortgage |
| Less than $50,000 | 215 (33.9%) | 8 (1.6%) |
| $50,000 to $99,999 | 150 (23.7%) | 119 (24.0%) |
| $100,000 to $299,999 | 234 (36.9%) | 349 (70.5%) |
| $300,000 to $499,999 | 22 (3.5%) | 0 (0.0%) |
| $500,000 to $749,999 | 13 (2.1%) | 0 (0.0%) |
| $750,000 to $999,999 | 0 (0.0%) | 0 (0.0%) |
| $1,000,000 or more | 0 (0.0%) | 19 (3.8%) |
| Total | 634 (100.0%) | 495 (100.0%) |
Household Income by Mortgage Status in Landmark
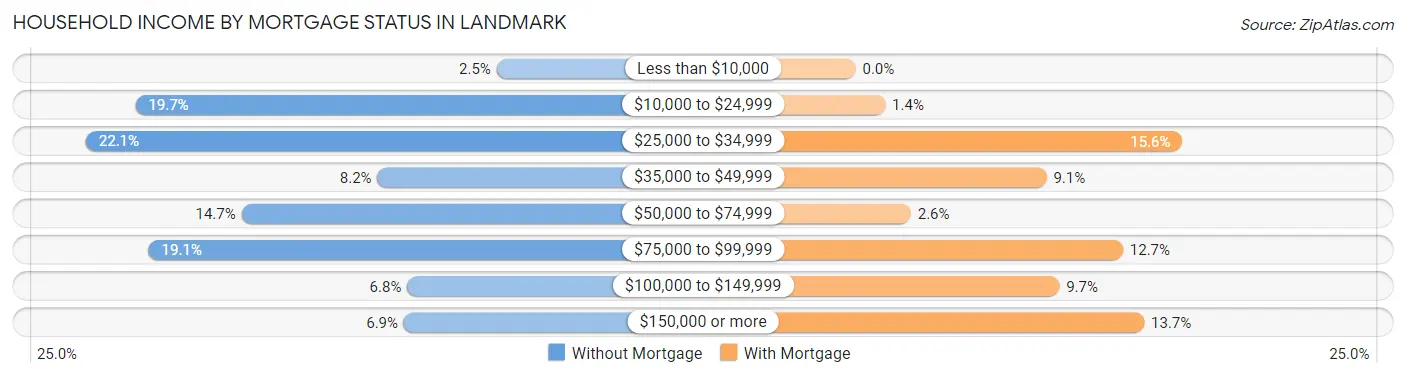
| Household Income | Without Mortgage | With Mortgage |
| Less than $10,000 | 16 (2.5%) | 0 (0.0%) |
| $10,000 to $24,999 | 125 (19.7%) | 7 (1.4%) |
| $25,000 to $34,999 | 140 (22.1%) | 77 (15.6%) |
| $35,000 to $49,999 | 52 (8.2%) | 45 (9.1%) |
| $50,000 to $74,999 | 93 (14.7%) | 13 (2.6%) |
| $75,000 to $99,999 | 121 (19.1%) | 63 (12.7%) |
| $100,000 to $149,999 | 43 (6.8%) | 48 (9.7%) |
| $150,000 or more | 44 (6.9%) | 68 (13.7%) |
| Total | 634 (100.0%) | 495 (100.0%) |
Property Value to Household Income Ratio in Landmark
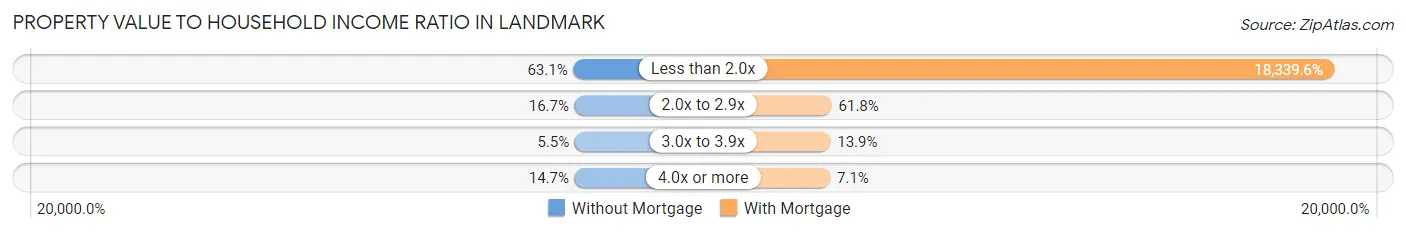
| Value-to-Income Ratio | Without Mortgage | With Mortgage |
| Less than 2.0x | 400 (63.1%) | 90,781 (18,339.6%) |
| 2.0x to 2.9x | 106 (16.7%) | 306 (61.8%) |
| 3.0x to 3.9x | 35 (5.5%) | 69 (13.9%) |
| 4.0x or more | 93 (14.7%) | 35 (7.1%) |
| Total | 634 (100.0%) | 495 (100.0%) |
Real Estate Taxes by Mortgage Status in Landmark
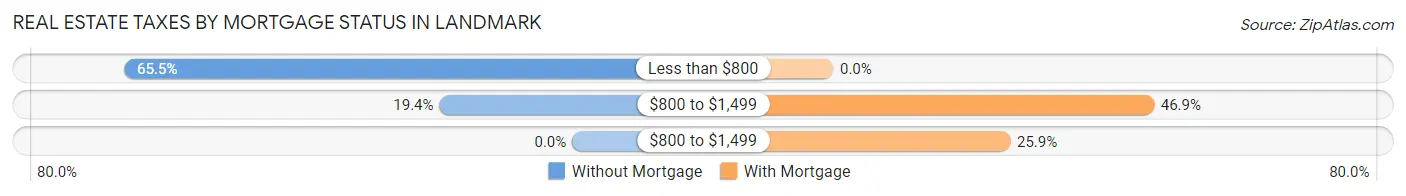
| Property Taxes | Without Mortgage | With Mortgage |
| Less than $800 | 415 (65.5%) | 0 (0.0%) |
| $800 to $1,499 | 123 (19.4%) | 232 (46.9%) |
| $800 to $1,499 | 0 (0.0%) | 128 (25.9%) |
| Total | 634 (100.0%) | 495 (100.0%) |
Health & Disability in Landmark
Health Insurance Coverage by Age in Landmark
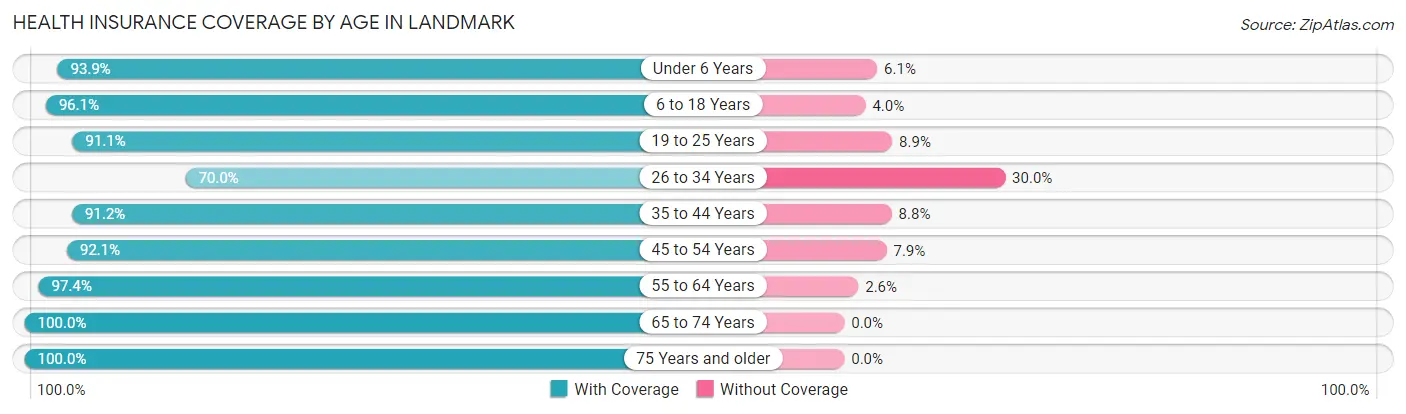
| Age Bracket | With Coverage | Without Coverage |
| Under 6 Years | 429 (93.9%) | 28 (6.1%) |
| 6 to 18 Years | 510 (96.1%) | 21 (4.0%) |
| 19 to 25 Years | 194 (91.1%) | 19 (8.9%) |
| 26 to 34 Years | 154 (70.0%) | 66 (30.0%) |
| 35 to 44 Years | 320 (91.2%) | 31 (8.8%) |
| 45 to 54 Years | 561 (92.1%) | 48 (7.9%) |
| 55 to 64 Years | 486 (97.4%) | 13 (2.6%) |
| 65 to 74 Years | 465 (100.0%) | 0 (0.0%) |
| 75 Years and older | 275 (100.0%) | 0 (0.0%) |
| Total | 3,394 (93.8%) | 226 (6.2%) |
Health Insurance Coverage by Citizenship Status in Landmark
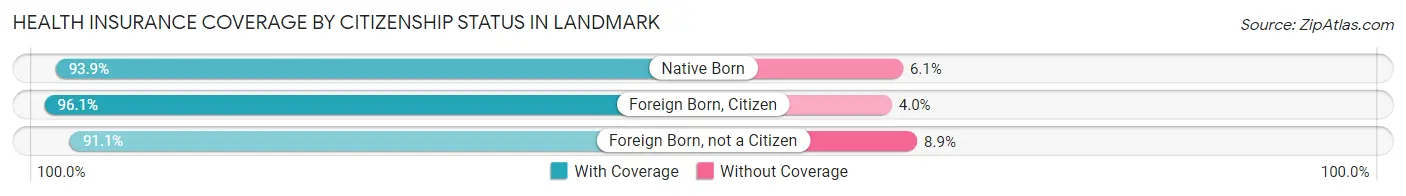
| Citizenship Status | With Coverage | Without Coverage |
| Native Born | 429 (93.9%) | 28 (6.1%) |
| Foreign Born, Citizen | 510 (96.1%) | 21 (4.0%) |
| Foreign Born, not a Citizen | 194 (91.1%) | 19 (8.9%) |
Health Insurance Coverage by Household Income in Landmark
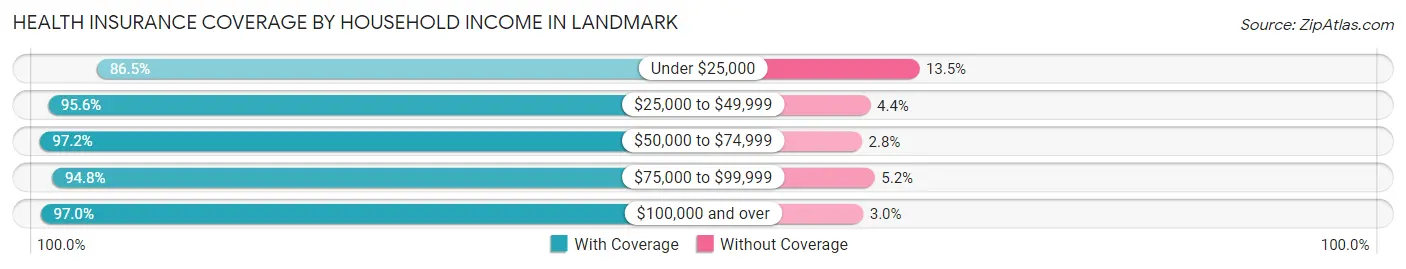
| Household Income | With Coverage | Without Coverage |
| Under $25,000 | 793 (86.5%) | 124 (13.5%) |
| $25,000 to $49,999 | 1,007 (95.6%) | 46 (4.4%) |
| $50,000 to $74,999 | 420 (97.2%) | 12 (2.8%) |
| $75,000 to $99,999 | 330 (94.8%) | 18 (5.2%) |
| $100,000 and over | 844 (97.0%) | 26 (3.0%) |
Public vs Private Health Insurance Coverage by Age in Landmark
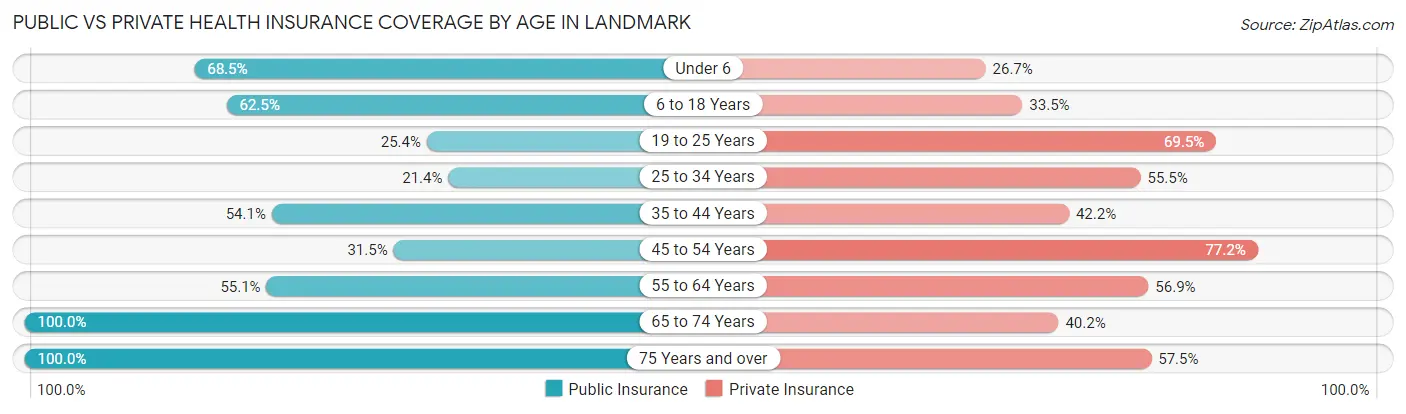
| Age Bracket | Public Insurance | Private Insurance |
| Under 6 | 313 (68.5%) | 122 (26.7%) |
| 6 to 18 Years | 332 (62.5%) | 178 (33.5%) |
| 19 to 25 Years | 54 (25.4%) | 148 (69.5%) |
| 25 to 34 Years | 47 (21.4%) | 122 (55.4%) |
| 35 to 44 Years | 190 (54.1%) | 148 (42.2%) |
| 45 to 54 Years | 192 (31.5%) | 470 (77.2%) |
| 55 to 64 Years | 275 (55.1%) | 284 (56.9%) |
| 65 to 74 Years | 465 (100.0%) | 187 (40.2%) |
| 75 Years and over | 275 (100.0%) | 158 (57.5%) |
| Total | 2,143 (59.2%) | 1,817 (50.2%) |
Disability Status by Sex by Age in Landmark
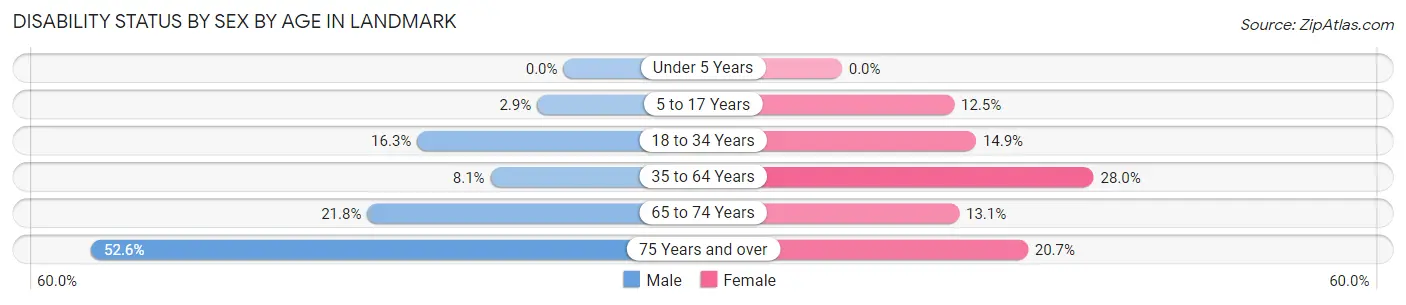
| Age Bracket | Male | Female |
| Under 5 Years | 0 (0.0%) | 0 (0.0%) |
| 5 to 17 Years | 9 (2.9%) | 28 (12.5%) |
| 18 to 34 Years | 28 (16.3%) | 39 (14.9%) |
| 35 to 64 Years | 51 (8.1%) | 233 (28.0%) |
| 65 to 74 Years | 38 (21.8%) | 38 (13.1%) |
| 75 Years and over | 71 (52.6%) | 29 (20.7%) |
Disability Class by Sex by Age in Landmark
Disability Class: Hearing Difficulty
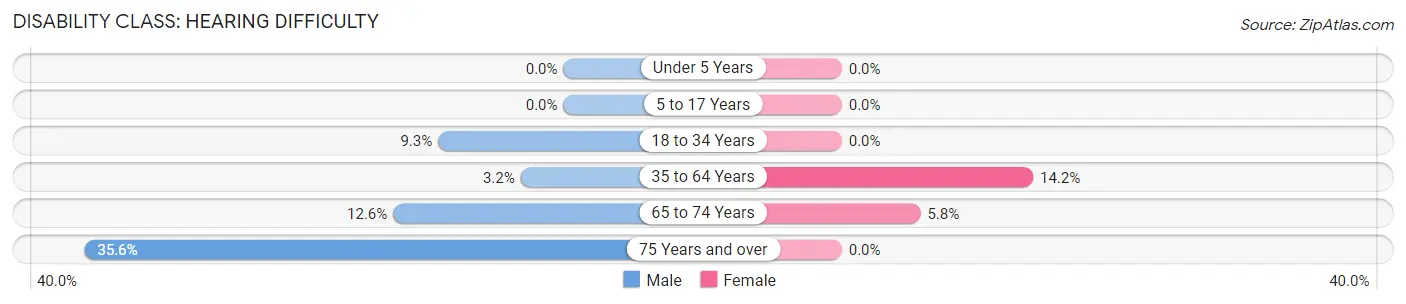
| Age Bracket | Male | Female |
| Under 5 Years | 0 (0.0%) | 0 (0.0%) |
| 5 to 17 Years | 0 (0.0%) | 0 (0.0%) |
| 18 to 34 Years | 16 (9.3%) | 0 (0.0%) |
| 35 to 64 Years | 20 (3.2%) | 118 (14.2%) |
| 65 to 74 Years | 22 (12.6%) | 17 (5.8%) |
| 75 Years and over | 48 (35.6%) | 0 (0.0%) |
Disability Class: Vision Difficulty
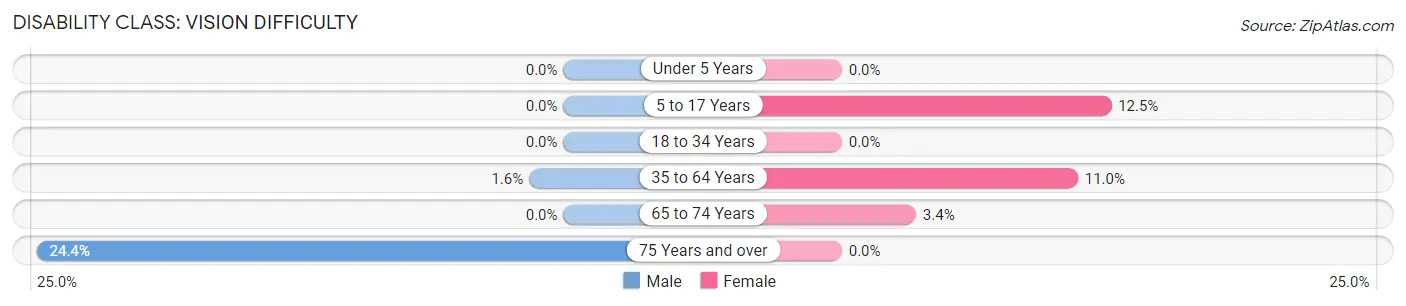
| Age Bracket | Male | Female |
| Under 5 Years | 0 (0.0%) | 0 (0.0%) |
| 5 to 17 Years | 0 (0.0%) | 28 (12.5%) |
| 18 to 34 Years | 0 (0.0%) | 0 (0.0%) |
| 35 to 64 Years | 10 (1.6%) | 91 (11.0%) |
| 65 to 74 Years | 0 (0.0%) | 10 (3.4%) |
| 75 Years and over | 33 (24.4%) | 0 (0.0%) |
Disability Class: Cognitive Difficulty
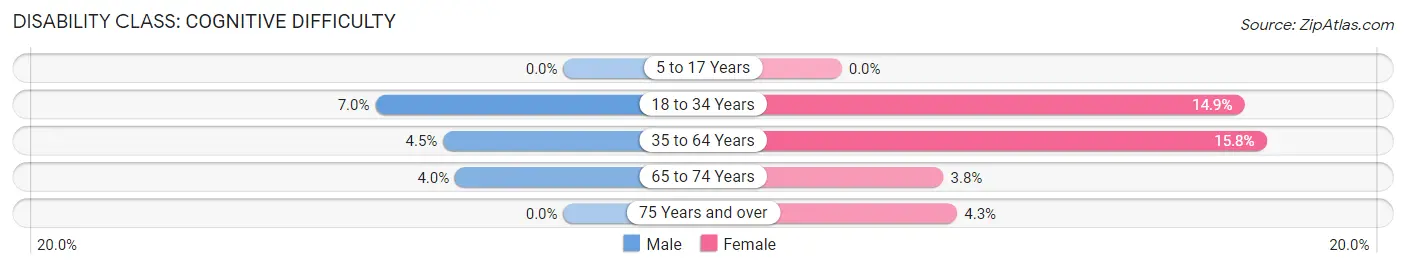
| Age Bracket | Male | Female |
| 5 to 17 Years | 0 (0.0%) | 0 (0.0%) |
| 18 to 34 Years | 12 (7.0%) | 39 (14.9%) |
| 35 to 64 Years | 28 (4.5%) | 131 (15.8%) |
| 65 to 74 Years | 7 (4.0%) | 11 (3.8%) |
| 75 Years and over | 0 (0.0%) | 6 (4.3%) |
Disability Class: Ambulatory Difficulty
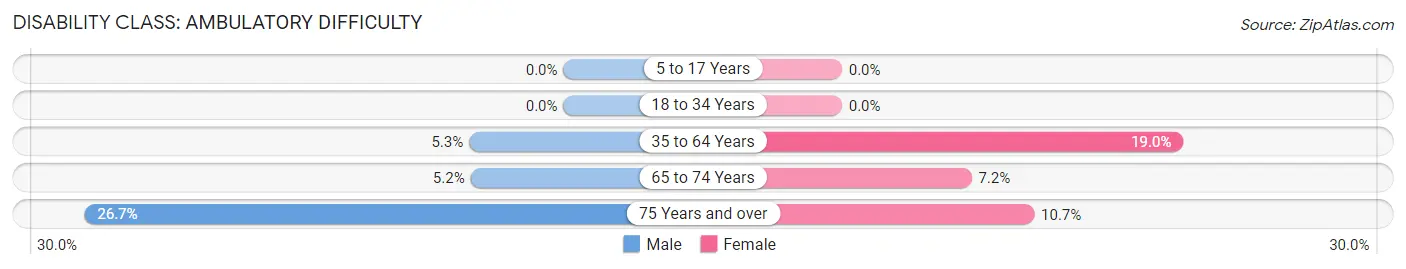
| Age Bracket | Male | Female |
| 5 to 17 Years | 0 (0.0%) | 0 (0.0%) |
| 18 to 34 Years | 0 (0.0%) | 0 (0.0%) |
| 35 to 64 Years | 33 (5.2%) | 158 (19.0%) |
| 65 to 74 Years | 9 (5.2%) | 21 (7.2%) |
| 75 Years and over | 36 (26.7%) | 15 (10.7%) |
Disability Class: Self-Care Difficulty
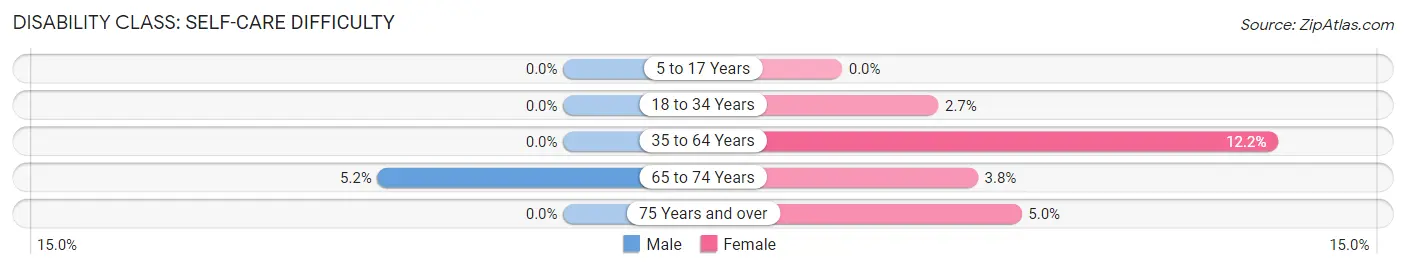
| Age Bracket | Male | Female |
| 5 to 17 Years | 0 (0.0%) | 0 (0.0%) |
| 18 to 34 Years | 0 (0.0%) | 7 (2.7%) |
| 35 to 64 Years | 0 (0.0%) | 101 (12.1%) |
| 65 to 74 Years | 9 (5.2%) | 11 (3.8%) |
| 75 Years and over | 0 (0.0%) | 7 (5.0%) |
Technology Access in Landmark
Computing Device Access in Landmark
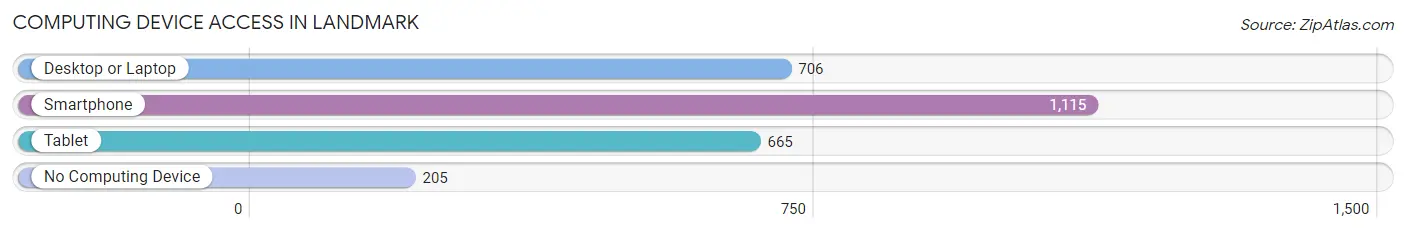
| Device Type | # Households | % Households |
| Desktop or Laptop | 706 | 51.8% |
| Smartphone | 1,115 | 81.7% |
| Tablet | 665 | 48.7% |
| No Computing Device | 205 | 15.0% |
| Total | 1,364 | 100.0% |
Internet Access in Landmark
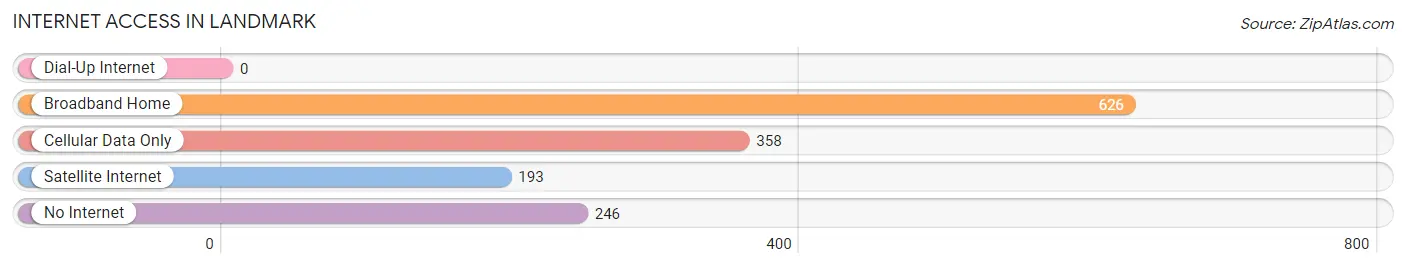
| Internet Type | # Households | % Households |
| Dial-Up Internet | 0 | 0.0% |
| Broadband Home | 626 | 45.9% |
| Cellular Data Only | 358 | 26.3% |
| Satellite Internet | 193 | 14.1% |
| No Internet | 246 | 18.0% |
| Total | 1,364 | 100.0% |
Landmark Summary
AR History
Arkansas is a state located in the Southern United States. It is bordered by Missouri to the north, Tennessee and Mississippi to the east, Louisiana to the south, and Texas to the southwest. Arkansas is the 33rd largest state in the United States, with an area of 53,179 square miles (137,732 km2). It is also the 29th most populous state, with a population of 3 million people as of 2020.
The first inhabitants of Arkansas were Native American tribes, including the Caddo, Osage, Quapaw, and Cherokee. The first Europeans to explore the area were the Spanish, who arrived in 1541. The French later established a trading post in Arkansas in 1686. The Louisiana Purchase of 1803 brought the area under United States control, and Arkansas became a territory in 1819. Arkansas was admitted to the Union as the 25th state in 1836.
During the Civil War, Arkansas was a Confederate state. After the war, the state experienced a period of Reconstruction, during which African Americans were granted the right to vote and hold public office. In the late 19th century, the state experienced a period of economic growth, fueled by the timber and cotton industries.
Geography
Arkansas is located in the south-central region of the United States. It is bordered by Missouri to the north, Tennessee and Mississippi to the east, Louisiana to the south, and Texas to the southwest. The state has a total area of 53,179 square miles (137,732 km2), making it the 33rd largest state in the country.
The landscape of Arkansas is diverse, ranging from the Ozark Mountains in the northwest to the flat plains of the Arkansas Delta in the east. The state is home to numerous rivers, including the Arkansas, White, and St. Francis. The highest point in the state is Magazine Mountain, which has an elevation of 2,753 feet (839 m).
Economy
Arkansas’s economy is largely based on agriculture and natural resources. The state is a major producer of cotton, rice, soybeans, and poultry. Other important industries include timber, manufacturing, and tourism.
The state’s largest employers are the University of Arkansas, Walmart, Tyson Foods, and the Arkansas Department of Education. Arkansas is also home to several Fortune 500 companies, including Dillard’s, Murphy Oil, and J.B. Hunt Transport Services.
Demographics
As of 2020, Arkansas had an estimated population of 3 million people. The state has a population density of 56 people per square mile (22 people per km2). The largest cities in Arkansas are Little Rock, Fort Smith, Fayetteville, Springdale, and Jonesboro.
The racial makeup of Arkansas is 73.3% White, 15.7% Black or African American, 0.7% Native American, 1.7% Asian, 0.1% Pacific Islander, and 7.4% from other races. The state also has a large Hispanic or Latino population, making up 8.3% of the population.
The median household income in Arkansas is $45,869, and the median home value is $133,400. The state’s poverty rate is 17.2%, and the unemployment rate is 3.7%.
Conclusion
Arkansas is a state located in the Southern United States. It is bordered by Missouri to the north, Tennessee and Mississippi to the east, Louisiana to the south, and Texas to the southwest. Arkansas is the 33rd largest state in the United States, with an area of 53,179 square miles (137,732 km2). It is also the 29th most populous state, with a population of 3 million people as of 2020. The state’s economy is largely based on agriculture and natural resources, and its largest employers are the University of Arkansas, Walmart, Tyson Foods, and the Arkansas Department of Education. The racial makeup of Arkansas is 73.3% White, 15.7% Black or African American, 0.7% Native American, 1.7% Asian, 0.1% Pacific Islander, and 7.4% from other races. The median household income in Arkansas is $45,869, and the median home value is $133,400.
Common Questions
What is Per Capita Income in Landmark?
Per Capita income in Landmark is $33,453.
What is the Median Family Income in Landmark?
Median Family Income in Landmark is $63,922.
What is the Median Household income in Landmark?
Median Household Income in Landmark is $47,742.
What is Income or Wage Gap in Landmark?
Income or Wage Gap in Landmark is 41.0%.
Women in Landmark earn 59.0 cents for every dollar earned by a man.
What is Family Income Deficit in Landmark?
Family Income Deficit in Landmark is $10,431.
Families that are below poverty line in Landmark earn $10,431 less on average than the poverty threshold level.
What is Inequality or Gini Index in Landmark?
Inequality or Gini Index in Landmark is 0.58.
What is the Total Population of Landmark?
Total Population of Landmark is 3,620.
What is the Total Male Population of Landmark?
Total Male Population of Landmark is 1,710.
What is the Total Female Population of Landmark?
Total Female Population of Landmark is 1,910.
What is the Ratio of Males per 100 Females in Landmark?
There are 89.53 Males per 100 Females in Landmark.
What is the Ratio of Females per 100 Males in Landmark?
There are 111.70 Females per 100 Males in Landmark.
What is the Median Population Age in Landmark?
Median Population Age in Landmark is 47.8 Years.
What is the Average Family Size in Landmark
Average Family Size in Landmark is 3.4 People.
What is the Average Household Size in Landmark
Average Household Size in Landmark is 2.6 People.
How Large is the Labor Force in Landmark?
There are 1,450 People in the Labor Forcein in Landmark.
What is the Percentage of People in the Labor Force in Landmark?
52.8% of People are in the Labor Force in Landmark.
What is the Unemployment Rate in Landmark?
Unemployment Rate in Landmark is 4.5%.