Tsimshian vs Immigrants from Jamaica 2 or more Vehicles in Household
COMPARE
Tsimshian
Immigrants from Jamaica
2 or more Vehicles in Household
2 or more Vehicles in Household Comparison
Tsimshian
Immigrants from Jamaica
56.7%
2 OR MORE VEHICLES IN HOUSEHOLD
91.6/ 100
METRIC RATING
125th/ 347
METRIC RANK
44.5%
2 OR MORE VEHICLES IN HOUSEHOLD
0.0/ 100
METRIC RATING
321st/ 347
METRIC RANK
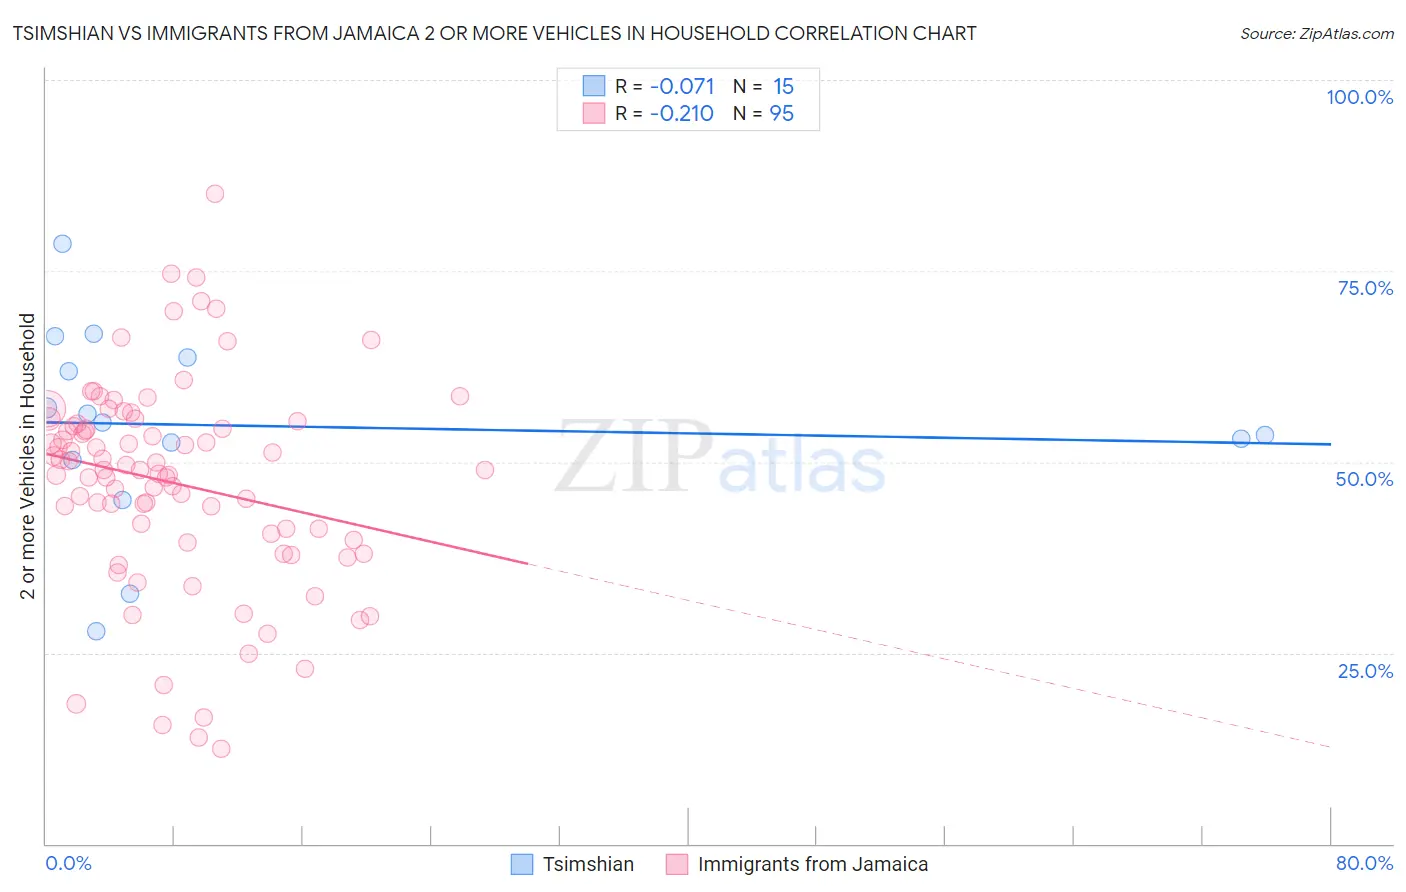
Tsimshian vs Immigrants from Jamaica 2 or more Vehicles in Household Correlation Chart
The statistical analysis conducted on geographies consisting of 15,626,544 people shows a slight negative correlation between the proportion of Tsimshian and percentage of households with 2 or more vehicles available in the United States with a correlation coefficient (R) of -0.071 and weighted average of 56.7%. Similarly, the statistical analysis conducted on geographies consisting of 301,616,256 people shows a weak negative correlation between the proportion of Immigrants from Jamaica and percentage of households with 2 or more vehicles available in the United States with a correlation coefficient (R) of -0.210 and weighted average of 44.5%, a difference of 27.4%.
2 or more Vehicles in Household Correlation Summary
| Measurement | Tsimshian | Immigrants from Jamaica |
| Minimum | 27.8% | 12.4% |
| Maximum | 78.5% | 85.1% |
| Range | 50.8% | 72.7% |
| Mean | 54.7% | 47.3% |
| Median | 55.1% | 49.0% |
| Interquartile 25% (IQ1) | 50.3% | 39.8% |
| Interquartile 75% (IQ3) | 63.6% | 55.0% |
| Interquartile Range (IQR) | 13.3% | 15.2% |
| Standard Deviation (Sample) | 12.9% | 13.8% |
| Standard Deviation (Population) | 12.4% | 13.7% |
Similar Demographics by 2 or more Vehicles in Household
Demographics Similar to Tsimshian by 2 or more Vehicles in Household
In terms of 2 or more vehicles in household, the demographic groups most similar to Tsimshian are New Zealander (56.7%, a difference of 0.020%), Australian (56.7%, a difference of 0.030%), Estonian (56.6%, a difference of 0.080%), Immigrants from Thailand (56.6%, a difference of 0.11%), and Immigrants from South Africa (56.7%, a difference of 0.12%).
| Demographics | Rating | Rank | 2 or more Vehicles in Household |
| Asians | 95.1 /100 | #118 | Exceptional 57.0% |
| Natives/Alaskans | 95.0 /100 | #119 | Exceptional 57.0% |
| Costa Ricans | 94.7 /100 | #120 | Exceptional 56.9% |
| Sioux | 93.8 /100 | #121 | Exceptional 56.8% |
| Immigrants | South Africa | 92.5 /100 | #122 | Exceptional 56.7% |
| Australians | 91.8 /100 | #123 | Exceptional 56.7% |
| New Zealanders | 91.8 /100 | #124 | Exceptional 56.7% |
| Tsimshian | 91.6 /100 | #125 | Exceptional 56.7% |
| Estonians | 90.9 /100 | #126 | Exceptional 56.6% |
| Immigrants | Thailand | 90.7 /100 | #127 | Exceptional 56.6% |
| Immigrants | South Central Asia | 90.5 /100 | #128 | Exceptional 56.6% |
| Ute | 90.4 /100 | #129 | Exceptional 56.6% |
| Yugoslavians | 90.0 /100 | #130 | Exceptional 56.6% |
| Bulgarians | 89.7 /100 | #131 | Excellent 56.5% |
| Hungarians | 89.1 /100 | #132 | Excellent 56.5% |
Demographics Similar to Immigrants from Jamaica by 2 or more Vehicles in Household
In terms of 2 or more vehicles in household, the demographic groups most similar to Immigrants from Jamaica are Senegalese (44.2%, a difference of 0.55%), Immigrants from Caribbean (44.2%, a difference of 0.57%), Immigrants from Cabo Verde (43.3%, a difference of 2.6%), Soviet Union (45.7%, a difference of 2.9%), and Jamaican (45.8%, a difference of 2.9%).
| Demographics | Rating | Rank | 2 or more Vehicles in Household |
| Immigrants | Ghana | 0.0 /100 | #314 | Tragic 47.4% |
| Puerto Ricans | 0.0 /100 | #315 | Tragic 47.1% |
| Cape Verdeans | 0.0 /100 | #316 | Tragic 46.8% |
| Immigrants | Haiti | 0.0 /100 | #317 | Tragic 46.5% |
| Immigrants | Albania | 0.0 /100 | #318 | Tragic 46.0% |
| Jamaicans | 0.0 /100 | #319 | Tragic 45.8% |
| Soviet Union | 0.0 /100 | #320 | Tragic 45.7% |
| Immigrants | Jamaica | 0.0 /100 | #321 | Tragic 44.5% |
| Senegalese | 0.0 /100 | #322 | Tragic 44.2% |
| Immigrants | Caribbean | 0.0 /100 | #323 | Tragic 44.2% |
| Immigrants | Cabo Verde | 0.0 /100 | #324 | Tragic 43.3% |
| Immigrants | West Indies | 0.0 /100 | #325 | Tragic 43.1% |
| Immigrants | Senegal | 0.0 /100 | #326 | Tragic 43.0% |
| Immigrants | Yemen | 0.0 /100 | #327 | Tragic 42.8% |
| Inupiat | 0.0 /100 | #328 | Tragic 42.6% |