Tsimshian Unemployment Among Women with Children Ages 6 to 17 years
COMPARE
Tsimshian
Select to Compare
Unemployment Among Women with Children Ages 6 to 17 years
Tsimshian Unemployment Among Women with Children Ages 6 to 17 years
11.4%
UNEMPLOYMENT | WOMEN W/ CHILDREN 6 TO 17
0.0/ 100
METRIC RATING
332nd/ 347
METRIC RANK
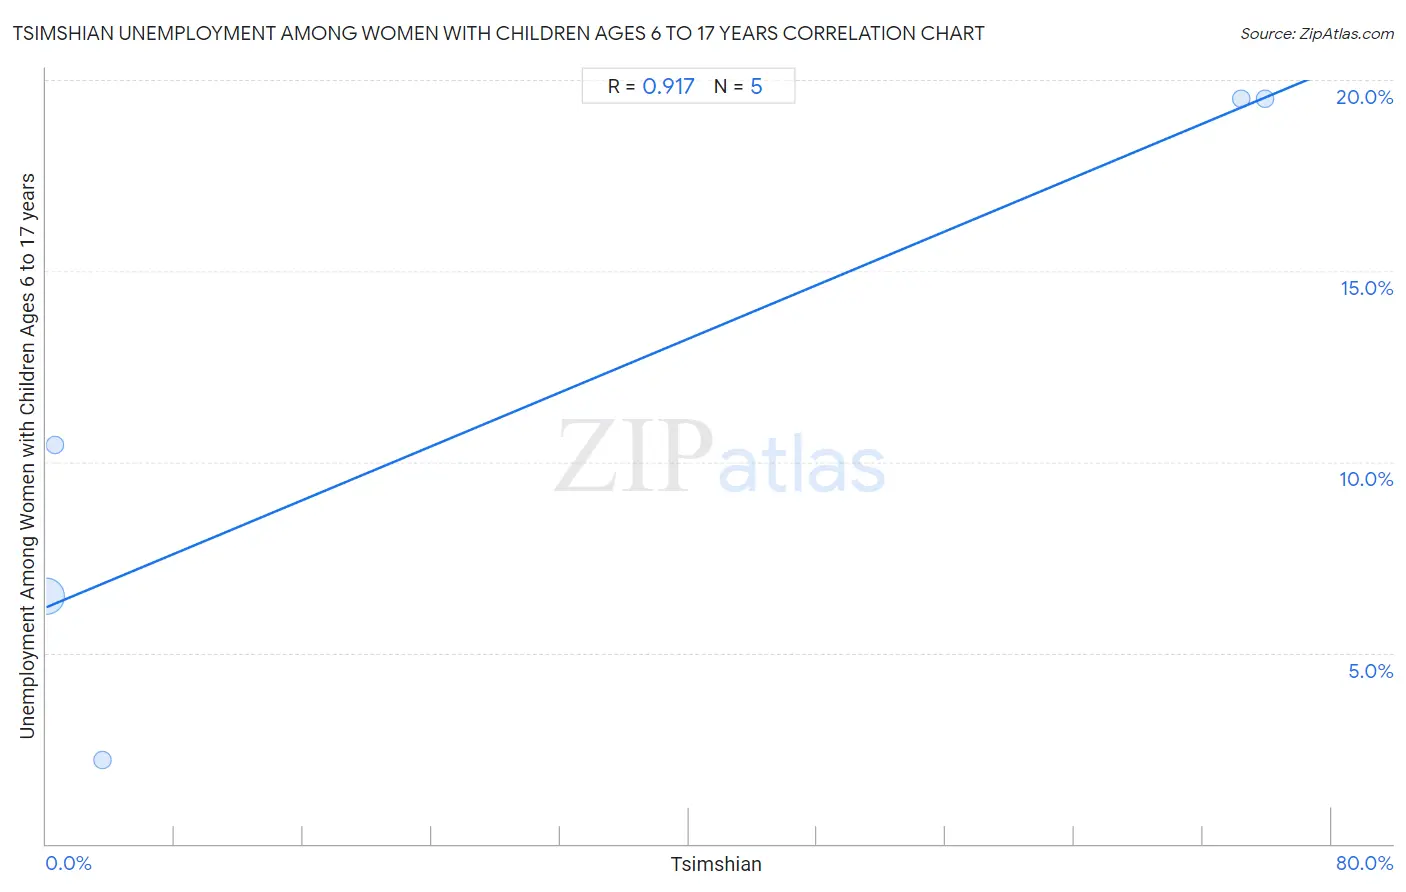
Tsimshian Unemployment Among Women with Children Ages 6 to 17 years Correlation Chart
The statistical analysis conducted on geographies consisting of 14,078,831 people shows a near-perfect positive correlation between the proportion of Tsimshian and unemployment rate among women with children between the ages 6 and 17 in the United States with a correlation coefficient (R) of 0.917 and weighted average of 11.4%. On average, for every 1% (one percent) increase in Tsimshian within a typical geography, there is an increase of 0.18% in unemployment rate among women with children between the ages 6 and 17.
It is essential to understand that the correlation between the percentage of Tsimshian and unemployment rate among women with children between the ages 6 and 17 does not imply a direct cause-and-effect relationship. It remains uncertain whether the presence of Tsimshian influences an upward or downward trend in the level of unemployment rate among women with children between the ages 6 and 17 within an area, or if Tsimshian simply ended up residing in those areas with higher or lower levels of unemployment rate among women with children between the ages 6 and 17 due to other factors.
Demographics Similar to Tsimshian by Unemployment Among Women with Children Ages 6 to 17 years
In terms of unemployment among women with children ages 6 to 17 years, the demographic groups most similar to Tsimshian are Black/African American (11.4%, a difference of 0.11%), Native/Alaskan (11.5%, a difference of 0.63%), Chippewa (11.1%, a difference of 2.7%), Pennsylvania German (11.0%, a difference of 3.2%), and Ottawa (10.9%, a difference of 4.8%).
| Demographics | Rating | Rank | Unemployment Among Women with Children Ages 6 to 17 years |
| Cajuns | 0.0 /100 | #325 | Tragic 10.8% |
| Liberians | 0.0 /100 | #326 | Tragic 10.8% |
| Cape Verdeans | 0.0 /100 | #327 | Tragic 10.9% |
| Ottawa | 0.0 /100 | #328 | Tragic 10.9% |
| Pennsylvania Germans | 0.0 /100 | #329 | Tragic 11.0% |
| Chippewa | 0.0 /100 | #330 | Tragic 11.1% |
| Blacks/African Americans | 0.0 /100 | #331 | Tragic 11.4% |
| Tsimshian | 0.0 /100 | #332 | Tragic 11.4% |
| Natives/Alaskans | 0.0 /100 | #333 | Tragic 11.5% |
| Ugandans | 0.0 /100 | #334 | Tragic 12.0% |
| Colville | 0.0 /100 | #335 | Tragic 12.3% |
| Houma | 0.0 /100 | #336 | Tragic 12.5% |
| Immigrants from Yemen | 0.0 /100 | #337 | Tragic 12.7% |
| Hopi | 0.0 /100 | #338 | Tragic 12.9% |
| Sioux | 0.0 /100 | #339 | Tragic 13.2% |
Tsimshian Unemployment Among Women with Children Ages 6 to 17 years Correlation Summary
| Measurement | Tsimshian Data | Unemployment Among Women with Children Ages 6 to 17 years Data |
| Minimum | 0.019% | 2.2% |
| Maximum | 75.9% | 19.5% |
| Range | 75.8% | 17.3% |
| Mean | 30.9% | 11.6% |
| Median | 3.5% | 10.4% |
| Interquartile 25% (IQ1) | 0.30% | 4.3% |
| Interquartile 75% (IQ3) | 75.1% | 19.5% |
| Interquartile Range (IQR) | 74.8% | 15.2% |
| Standard Deviation (Sample) | 40.4% | 7.8% |
| Standard Deviation (Population) | 36.2% | 6.9% |
Correlation Details
| Tsimshian Percentile | Sample Size | Unemployment Among Women with Children Ages 6 to 17 years |
[ 0.0% - 0.5% ] 0.019% | 14,018,441 | 6.5% |
[ 0.5% - 1.0% ] 0.57% | 43,575 | 10.4% |
[ 3.0% - 3.5% ] 3.46% | 13,913 | 2.2% |
[ 74.0% - 74.5% ] 74.40% | 1,465 | 19.5% |
[ 75.5% - 76.0% ] 75.85% | 1,437 | 19.5% |