Seminole vs Immigrants from Europe 4 or more Vehicles in Household
COMPARE
Seminole
Immigrants from Europe
4 or more Vehicles in Household
4 or more Vehicles in Household Comparison
Seminole
Immigrants from Europe
7.0%
4 OR MORE VEHICLES IN HOUSEHOLD
98.8/ 100
METRIC RATING
99th/ 347
METRIC RANK
5.7%
4 OR MORE VEHICLES IN HOUSEHOLD
2.3/ 100
METRIC RATING
250th/ 347
METRIC RANK
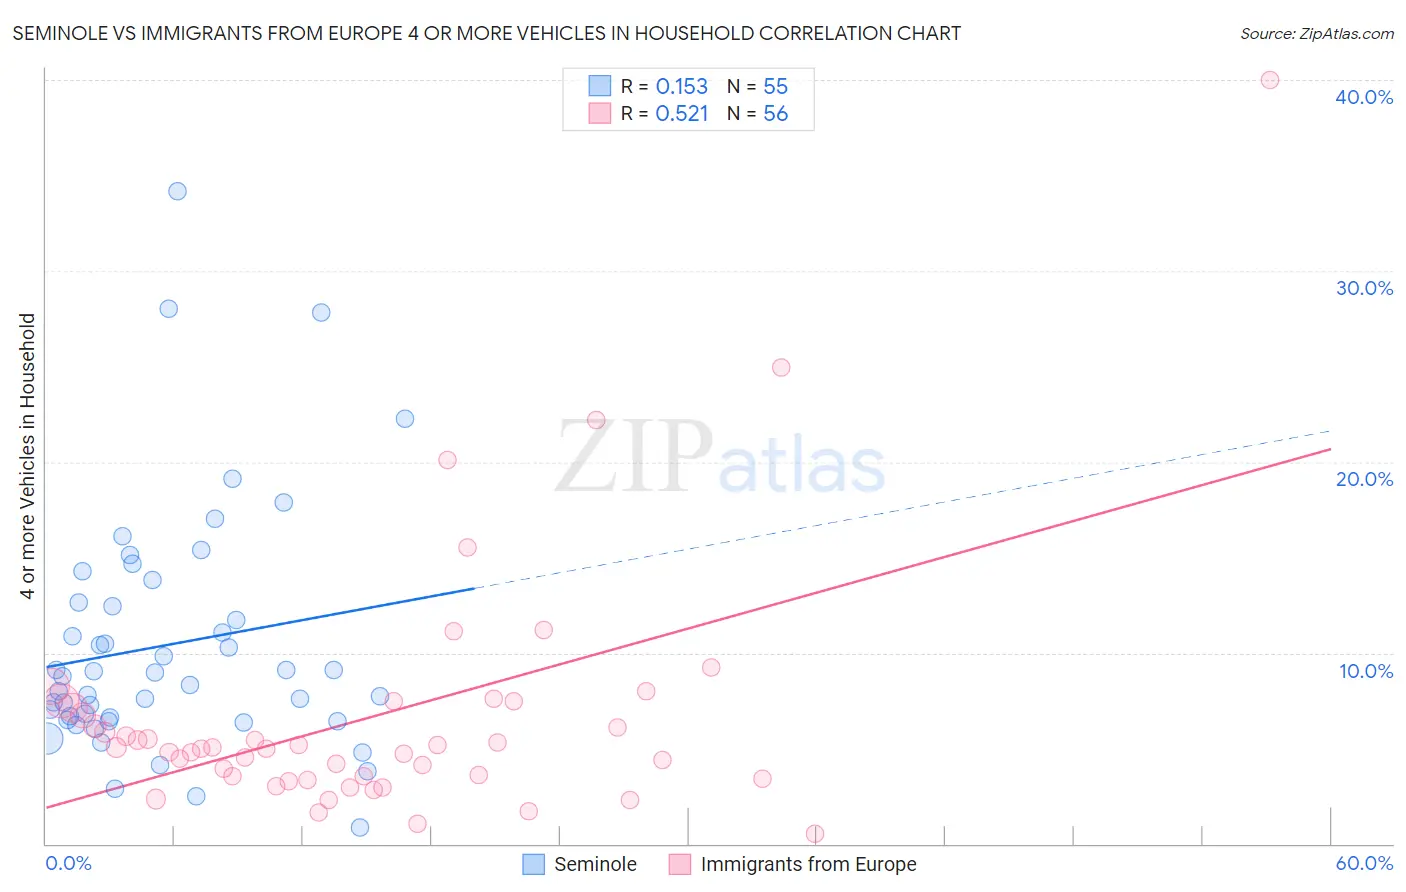
Seminole vs Immigrants from Europe 4 or more Vehicles in Household Correlation Chart
The statistical analysis conducted on geographies consisting of 118,205,543 people shows a poor positive correlation between the proportion of Seminole and percentage of households with 4 or more vehicles available in the United States with a correlation coefficient (R) of 0.153 and weighted average of 7.0%. Similarly, the statistical analysis conducted on geographies consisting of 544,257,144 people shows a substantial positive correlation between the proportion of Immigrants from Europe and percentage of households with 4 or more vehicles available in the United States with a correlation coefficient (R) of 0.521 and weighted average of 5.7%, a difference of 22.8%.
4 or more Vehicles in Household Correlation Summary
| Measurement | Seminole | Immigrants from Europe |
| Minimum | 0.87% | 0.50% |
| Maximum | 34.2% | 40.0% |
| Range | 33.3% | 39.5% |
| Mean | 10.4% | 6.7% |
| Median | 8.8% | 5.0% |
| Interquartile 25% (IQ1) | 6.4% | 3.5% |
| Interquartile 75% (IQ3) | 12.6% | 7.3% |
| Interquartile Range (IQR) | 6.2% | 3.8% |
| Standard Deviation (Sample) | 6.4% | 6.6% |
| Standard Deviation (Population) | 6.4% | 6.5% |
Similar Demographics by 4 or more Vehicles in Household
Demographics Similar to Seminole by 4 or more Vehicles in Household
In terms of 4 or more vehicles in household, the demographic groups most similar to Seminole are Taiwanese (7.0%, a difference of 0.080%), Pakistani (7.0%, a difference of 0.15%), Asian (7.0%, a difference of 0.21%), Blackfeet (7.0%, a difference of 0.22%), and Irish (7.1%, a difference of 0.44%).
| Demographics | Rating | Rank | 4 or more Vehicles in Household |
| Immigrants | Latin America | 99.4 /100 | #92 | Exceptional 7.1% |
| Immigrants | Afghanistan | 99.3 /100 | #93 | Exceptional 7.1% |
| Dutch West Indians | 99.3 /100 | #94 | Exceptional 7.1% |
| Czechoslovakians | 99.3 /100 | #95 | Exceptional 7.1% |
| Central Americans | 99.3 /100 | #96 | Exceptional 7.1% |
| Celtics | 99.1 /100 | #97 | Exceptional 7.1% |
| Irish | 99.0 /100 | #98 | Exceptional 7.1% |
| Seminole | 98.8 /100 | #99 | Exceptional 7.0% |
| Taiwanese | 98.7 /100 | #100 | Exceptional 7.0% |
| Pakistanis | 98.7 /100 | #101 | Exceptional 7.0% |
| Asians | 98.6 /100 | #102 | Exceptional 7.0% |
| Blackfeet | 98.6 /100 | #103 | Exceptional 7.0% |
| Hmong | 98.3 /100 | #104 | Exceptional 7.0% |
| German Russians | 98.3 /100 | #105 | Exceptional 7.0% |
| Guatemalans | 98.1 /100 | #106 | Exceptional 7.0% |
Demographics Similar to Immigrants from Europe by 4 or more Vehicles in Household
In terms of 4 or more vehicles in household, the demographic groups most similar to Immigrants from Europe are Ugandan (5.7%, a difference of 0.020%), Immigrants from Southern Europe (5.7%, a difference of 0.10%), Immigrants from Eastern Africa (5.7%, a difference of 0.12%), Immigrants from Ethiopia (5.7%, a difference of 0.23%), and Subsaharan African (5.7%, a difference of 0.25%).
| Demographics | Rating | Rank | 4 or more Vehicles in Household |
| Immigrants | Czechoslovakia | 3.2 /100 | #243 | Tragic 5.8% |
| Ethiopians | 3.2 /100 | #244 | Tragic 5.8% |
| Bulgarians | 3.1 /100 | #245 | Tragic 5.8% |
| Immigrants | North Macedonia | 2.5 /100 | #246 | Tragic 5.7% |
| Immigrants | Ethiopia | 2.4 /100 | #247 | Tragic 5.7% |
| Immigrants | Eastern Africa | 2.4 /100 | #248 | Tragic 5.7% |
| Immigrants | Southern Europe | 2.3 /100 | #249 | Tragic 5.7% |
| Immigrants | Europe | 2.3 /100 | #250 | Tragic 5.7% |
| Ugandans | 2.2 /100 | #251 | Tragic 5.7% |
| Sub-Saharan Africans | 2.1 /100 | #252 | Tragic 5.7% |
| Immigrants | Cuba | 1.6 /100 | #253 | Tragic 5.7% |
| Immigrants | Panama | 1.5 /100 | #254 | Tragic 5.7% |
| Yup'ik | 1.5 /100 | #255 | Tragic 5.7% |
| Immigrants | Turkey | 1.5 /100 | #256 | Tragic 5.7% |
| Immigrants | Northern Africa | 1.4 /100 | #257 | Tragic 5.6% |