Japanese vs Immigrants from China 2 or more Vehicles in Household
COMPARE
Japanese
Immigrants from China
2 or more Vehicles in Household
2 or more Vehicles in Household Comparison
Japanese
Immigrants from China
57.5%
2 OR MORE VEHICLES IN HOUSEHOLD
98.0/ 100
METRIC RATING
110th/ 347
METRIC RANK
51.5%
2 OR MORE VEHICLES IN HOUSEHOLD
0.1/ 100
METRIC RATING
283rd/ 347
METRIC RANK
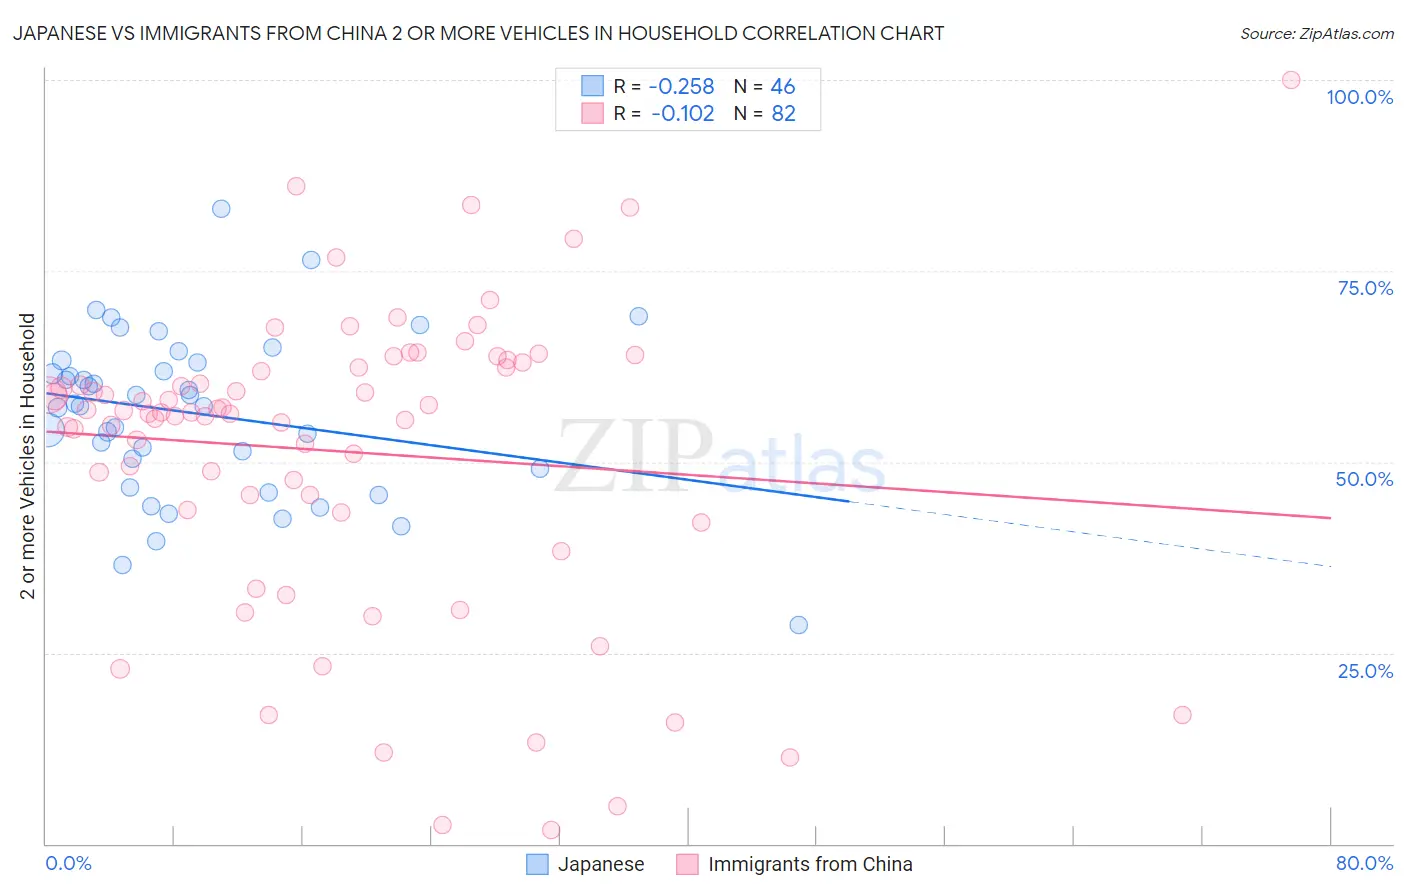
Japanese vs Immigrants from China 2 or more Vehicles in Household Correlation Chart
The statistical analysis conducted on geographies consisting of 249,112,523 people shows a weak negative correlation between the proportion of Japanese and percentage of households with 2 or more vehicles available in the United States with a correlation coefficient (R) of -0.258 and weighted average of 57.5%. Similarly, the statistical analysis conducted on geographies consisting of 456,653,967 people shows a poor negative correlation between the proportion of Immigrants from China and percentage of households with 2 or more vehicles available in the United States with a correlation coefficient (R) of -0.102 and weighted average of 51.5%, a difference of 11.7%.
2 or more Vehicles in Household Correlation Summary
| Measurement | Japanese | Immigrants from China |
| Minimum | 28.6% | 1.8% |
| Maximum | 83.2% | 100.0% |
| Range | 54.6% | 98.2% |
| Mean | 56.3% | 51.4% |
| Median | 57.5% | 56.4% |
| Interquartile 25% (IQ1) | 49.1% | 43.8% |
| Interquartile 75% (IQ3) | 63.0% | 62.3% |
| Interquartile Range (IQR) | 13.8% | 18.6% |
| Standard Deviation (Sample) | 10.8% | 19.7% |
| Standard Deviation (Population) | 10.6% | 19.6% |
Similar Demographics by 2 or more Vehicles in Household
Demographics Similar to Japanese by 2 or more Vehicles in Household
In terms of 2 or more vehicles in household, the demographic groups most similar to Japanese are Immigrants from North America (57.5%, a difference of 0.020%), Greek (57.5%, a difference of 0.030%), Pueblo (57.5%, a difference of 0.040%), Immigrants from Canada (57.5%, a difference of 0.050%), and Immigrants from Netherlands (57.5%, a difference of 0.060%).
| Demographics | Rating | Rank | 2 or more Vehicles in Household |
| Jordanians | 98.2 /100 | #103 | Exceptional 57.6% |
| Immigrants | Indonesia | 98.2 /100 | #104 | Exceptional 57.6% |
| Immigrants | Korea | 98.2 /100 | #105 | Exceptional 57.6% |
| Immigrants | Oceania | 98.2 /100 | #106 | Exceptional 57.5% |
| Immigrants | Netherlands | 98.2 /100 | #107 | Exceptional 57.5% |
| Immigrants | Canada | 98.1 /100 | #108 | Exceptional 57.5% |
| Immigrants | North America | 98.1 /100 | #109 | Exceptional 57.5% |
| Japanese | 98.0 /100 | #110 | Exceptional 57.5% |
| Greeks | 98.0 /100 | #111 | Exceptional 57.5% |
| Pueblo | 98.0 /100 | #112 | Exceptional 57.5% |
| Zimbabweans | 96.9 /100 | #113 | Exceptional 57.2% |
| Immigrants | Lebanon | 96.8 /100 | #114 | Exceptional 57.2% |
| Chippewa | 96.6 /100 | #115 | Exceptional 57.2% |
| Immigrants | Jordan | 96.6 /100 | #116 | Exceptional 57.2% |
| Iraqis | 95.8 /100 | #117 | Exceptional 57.1% |
Demographics Similar to Immigrants from China by 2 or more Vehicles in Household
In terms of 2 or more vehicles in household, the demographic groups most similar to Immigrants from China are Immigrants from Zaire (51.5%, a difference of 0.040%), Bahamian (51.5%, a difference of 0.080%), Immigrants from Kazakhstan (51.6%, a difference of 0.14%), Immigrants from Uruguay (51.4%, a difference of 0.20%), and Immigrants from Liberia (51.3%, a difference of 0.34%).
| Demographics | Rating | Rank | 2 or more Vehicles in Household |
| Immigrants | Croatia | 0.2 /100 | #276 | Tragic 51.8% |
| Immigrants | Africa | 0.2 /100 | #277 | Tragic 51.8% |
| Yuman | 0.1 /100 | #278 | Tragic 51.7% |
| Liberians | 0.1 /100 | #279 | Tragic 51.7% |
| Immigrants | Eastern Europe | 0.1 /100 | #280 | Tragic 51.7% |
| Immigrants | Kazakhstan | 0.1 /100 | #281 | Tragic 51.6% |
| Bahamians | 0.1 /100 | #282 | Tragic 51.5% |
| Immigrants | China | 0.1 /100 | #283 | Tragic 51.5% |
| Immigrants | Zaire | 0.1 /100 | #284 | Tragic 51.5% |
| Immigrants | Uruguay | 0.1 /100 | #285 | Tragic 51.4% |
| Immigrants | Liberia | 0.1 /100 | #286 | Tragic 51.3% |
| Immigrants | Serbia | 0.1 /100 | #287 | Tragic 51.3% |
| Okinawans | 0.1 /100 | #288 | Tragic 51.2% |
| Somalis | 0.0 /100 | #289 | Tragic 51.1% |
| Immigrants | Panama | 0.0 /100 | #290 | Tragic 51.1% |