Japanese vs Immigrants from Denmark 2 or more Vehicles in Household
COMPARE
Japanese
Immigrants from Denmark
2 or more Vehicles in Household
2 or more Vehicles in Household Comparison
Japanese
Immigrants from Denmark
57.5%
2 OR MORE VEHICLES IN HOUSEHOLD
98.0/ 100
METRIC RATING
110th/ 347
METRIC RANK
55.3%
2 OR MORE VEHICLES IN HOUSEHOLD
49.4/ 100
METRIC RATING
175th/ 347
METRIC RANK
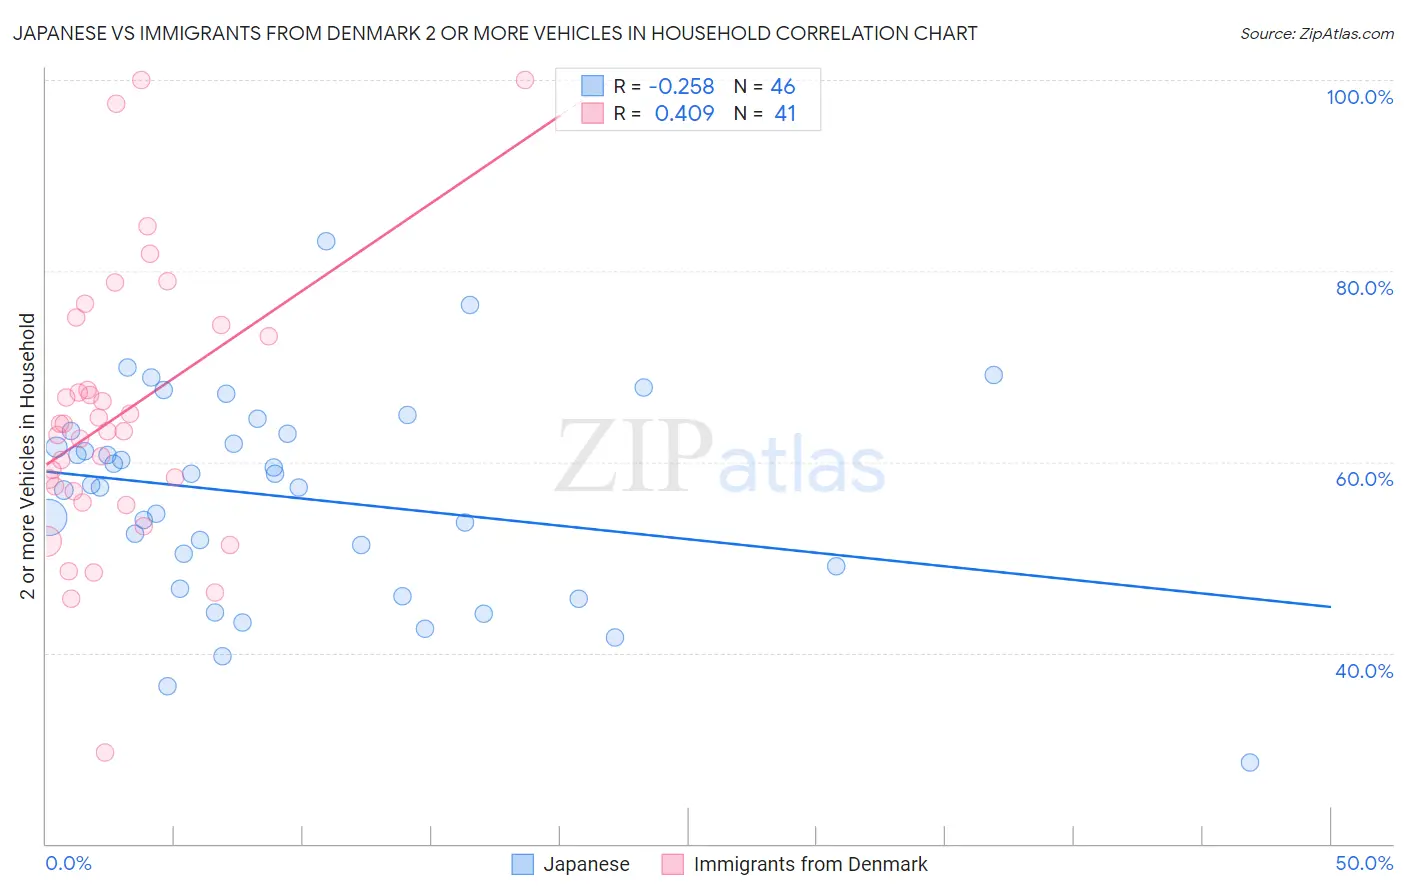
Japanese vs Immigrants from Denmark 2 or more Vehicles in Household Correlation Chart
The statistical analysis conducted on geographies consisting of 249,112,523 people shows a weak negative correlation between the proportion of Japanese and percentage of households with 2 or more vehicles available in the United States with a correlation coefficient (R) of -0.258 and weighted average of 57.5%. Similarly, the statistical analysis conducted on geographies consisting of 136,403,254 people shows a moderate positive correlation between the proportion of Immigrants from Denmark and percentage of households with 2 or more vehicles available in the United States with a correlation coefficient (R) of 0.409 and weighted average of 55.3%, a difference of 3.9%.
2 or more Vehicles in Household Correlation Summary
| Measurement | Japanese | Immigrants from Denmark |
| Minimum | 28.6% | 29.6% |
| Maximum | 83.2% | 100.0% |
| Range | 54.6% | 70.4% |
| Mean | 56.3% | 64.9% |
| Median | 57.5% | 63.2% |
| Interquartile 25% (IQ1) | 49.1% | 56.3% |
| Interquartile 75% (IQ3) | 63.0% | 73.8% |
| Interquartile Range (IQR) | 13.8% | 17.5% |
| Standard Deviation (Sample) | 10.8% | 14.6% |
| Standard Deviation (Population) | 10.6% | 14.4% |
Similar Demographics by 2 or more Vehicles in Household
Demographics Similar to Japanese by 2 or more Vehicles in Household
In terms of 2 or more vehicles in household, the demographic groups most similar to Japanese are Immigrants from North America (57.5%, a difference of 0.020%), Greek (57.5%, a difference of 0.030%), Pueblo (57.5%, a difference of 0.040%), Immigrants from Canada (57.5%, a difference of 0.050%), and Immigrants from Netherlands (57.5%, a difference of 0.060%).
| Demographics | Rating | Rank | 2 or more Vehicles in Household |
| Jordanians | 98.2 /100 | #103 | Exceptional 57.6% |
| Immigrants | Indonesia | 98.2 /100 | #104 | Exceptional 57.6% |
| Immigrants | Korea | 98.2 /100 | #105 | Exceptional 57.6% |
| Immigrants | Oceania | 98.2 /100 | #106 | Exceptional 57.5% |
| Immigrants | Netherlands | 98.2 /100 | #107 | Exceptional 57.5% |
| Immigrants | Canada | 98.1 /100 | #108 | Exceptional 57.5% |
| Immigrants | North America | 98.1 /100 | #109 | Exceptional 57.5% |
| Japanese | 98.0 /100 | #110 | Exceptional 57.5% |
| Greeks | 98.0 /100 | #111 | Exceptional 57.5% |
| Pueblo | 98.0 /100 | #112 | Exceptional 57.5% |
| Zimbabweans | 96.9 /100 | #113 | Exceptional 57.2% |
| Immigrants | Lebanon | 96.8 /100 | #114 | Exceptional 57.2% |
| Chippewa | 96.6 /100 | #115 | Exceptional 57.2% |
| Immigrants | Jordan | 96.6 /100 | #116 | Exceptional 57.2% |
| Iraqis | 95.8 /100 | #117 | Exceptional 57.1% |
Demographics Similar to Immigrants from Denmark by 2 or more Vehicles in Household
In terms of 2 or more vehicles in household, the demographic groups most similar to Immigrants from Denmark are Navajo (55.3%, a difference of 0.020%), Immigrants from Western Europe (55.4%, a difference of 0.080%), Immigrants from Nicaragua (55.4%, a difference of 0.090%), Immigrants from Cuba (55.3%, a difference of 0.090%), and Menominee (55.3%, a difference of 0.13%).
| Demographics | Rating | Rank | 2 or more Vehicles in Household |
| French American Indians | 56.7 /100 | #168 | Average 55.5% |
| Immigrants | Austria | 56.3 /100 | #169 | Average 55.5% |
| Romanians | 55.8 /100 | #170 | Average 55.5% |
| Immigrants | Costa Rica | 54.4 /100 | #171 | Average 55.4% |
| Immigrants | Nicaragua | 51.6 /100 | #172 | Average 55.4% |
| Immigrants | Western Europe | 51.4 /100 | #173 | Average 55.4% |
| Navajo | 50.0 /100 | #174 | Average 55.3% |
| Immigrants | Denmark | 49.4 /100 | #175 | Average 55.3% |
| Immigrants | Cuba | 47.0 /100 | #176 | Average 55.3% |
| Menominee | 46.2 /100 | #177 | Average 55.3% |
| Immigrants | Sweden | 45.3 /100 | #178 | Average 55.2% |
| Alaskan Athabascans | 42.9 /100 | #179 | Average 55.2% |
| Immigrants | Kenya | 40.4 /100 | #180 | Average 55.1% |
| Immigrants | Micronesia | 38.2 /100 | #181 | Fair 55.1% |
| Cree | 38.2 /100 | #182 | Fair 55.1% |