Immigrants from Micronesia vs Immigrants from Morocco 2 or more Vehicles in Household
COMPARE
Immigrants from Micronesia
Immigrants from Morocco
2 or more Vehicles in Household
2 or more Vehicles in Household Comparison
Immigrants from Micronesia
Immigrants from Morocco
55.1%
2 OR MORE VEHICLES IN HOUSEHOLD
38.2/ 100
METRIC RATING
181st/ 347
METRIC RANK
50.3%
2 OR MORE VEHICLES IN HOUSEHOLD
0.0/ 100
METRIC RATING
299th/ 347
METRIC RANK
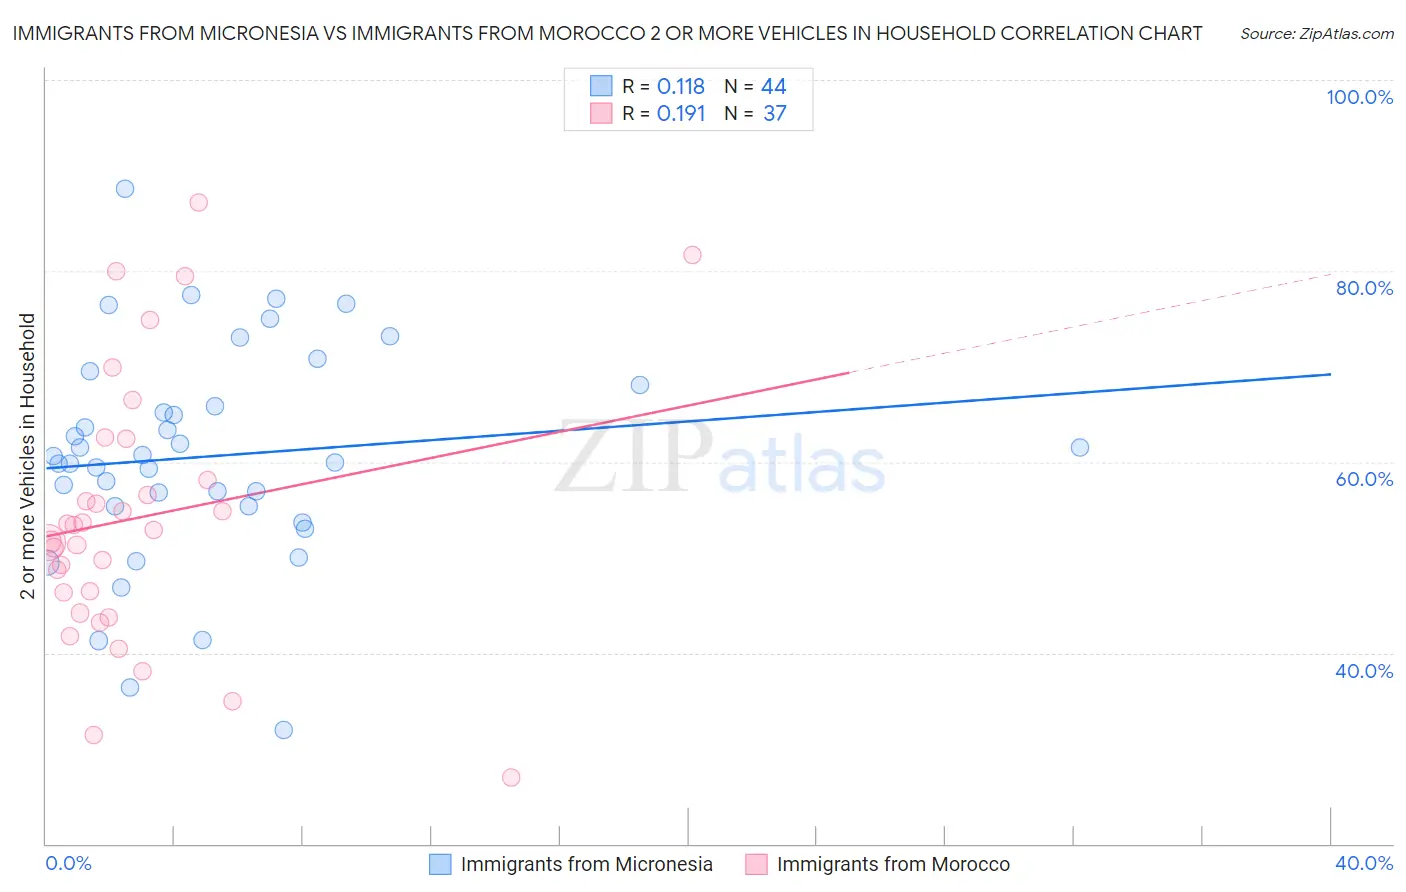
Immigrants from Micronesia vs Immigrants from Morocco 2 or more Vehicles in Household Correlation Chart
The statistical analysis conducted on geographies consisting of 61,601,070 people shows a poor positive correlation between the proportion of Immigrants from Micronesia and percentage of households with 2 or more vehicles available in the United States with a correlation coefficient (R) of 0.118 and weighted average of 55.1%. Similarly, the statistical analysis conducted on geographies consisting of 178,909,930 people shows a poor positive correlation between the proportion of Immigrants from Morocco and percentage of households with 2 or more vehicles available in the United States with a correlation coefficient (R) of 0.191 and weighted average of 50.3%, a difference of 9.5%.
2 or more Vehicles in Household Correlation Summary
| Measurement | Immigrants from Micronesia | Immigrants from Morocco |
| Minimum | 31.9% | 27.0% |
| Maximum | 88.6% | 87.2% |
| Range | 56.6% | 60.2% |
| Mean | 60.6% | 54.2% |
| Median | 60.3% | 52.9% |
| Interquartile 25% (IQ1) | 55.3% | 45.2% |
| Interquartile 75% (IQ3) | 66.9% | 60.3% |
| Interquartile Range (IQR) | 11.6% | 15.0% |
| Standard Deviation (Sample) | 11.4% | 13.9% |
| Standard Deviation (Population) | 11.3% | 13.7% |
Similar Demographics by 2 or more Vehicles in Household
Demographics Similar to Immigrants from Micronesia by 2 or more Vehicles in Household
In terms of 2 or more vehicles in household, the demographic groups most similar to Immigrants from Micronesia are Cree (55.1%, a difference of 0.0%), Immigrants from Cameroon (55.1%, a difference of 0.040%), Apache (55.1%, a difference of 0.060%), Immigrants from Kenya (55.1%, a difference of 0.090%), and Arab (55.0%, a difference of 0.10%).
| Demographics | Rating | Rank | 2 or more Vehicles in Household |
| Navajo | 50.0 /100 | #174 | Average 55.3% |
| Immigrants | Denmark | 49.4 /100 | #175 | Average 55.3% |
| Immigrants | Cuba | 47.0 /100 | #176 | Average 55.3% |
| Menominee | 46.2 /100 | #177 | Average 55.3% |
| Immigrants | Sweden | 45.3 /100 | #178 | Average 55.2% |
| Alaskan Athabascans | 42.9 /100 | #179 | Average 55.2% |
| Immigrants | Kenya | 40.4 /100 | #180 | Average 55.1% |
| Immigrants | Micronesia | 38.2 /100 | #181 | Fair 55.1% |
| Cree | 38.2 /100 | #182 | Fair 55.1% |
| Immigrants | Cameroon | 37.3 /100 | #183 | Fair 55.1% |
| Apache | 36.7 /100 | #184 | Fair 55.1% |
| Arabs | 35.9 /100 | #185 | Fair 55.0% |
| Peruvians | 33.7 /100 | #186 | Fair 55.0% |
| Immigrants | Uganda | 33.4 /100 | #187 | Fair 55.0% |
| Marshallese | 30.5 /100 | #188 | Fair 54.9% |
Demographics Similar to Immigrants from Morocco by 2 or more Vehicles in Household
In terms of 2 or more vehicles in household, the demographic groups most similar to Immigrants from Morocco are Paraguayan (50.3%, a difference of 0.030%), Immigrants from Russia (50.3%, a difference of 0.040%), Immigrants from Spain (50.4%, a difference of 0.16%), Immigrants from Greece (50.2%, a difference of 0.22%), and Immigrants from South America (50.2%, a difference of 0.28%).
| Demographics | Rating | Rank | 2 or more Vehicles in Household |
| Immigrants | Ukraine | 0.0 /100 | #292 | Tragic 50.9% |
| Blacks/African Americans | 0.0 /100 | #293 | Tragic 50.9% |
| Bermudans | 0.0 /100 | #294 | Tragic 50.6% |
| Cypriots | 0.0 /100 | #295 | Tragic 50.6% |
| Immigrants | Somalia | 0.0 /100 | #296 | Tragic 50.5% |
| Immigrants | Spain | 0.0 /100 | #297 | Tragic 50.4% |
| Paraguayans | 0.0 /100 | #298 | Tragic 50.3% |
| Immigrants | Morocco | 0.0 /100 | #299 | Tragic 50.3% |
| Immigrants | Russia | 0.0 /100 | #300 | Tragic 50.3% |
| Immigrants | Greece | 0.0 /100 | #301 | Tragic 50.2% |
| Immigrants | South America | 0.0 /100 | #302 | Tragic 50.2% |
| Tohono O'odham | 0.0 /100 | #303 | Tragic 50.0% |
| Immigrants | Belize | 0.0 /100 | #304 | Tragic 49.9% |
| Immigrants | Western Africa | 0.0 /100 | #305 | Tragic 49.4% |
| Immigrants | Israel | 0.0 /100 | #306 | Tragic 49.2% |