Immigrants from Micronesia vs Immigrants from Peru 2 or more Vehicles in Household
COMPARE
Immigrants from Micronesia
Immigrants from Peru
2 or more Vehicles in Household
2 or more Vehicles in Household Comparison
Immigrants from Micronesia
Immigrants from Peru
55.1%
2 OR MORE VEHICLES IN HOUSEHOLD
38.2/ 100
METRIC RATING
181st/ 347
METRIC RANK
54.4%
2 OR MORE VEHICLES IN HOUSEHOLD
14.3/ 100
METRIC RATING
203rd/ 347
METRIC RANK
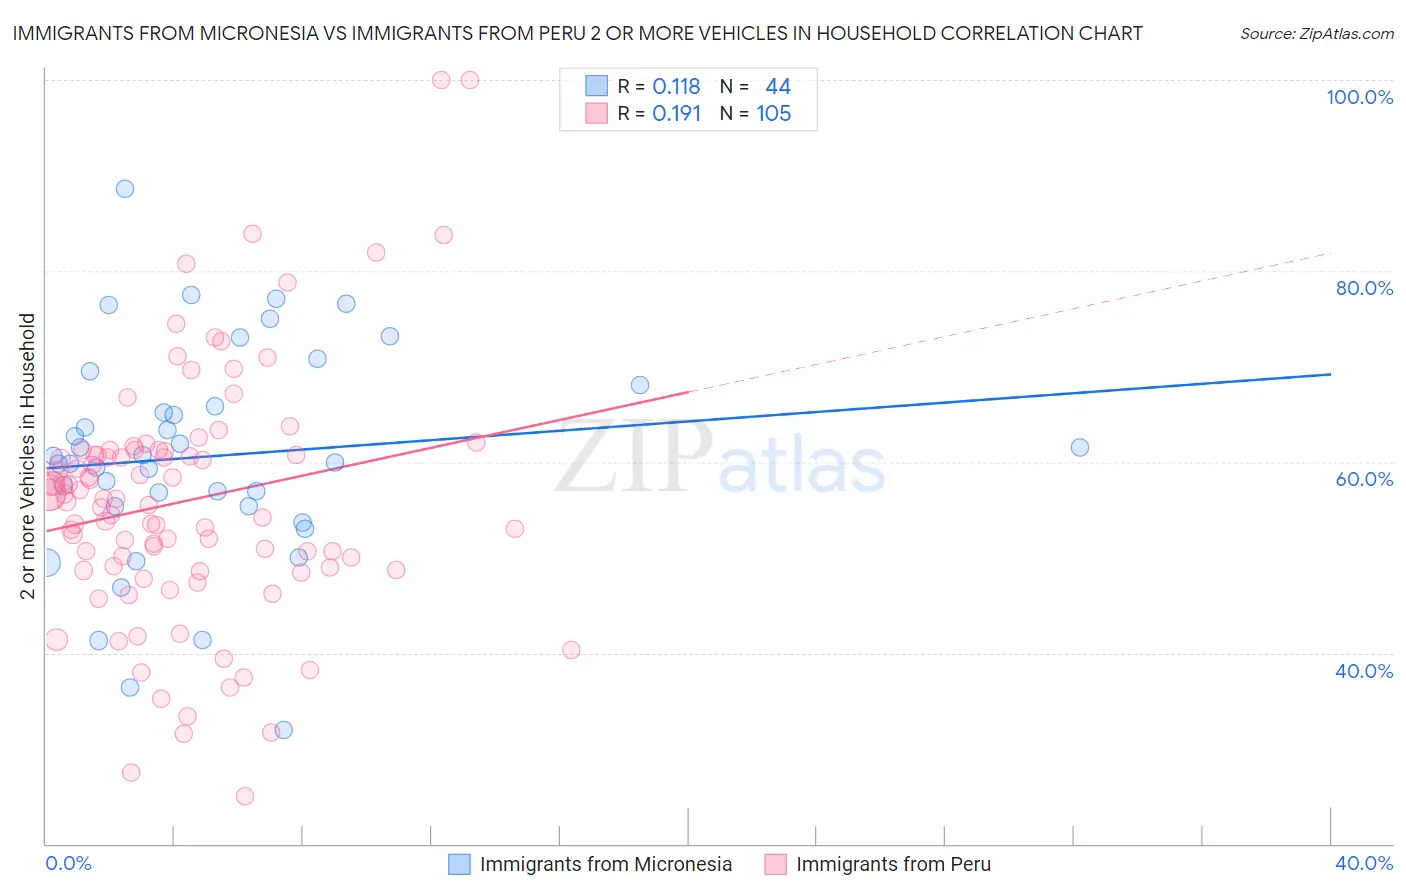
Immigrants from Micronesia vs Immigrants from Peru 2 or more Vehicles in Household Correlation Chart
The statistical analysis conducted on geographies consisting of 61,601,070 people shows a poor positive correlation between the proportion of Immigrants from Micronesia and percentage of households with 2 or more vehicles available in the United States with a correlation coefficient (R) of 0.118 and weighted average of 55.1%. Similarly, the statistical analysis conducted on geographies consisting of 328,775,084 people shows a poor positive correlation between the proportion of Immigrants from Peru and percentage of households with 2 or more vehicles available in the United States with a correlation coefficient (R) of 0.191 and weighted average of 54.4%, a difference of 1.3%.
2 or more Vehicles in Household Correlation Summary
| Measurement | Immigrants from Micronesia | Immigrants from Peru |
| Minimum | 31.9% | 24.9% |
| Maximum | 88.6% | 100.0% |
| Range | 56.6% | 75.1% |
| Mean | 60.6% | 55.9% |
| Median | 60.3% | 56.1% |
| Interquartile 25% (IQ1) | 55.3% | 48.8% |
| Interquartile 75% (IQ3) | 66.9% | 61.2% |
| Interquartile Range (IQR) | 11.6% | 12.4% |
| Standard Deviation (Sample) | 11.4% | 13.0% |
| Standard Deviation (Population) | 11.3% | 13.0% |
Similar Demographics by 2 or more Vehicles in Household
Demographics Similar to Immigrants from Micronesia by 2 or more Vehicles in Household
In terms of 2 or more vehicles in household, the demographic groups most similar to Immigrants from Micronesia are Cree (55.1%, a difference of 0.0%), Immigrants from Cameroon (55.1%, a difference of 0.040%), Apache (55.1%, a difference of 0.060%), Immigrants from Kenya (55.1%, a difference of 0.090%), and Arab (55.0%, a difference of 0.10%).
| Demographics | Rating | Rank | 2 or more Vehicles in Household |
| Navajo | 50.0 /100 | #174 | Average 55.3% |
| Immigrants | Denmark | 49.4 /100 | #175 | Average 55.3% |
| Immigrants | Cuba | 47.0 /100 | #176 | Average 55.3% |
| Menominee | 46.2 /100 | #177 | Average 55.3% |
| Immigrants | Sweden | 45.3 /100 | #178 | Average 55.2% |
| Alaskan Athabascans | 42.9 /100 | #179 | Average 55.2% |
| Immigrants | Kenya | 40.4 /100 | #180 | Average 55.1% |
| Immigrants | Micronesia | 38.2 /100 | #181 | Fair 55.1% |
| Cree | 38.2 /100 | #182 | Fair 55.1% |
| Immigrants | Cameroon | 37.3 /100 | #183 | Fair 55.1% |
| Apache | 36.7 /100 | #184 | Fair 55.1% |
| Arabs | 35.9 /100 | #185 | Fair 55.0% |
| Peruvians | 33.7 /100 | #186 | Fair 55.0% |
| Immigrants | Uganda | 33.4 /100 | #187 | Fair 55.0% |
| Marshallese | 30.5 /100 | #188 | Fair 54.9% |
Demographics Similar to Immigrants from Peru by 2 or more Vehicles in Household
In terms of 2 or more vehicles in household, the demographic groups most similar to Immigrants from Peru are Immigrants from North Macedonia (54.4%, a difference of 0.040%), Immigrants from Belgium (54.3%, a difference of 0.050%), Cheyenne (54.3%, a difference of 0.060%), Immigrants from Italy (54.4%, a difference of 0.090%), and Immigrants from Latin America (54.3%, a difference of 0.11%).
| Demographics | Rating | Rank | 2 or more Vehicles in Household |
| Immigrants | Poland | 19.3 /100 | #196 | Poor 54.6% |
| Argentineans | 17.5 /100 | #197 | Poor 54.5% |
| Carpatho Rusyns | 16.2 /100 | #198 | Poor 54.4% |
| Immigrants | Norway | 15.9 /100 | #199 | Poor 54.4% |
| Houma | 15.8 /100 | #200 | Poor 54.4% |
| Immigrants | Italy | 15.5 /100 | #201 | Poor 54.4% |
| Immigrants | North Macedonia | 14.9 /100 | #202 | Poor 54.4% |
| Immigrants | Peru | 14.3 /100 | #203 | Poor 54.4% |
| Immigrants | Belgium | 13.7 /100 | #204 | Poor 54.3% |
| Cheyenne | 13.6 /100 | #205 | Poor 54.3% |
| Immigrants | Latin America | 13.1 /100 | #206 | Poor 54.3% |
| Turks | 13.0 /100 | #207 | Poor 54.3% |
| Egyptians | 12.0 /100 | #208 | Poor 54.3% |
| Immigrants | Bulgaria | 12.0 /100 | #209 | Poor 54.3% |
| Immigrants | Saudi Arabia | 11.3 /100 | #210 | Poor 54.2% |