Immigrants from Europe vs Dominican 2 or more Vehicles in Household
COMPARE
Immigrants from Europe
Dominican
2 or more Vehicles in Household
2 or more Vehicles in Household Comparison
Immigrants from Europe
Dominicans
53.2%
2 OR MORE VEHICLES IN HOUSEHOLD
2.1/ 100
METRIC RATING
240th/ 347
METRIC RANK
35.3%
2 OR MORE VEHICLES IN HOUSEHOLD
0.0/ 100
METRIC RATING
342nd/ 347
METRIC RANK
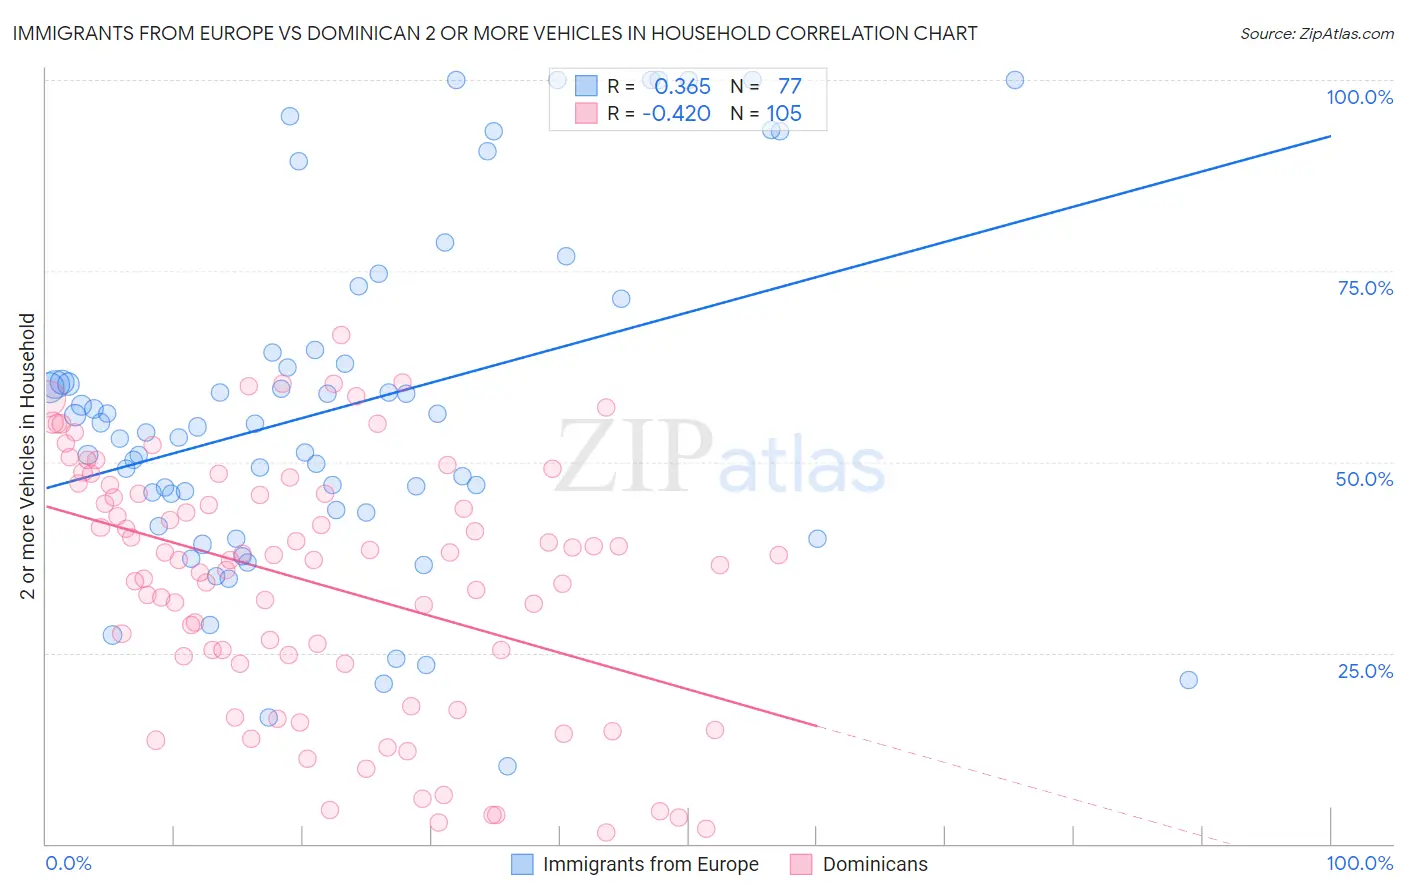
Immigrants from Europe vs Dominican 2 or more Vehicles in Household Correlation Chart
The statistical analysis conducted on geographies consisting of 546,948,405 people shows a mild positive correlation between the proportion of Immigrants from Europe and percentage of households with 2 or more vehicles available in the United States with a correlation coefficient (R) of 0.365 and weighted average of 53.2%. Similarly, the statistical analysis conducted on geographies consisting of 354,794,588 people shows a moderate negative correlation between the proportion of Dominicans and percentage of households with 2 or more vehicles available in the United States with a correlation coefficient (R) of -0.420 and weighted average of 35.3%, a difference of 50.7%.
2 or more Vehicles in Household Correlation Summary
| Measurement | Immigrants from Europe | Dominican |
| Minimum | 10.1% | 1.5% |
| Maximum | 100.0% | 66.7% |
| Range | 89.9% | 65.2% |
| Mean | 57.0% | 34.3% |
| Median | 54.6% | 37.2% |
| Interquartile 25% (IQ1) | 43.6% | 24.0% |
| Interquartile 75% (IQ3) | 64.5% | 46.4% |
| Interquartile Range (IQR) | 20.9% | 22.4% |
| Standard Deviation (Sample) | 22.4% | 16.4% |
| Standard Deviation (Population) | 22.2% | 16.3% |
Similar Demographics by 2 or more Vehicles in Household
Demographics Similar to Immigrants from Europe by 2 or more Vehicles in Household
In terms of 2 or more vehicles in household, the demographic groups most similar to Immigrants from Europe are Immigrants from Sierra Leone (53.2%, a difference of 0.030%), Immigrants from Eastern Asia (53.2%, a difference of 0.030%), Immigrants from Armenia (53.3%, a difference of 0.070%), Cambodian (53.3%, a difference of 0.070%), and Macedonian (53.3%, a difference of 0.14%).
| Demographics | Rating | Rank | 2 or more Vehicles in Household |
| Ugandans | 3.2 /100 | #233 | Tragic 53.5% |
| Immigrants | Switzerland | 3.0 /100 | #234 | Tragic 53.4% |
| Immigrants | Middle Africa | 3.0 /100 | #235 | Tragic 53.4% |
| Indonesians | 2.7 /100 | #236 | Tragic 53.4% |
| Macedonians | 2.4 /100 | #237 | Tragic 53.3% |
| Immigrants | Armenia | 2.3 /100 | #238 | Tragic 53.3% |
| Cambodians | 2.3 /100 | #239 | Tragic 53.3% |
| Immigrants | Europe | 2.1 /100 | #240 | Tragic 53.2% |
| Immigrants | Sierra Leone | 2.1 /100 | #241 | Tragic 53.2% |
| Immigrants | Eastern Asia | 2.1 /100 | #242 | Tragic 53.2% |
| Ethiopians | 1.7 /100 | #243 | Tragic 53.1% |
| Indians (Asian) | 1.7 /100 | #244 | Tragic 53.1% |
| Immigrants | Ethiopia | 1.5 /100 | #245 | Tragic 53.0% |
| Immigrants | Nigeria | 1.2 /100 | #246 | Tragic 52.9% |
| Sierra Leoneans | 1.2 /100 | #247 | Tragic 52.9% |
Demographics Similar to Dominicans by 2 or more Vehicles in Household
In terms of 2 or more vehicles in household, the demographic groups most similar to Dominicans are Guyanese (35.4%, a difference of 0.18%), British West Indian (35.4%, a difference of 0.25%), Immigrants from Guyana (35.0%, a difference of 0.89%), Yup'ik (34.9%, a difference of 1.1%), and Immigrants from Barbados (35.8%, a difference of 1.3%).
| Demographics | Rating | Rank | 2 or more Vehicles in Household |
| Immigrants | Ecuador | 0.0 /100 | #333 | Tragic 40.5% |
| Immigrants | Trinidad and Tobago | 0.0 /100 | #334 | Tragic 40.3% |
| Immigrants | Bangladesh | 0.0 /100 | #335 | Tragic 38.8% |
| Vietnamese | 0.0 /100 | #336 | Tragic 38.5% |
| Barbadians | 0.0 /100 | #337 | Tragic 38.3% |
| Immigrants | Uzbekistan | 0.0 /100 | #338 | Tragic 37.9% |
| Immigrants | Barbados | 0.0 /100 | #339 | Tragic 35.8% |
| British West Indians | 0.0 /100 | #340 | Tragic 35.4% |
| Guyanese | 0.0 /100 | #341 | Tragic 35.4% |
| Dominicans | 0.0 /100 | #342 | Tragic 35.3% |
| Immigrants | Guyana | 0.0 /100 | #343 | Tragic 35.0% |
| Yup'ik | 0.0 /100 | #344 | Tragic 34.9% |
| Immigrants | Dominican Republic | 0.0 /100 | #345 | Tragic 33.2% |
| Immigrants | St. Vincent and the Grenadines | 0.0 /100 | #346 | Tragic 31.0% |
| Immigrants | Grenada | 0.0 /100 | #347 | Tragic 28.7% |