Immigrants from Europe vs Sri Lankan 2 or more Vehicles in Household
COMPARE
Immigrants from Europe
Sri Lankan
2 or more Vehicles in Household
2 or more Vehicles in Household Comparison
Immigrants from Europe
Sri Lankans
53.2%
2 OR MORE VEHICLES IN HOUSEHOLD
2.1/ 100
METRIC RATING
240th/ 347
METRIC RANK
61.0%
2 OR MORE VEHICLES IN HOUSEHOLD
100.0/ 100
METRIC RATING
20th/ 347
METRIC RANK
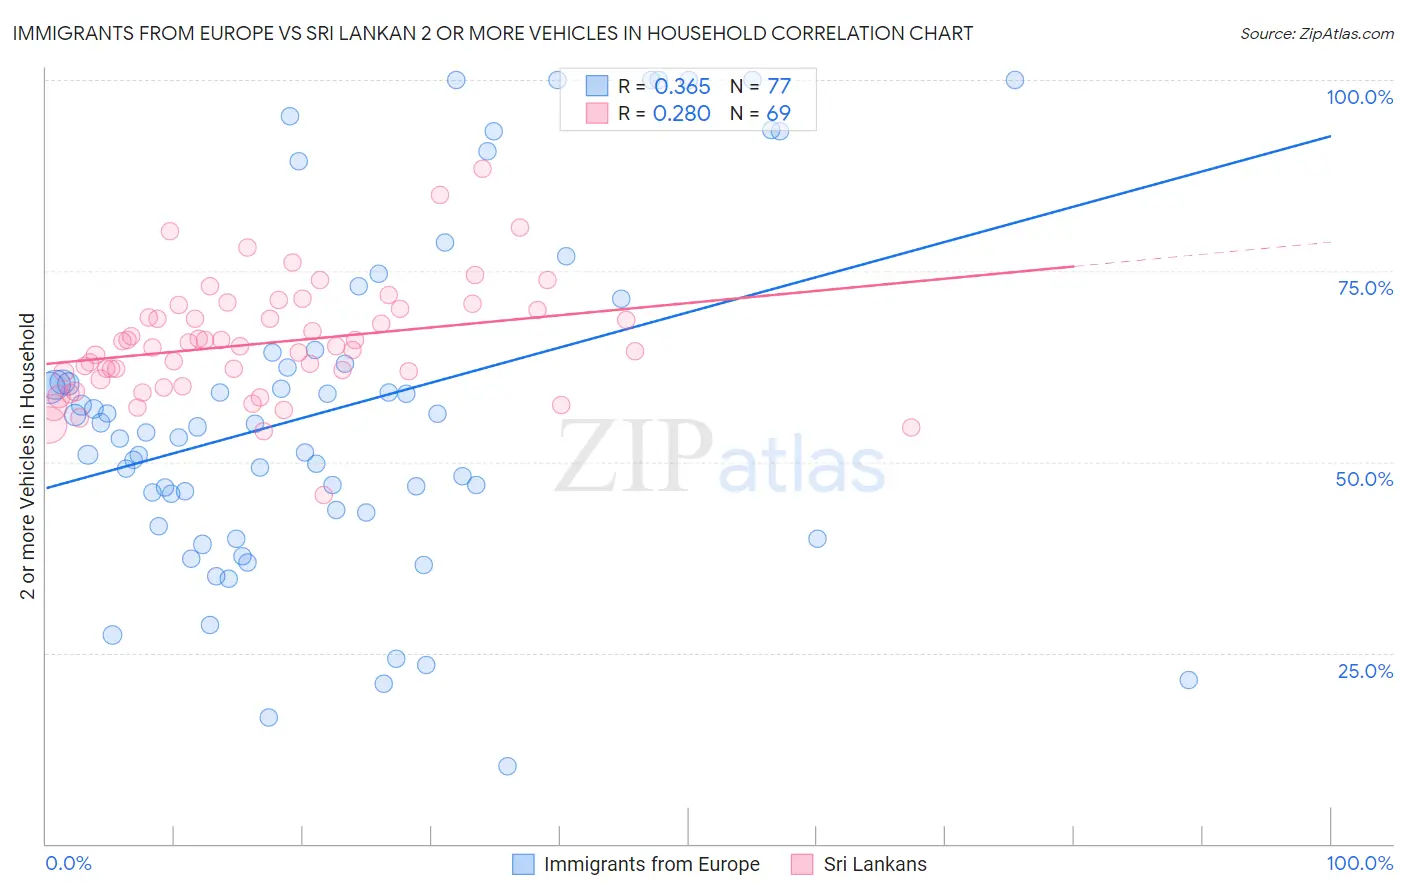
Immigrants from Europe vs Sri Lankan 2 or more Vehicles in Household Correlation Chart
The statistical analysis conducted on geographies consisting of 546,948,405 people shows a mild positive correlation between the proportion of Immigrants from Europe and percentage of households with 2 or more vehicles available in the United States with a correlation coefficient (R) of 0.365 and weighted average of 53.2%. Similarly, the statistical analysis conducted on geographies consisting of 440,160,009 people shows a weak positive correlation between the proportion of Sri Lankans and percentage of households with 2 or more vehicles available in the United States with a correlation coefficient (R) of 0.280 and weighted average of 61.0%, a difference of 14.6%.
2 or more Vehicles in Household Correlation Summary
| Measurement | Immigrants from Europe | Sri Lankan |
| Minimum | 10.1% | 45.6% |
| Maximum | 100.0% | 88.5% |
| Range | 89.9% | 42.8% |
| Mean | 57.0% | 65.5% |
| Median | 54.6% | 65.1% |
| Interquartile 25% (IQ1) | 43.6% | 60.4% |
| Interquartile 75% (IQ3) | 64.5% | 70.0% |
| Interquartile Range (IQR) | 20.9% | 9.6% |
| Standard Deviation (Sample) | 22.4% | 7.5% |
| Standard Deviation (Population) | 22.2% | 7.4% |
Similar Demographics by 2 or more Vehicles in Household
Demographics Similar to Immigrants from Europe by 2 or more Vehicles in Household
In terms of 2 or more vehicles in household, the demographic groups most similar to Immigrants from Europe are Immigrants from Sierra Leone (53.2%, a difference of 0.030%), Immigrants from Eastern Asia (53.2%, a difference of 0.030%), Immigrants from Armenia (53.3%, a difference of 0.070%), Cambodian (53.3%, a difference of 0.070%), and Macedonian (53.3%, a difference of 0.14%).
| Demographics | Rating | Rank | 2 or more Vehicles in Household |
| Ugandans | 3.2 /100 | #233 | Tragic 53.5% |
| Immigrants | Switzerland | 3.0 /100 | #234 | Tragic 53.4% |
| Immigrants | Middle Africa | 3.0 /100 | #235 | Tragic 53.4% |
| Indonesians | 2.7 /100 | #236 | Tragic 53.4% |
| Macedonians | 2.4 /100 | #237 | Tragic 53.3% |
| Immigrants | Armenia | 2.3 /100 | #238 | Tragic 53.3% |
| Cambodians | 2.3 /100 | #239 | Tragic 53.3% |
| Immigrants | Europe | 2.1 /100 | #240 | Tragic 53.2% |
| Immigrants | Sierra Leone | 2.1 /100 | #241 | Tragic 53.2% |
| Immigrants | Eastern Asia | 2.1 /100 | #242 | Tragic 53.2% |
| Ethiopians | 1.7 /100 | #243 | Tragic 53.1% |
| Indians (Asian) | 1.7 /100 | #244 | Tragic 53.1% |
| Immigrants | Ethiopia | 1.5 /100 | #245 | Tragic 53.0% |
| Immigrants | Nigeria | 1.2 /100 | #246 | Tragic 52.9% |
| Sierra Leoneans | 1.2 /100 | #247 | Tragic 52.9% |
Demographics Similar to Sri Lankans by 2 or more Vehicles in Household
In terms of 2 or more vehicles in household, the demographic groups most similar to Sri Lankans are Korean (61.0%, a difference of 0.040%), Swiss (61.0%, a difference of 0.080%), Scotch-Irish (60.9%, a difference of 0.12%), Immigrants from Vietnam (60.9%, a difference of 0.16%), and White/Caucasian (60.8%, a difference of 0.31%).
| Demographics | Rating | Rank | 2 or more Vehicles in Household |
| Samoans | 100.0 /100 | #13 | Exceptional 61.5% |
| Czechs | 100.0 /100 | #14 | Exceptional 61.5% |
| Nepalese | 100.0 /100 | #15 | Exceptional 61.4% |
| Native Hawaiians | 100.0 /100 | #16 | Exceptional 61.4% |
| Basques | 100.0 /100 | #17 | Exceptional 61.4% |
| Europeans | 100.0 /100 | #18 | Exceptional 61.4% |
| Scottish | 100.0 /100 | #19 | Exceptional 61.2% |
| Sri Lankans | 100.0 /100 | #20 | Exceptional 61.0% |
| Koreans | 100.0 /100 | #21 | Exceptional 61.0% |
| Swiss | 100.0 /100 | #22 | Exceptional 61.0% |
| Scotch-Irish | 100.0 /100 | #23 | Exceptional 60.9% |
| Immigrants | Vietnam | 100.0 /100 | #24 | Exceptional 60.9% |
| Whites/Caucasians | 100.0 /100 | #25 | Exceptional 60.8% |
| Welsh | 100.0 /100 | #26 | Exceptional 60.8% |
| Assyrians/Chaldeans/Syriacs | 100.0 /100 | #27 | Exceptional 60.5% |