Immigrants from Europe vs Bahamian 2 or more Vehicles in Household
COMPARE
Immigrants from Europe
Bahamian
2 or more Vehicles in Household
2 or more Vehicles in Household Comparison
Immigrants from Europe
Bahamians
53.2%
2 OR MORE VEHICLES IN HOUSEHOLD
2.1/ 100
METRIC RATING
240th/ 347
METRIC RANK
51.5%
2 OR MORE VEHICLES IN HOUSEHOLD
0.1/ 100
METRIC RATING
282nd/ 347
METRIC RANK
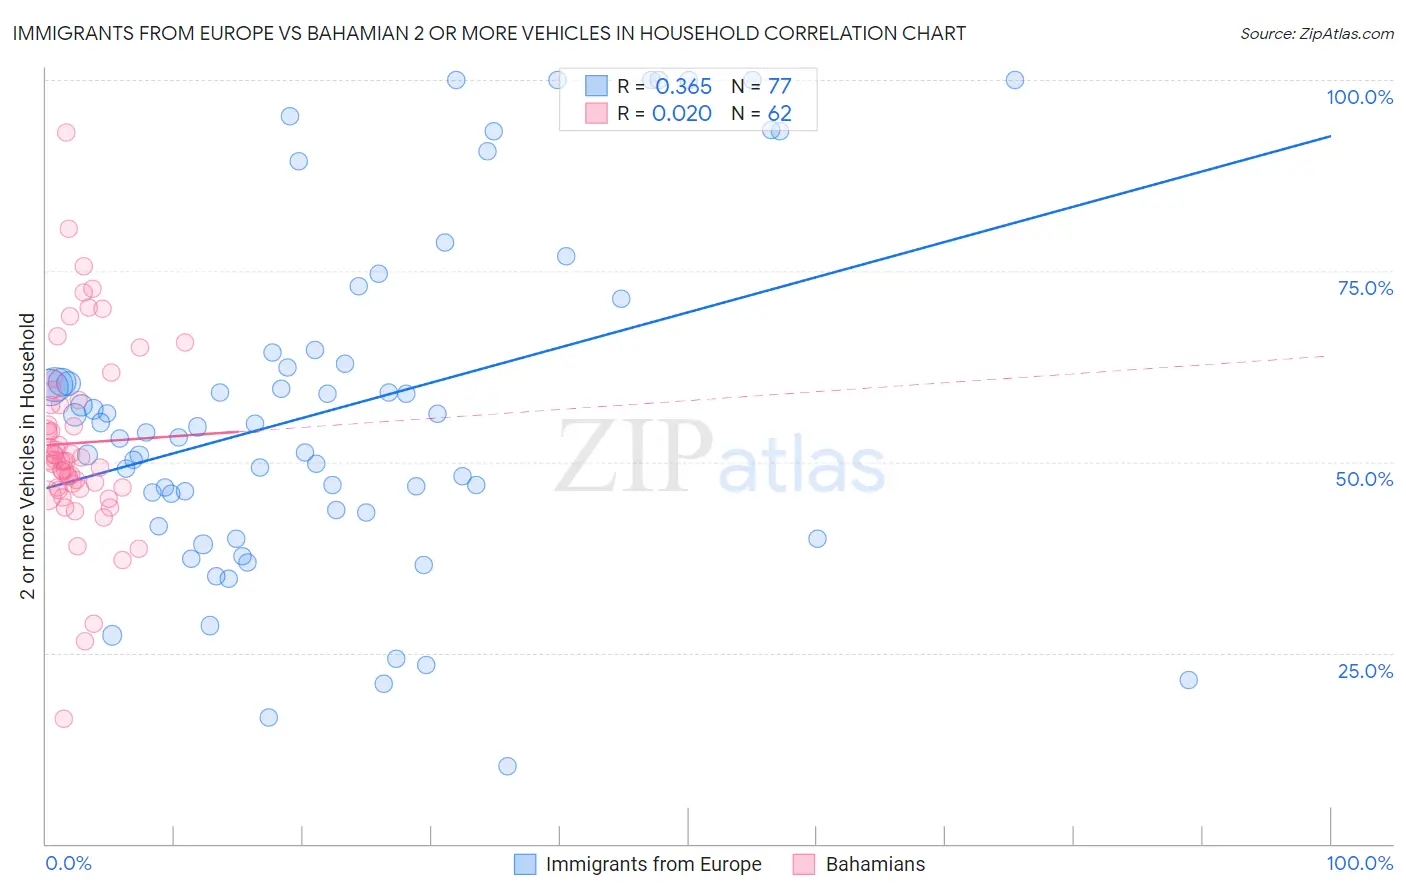
Immigrants from Europe vs Bahamian 2 or more Vehicles in Household Correlation Chart
The statistical analysis conducted on geographies consisting of 546,948,405 people shows a mild positive correlation between the proportion of Immigrants from Europe and percentage of households with 2 or more vehicles available in the United States with a correlation coefficient (R) of 0.365 and weighted average of 53.2%. Similarly, the statistical analysis conducted on geographies consisting of 112,649,221 people shows no correlation between the proportion of Bahamians and percentage of households with 2 or more vehicles available in the United States with a correlation coefficient (R) of 0.020 and weighted average of 51.5%, a difference of 3.3%.
2 or more Vehicles in Household Correlation Summary
| Measurement | Immigrants from Europe | Bahamian |
| Minimum | 10.1% | 16.4% |
| Maximum | 100.0% | 93.2% |
| Range | 89.9% | 76.8% |
| Mean | 57.0% | 52.5% |
| Median | 54.6% | 50.1% |
| Interquartile 25% (IQ1) | 43.6% | 46.7% |
| Interquartile 75% (IQ3) | 64.5% | 57.5% |
| Interquartile Range (IQR) | 20.9% | 10.8% |
| Standard Deviation (Sample) | 22.4% | 12.5% |
| Standard Deviation (Population) | 22.2% | 12.4% |
Similar Demographics by 2 or more Vehicles in Household
Demographics Similar to Immigrants from Europe by 2 or more Vehicles in Household
In terms of 2 or more vehicles in household, the demographic groups most similar to Immigrants from Europe are Immigrants from Sierra Leone (53.2%, a difference of 0.030%), Immigrants from Eastern Asia (53.2%, a difference of 0.030%), Immigrants from Armenia (53.3%, a difference of 0.070%), Cambodian (53.3%, a difference of 0.070%), and Macedonian (53.3%, a difference of 0.14%).
| Demographics | Rating | Rank | 2 or more Vehicles in Household |
| Ugandans | 3.2 /100 | #233 | Tragic 53.5% |
| Immigrants | Switzerland | 3.0 /100 | #234 | Tragic 53.4% |
| Immigrants | Middle Africa | 3.0 /100 | #235 | Tragic 53.4% |
| Indonesians | 2.7 /100 | #236 | Tragic 53.4% |
| Macedonians | 2.4 /100 | #237 | Tragic 53.3% |
| Immigrants | Armenia | 2.3 /100 | #238 | Tragic 53.3% |
| Cambodians | 2.3 /100 | #239 | Tragic 53.3% |
| Immigrants | Europe | 2.1 /100 | #240 | Tragic 53.2% |
| Immigrants | Sierra Leone | 2.1 /100 | #241 | Tragic 53.2% |
| Immigrants | Eastern Asia | 2.1 /100 | #242 | Tragic 53.2% |
| Ethiopians | 1.7 /100 | #243 | Tragic 53.1% |
| Indians (Asian) | 1.7 /100 | #244 | Tragic 53.1% |
| Immigrants | Ethiopia | 1.5 /100 | #245 | Tragic 53.0% |
| Immigrants | Nigeria | 1.2 /100 | #246 | Tragic 52.9% |
| Sierra Leoneans | 1.2 /100 | #247 | Tragic 52.9% |
Demographics Similar to Bahamians by 2 or more Vehicles in Household
In terms of 2 or more vehicles in household, the demographic groups most similar to Bahamians are Immigrants from Kazakhstan (51.6%, a difference of 0.060%), Immigrants from China (51.5%, a difference of 0.080%), Immigrants from Zaire (51.5%, a difference of 0.12%), Immigrants from Uruguay (51.4%, a difference of 0.28%), and Immigrants from Eastern Europe (51.7%, a difference of 0.37%).
| Demographics | Rating | Rank | 2 or more Vehicles in Household |
| Immigrants | Honduras | 0.2 /100 | #275 | Tragic 51.8% |
| Immigrants | Croatia | 0.2 /100 | #276 | Tragic 51.8% |
| Immigrants | Africa | 0.2 /100 | #277 | Tragic 51.8% |
| Yuman | 0.1 /100 | #278 | Tragic 51.7% |
| Liberians | 0.1 /100 | #279 | Tragic 51.7% |
| Immigrants | Eastern Europe | 0.1 /100 | #280 | Tragic 51.7% |
| Immigrants | Kazakhstan | 0.1 /100 | #281 | Tragic 51.6% |
| Bahamians | 0.1 /100 | #282 | Tragic 51.5% |
| Immigrants | China | 0.1 /100 | #283 | Tragic 51.5% |
| Immigrants | Zaire | 0.1 /100 | #284 | Tragic 51.5% |
| Immigrants | Uruguay | 0.1 /100 | #285 | Tragic 51.4% |
| Immigrants | Liberia | 0.1 /100 | #286 | Tragic 51.3% |
| Immigrants | Serbia | 0.1 /100 | #287 | Tragic 51.3% |
| Okinawans | 0.1 /100 | #288 | Tragic 51.2% |
| Somalis | 0.0 /100 | #289 | Tragic 51.1% |