Immigrants from Colombia vs Comanche 2 or more Vehicles in Household
COMPARE
Immigrants from Colombia
Comanche
2 or more Vehicles in Household
2 or more Vehicles in Household Comparison
Immigrants from Colombia
Comanche
52.0%
2 OR MORE VEHICLES IN HOUSEHOLD
0.2/ 100
METRIC RATING
267th/ 347
METRIC RANK
56.5%
2 OR MORE VEHICLES IN HOUSEHOLD
88.4/ 100
METRIC RATING
133rd/ 347
METRIC RANK
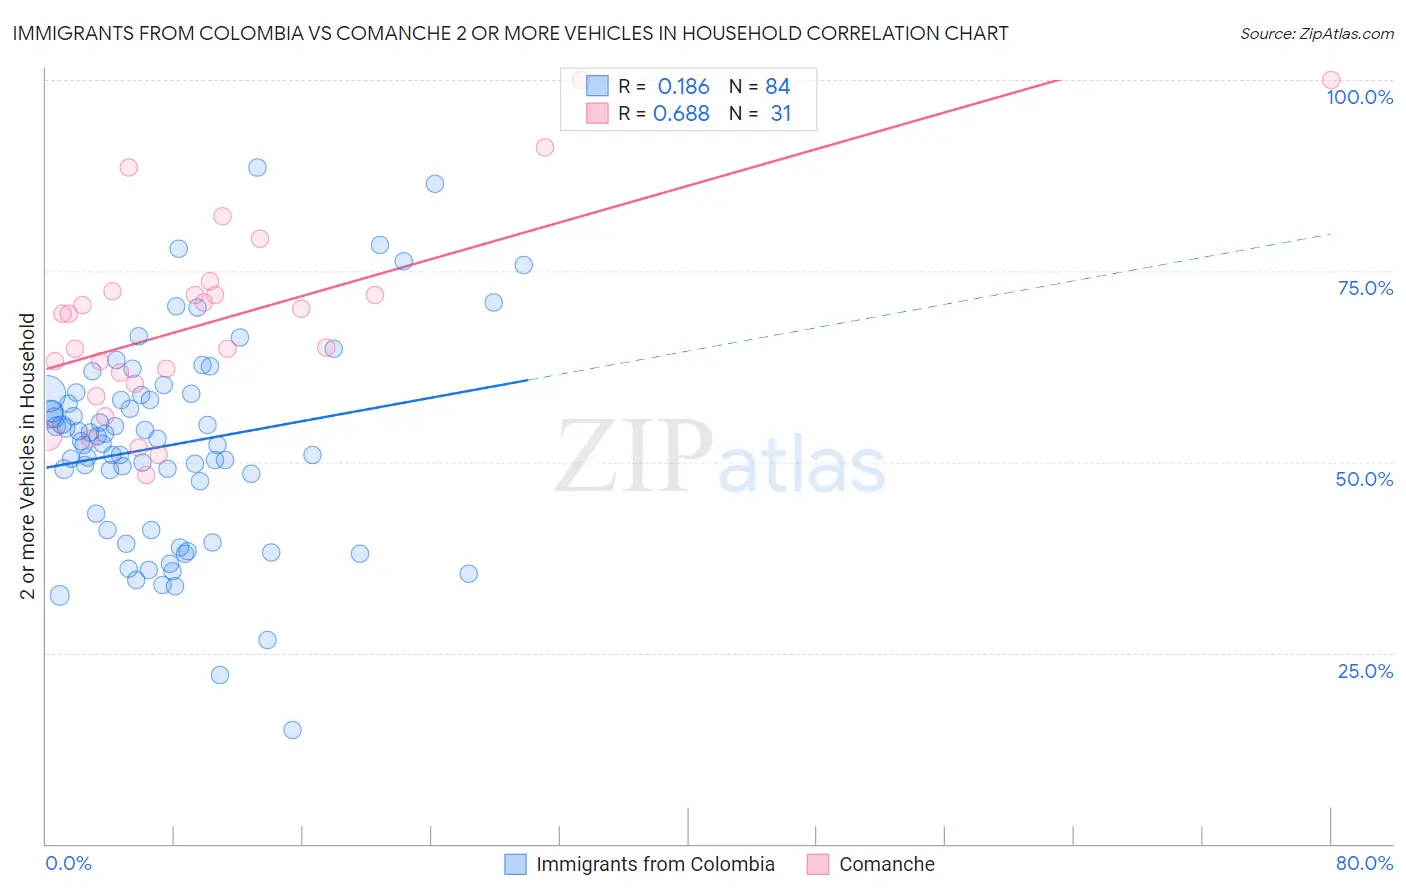
Immigrants from Colombia vs Comanche 2 or more Vehicles in Household Correlation Chart
The statistical analysis conducted on geographies consisting of 378,550,155 people shows a poor positive correlation between the proportion of Immigrants from Colombia and percentage of households with 2 or more vehicles available in the United States with a correlation coefficient (R) of 0.186 and weighted average of 52.0%. Similarly, the statistical analysis conducted on geographies consisting of 109,768,112 people shows a significant positive correlation between the proportion of Comanche and percentage of households with 2 or more vehicles available in the United States with a correlation coefficient (R) of 0.688 and weighted average of 56.5%, a difference of 8.5%.
2 or more Vehicles in Household Correlation Summary
| Measurement | Immigrants from Colombia | Comanche |
| Minimum | 14.8% | 48.2% |
| Maximum | 88.6% | 100.0% |
| Range | 73.8% | 51.8% |
| Mean | 52.2% | 68.7% |
| Median | 52.9% | 69.4% |
| Interquartile 25% (IQ1) | 42.2% | 60.3% |
| Interquartile 75% (IQ3) | 58.8% | 72.4% |
| Interquartile Range (IQR) | 16.7% | 12.1% |
| Standard Deviation (Sample) | 13.4% | 13.2% |
| Standard Deviation (Population) | 13.3% | 13.0% |
Similar Demographics by 2 or more Vehicles in Household
Demographics Similar to Immigrants from Colombia by 2 or more Vehicles in Household
In terms of 2 or more vehicles in household, the demographic groups most similar to Immigrants from Colombia are Pima (52.0%, a difference of 0.010%), Honduran (52.0%, a difference of 0.010%), Immigrants from Ireland (52.0%, a difference of 0.040%), Immigrants from France (52.0%, a difference of 0.050%), and Immigrants from Congo (52.1%, a difference of 0.19%).
| Demographics | Rating | Rank | 2 or more Vehicles in Household |
| Immigrants | Bahamas | 0.5 /100 | #260 | Tragic 52.5% |
| Immigrants | Australia | 0.5 /100 | #261 | Tragic 52.4% |
| Immigrants | Northern Africa | 0.4 /100 | #262 | Tragic 52.3% |
| Immigrants | Southern Europe | 0.4 /100 | #263 | Tragic 52.3% |
| Immigrants | Latvia | 0.4 /100 | #264 | Tragic 52.2% |
| Immigrants | Congo | 0.3 /100 | #265 | Tragic 52.1% |
| Immigrants | France | 0.2 /100 | #266 | Tragic 52.0% |
| Immigrants | Colombia | 0.2 /100 | #267 | Tragic 52.0% |
| Pima | 0.2 /100 | #268 | Tragic 52.0% |
| Hondurans | 0.2 /100 | #269 | Tragic 52.0% |
| Immigrants | Ireland | 0.2 /100 | #270 | Tragic 52.0% |
| South Americans | 0.2 /100 | #271 | Tragic 51.9% |
| Sub-Saharan Africans | 0.2 /100 | #272 | Tragic 51.9% |
| Israelis | 0.2 /100 | #273 | Tragic 51.9% |
| Africans | 0.2 /100 | #274 | Tragic 51.8% |
Demographics Similar to Comanche by 2 or more Vehicles in Household
In terms of 2 or more vehicles in household, the demographic groups most similar to Comanche are Hungarian (56.5%, a difference of 0.070%), Bulgarian (56.5%, a difference of 0.14%), Immigrants from the Azores (56.4%, a difference of 0.16%), Blackfeet (56.4%, a difference of 0.16%), and Yugoslavian (56.6%, a difference of 0.17%).
| Demographics | Rating | Rank | 2 or more Vehicles in Household |
| Estonians | 90.9 /100 | #126 | Exceptional 56.6% |
| Immigrants | Thailand | 90.7 /100 | #127 | Exceptional 56.6% |
| Immigrants | South Central Asia | 90.5 /100 | #128 | Exceptional 56.6% |
| Ute | 90.4 /100 | #129 | Exceptional 56.6% |
| Yugoslavians | 90.0 /100 | #130 | Exceptional 56.6% |
| Bulgarians | 89.7 /100 | #131 | Excellent 56.5% |
| Hungarians | 89.1 /100 | #132 | Excellent 56.5% |
| Comanche | 88.4 /100 | #133 | Excellent 56.5% |
| Immigrants | Azores | 86.6 /100 | #134 | Excellent 56.4% |
| Blackfeet | 86.5 /100 | #135 | Excellent 56.4% |
| Immigrants | Asia | 86.0 /100 | #136 | Excellent 56.3% |
| Cubans | 84.8 /100 | #137 | Excellent 56.3% |
| Salvadorans | 84.7 /100 | #138 | Excellent 56.3% |
| Armenians | 84.3 /100 | #139 | Excellent 56.3% |
| Latvians | 83.6 /100 | #140 | Excellent 56.2% |