Barbadian vs Austrian 2 or more Vehicles in Household
COMPARE
Barbadian
Austrian
2 or more Vehicles in Household
2 or more Vehicles in Household Comparison
Barbadians
Austrians
38.3%
2 OR MORE VEHICLES IN HOUSEHOLD
0.0/ 100
METRIC RATING
337th/ 347
METRIC RANK
58.4%
2 OR MORE VEHICLES IN HOUSEHOLD
99.6/ 100
METRIC RATING
72nd/ 347
METRIC RANK
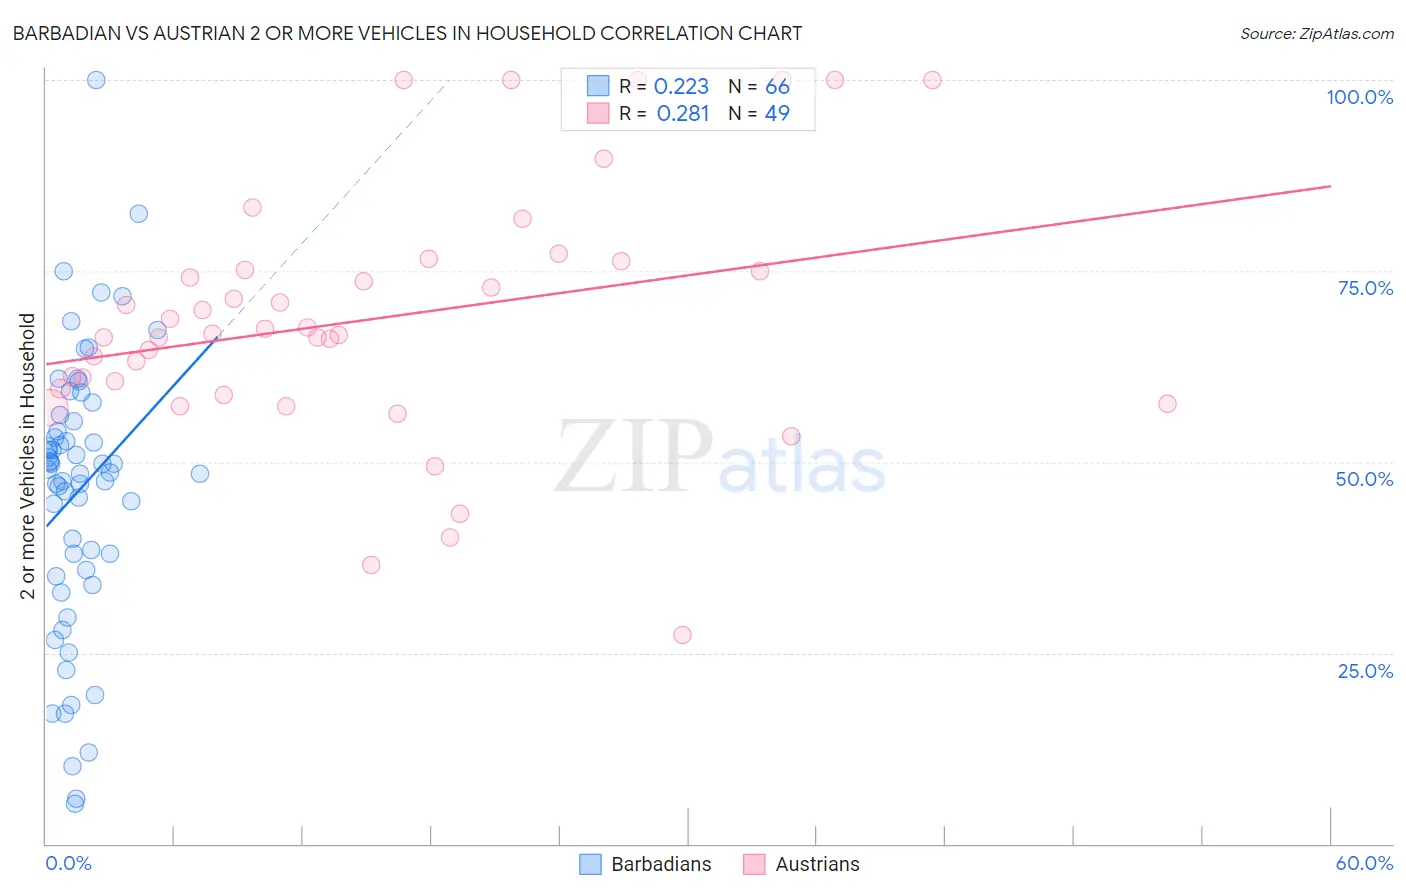
Barbadian vs Austrian 2 or more Vehicles in Household Correlation Chart
The statistical analysis conducted on geographies consisting of 141,285,511 people shows a weak positive correlation between the proportion of Barbadians and percentage of households with 2 or more vehicles available in the United States with a correlation coefficient (R) of 0.223 and weighted average of 38.3%. Similarly, the statistical analysis conducted on geographies consisting of 451,851,074 people shows a weak positive correlation between the proportion of Austrians and percentage of households with 2 or more vehicles available in the United States with a correlation coefficient (R) of 0.281 and weighted average of 58.4%, a difference of 52.3%.
2 or more Vehicles in Household Correlation Summary
| Measurement | Barbadian | Austrian |
| Minimum | 5.2% | 27.3% |
| Maximum | 100.0% | 100.0% |
| Range | 94.8% | 72.7% |
| Mean | 46.2% | 68.8% |
| Median | 48.8% | 66.8% |
| Interquartile 25% (IQ1) | 35.8% | 59.2% |
| Interquartile 75% (IQ3) | 55.4% | 75.7% |
| Interquartile Range (IQR) | 19.6% | 16.5% |
| Standard Deviation (Sample) | 18.2% | 16.5% |
| Standard Deviation (Population) | 18.0% | 16.3% |
Similar Demographics by 2 or more Vehicles in Household
Demographics Similar to Barbadians by 2 or more Vehicles in Household
In terms of 2 or more vehicles in household, the demographic groups most similar to Barbadians are Vietnamese (38.5%, a difference of 0.41%), Immigrants from Bangladesh (38.8%, a difference of 1.1%), Immigrants from Uzbekistan (37.9%, a difference of 1.2%), Immigrants from Trinidad and Tobago (40.3%, a difference of 5.0%), and Immigrants from Ecuador (40.5%, a difference of 5.6%).
| Demographics | Rating | Rank | 2 or more Vehicles in Household |
| Immigrants | Dominica | 0.0 /100 | #330 | Tragic 41.6% |
| West Indians | 0.0 /100 | #331 | Tragic 41.3% |
| Trinidadians and Tobagonians | 0.0 /100 | #332 | Tragic 40.9% |
| Immigrants | Ecuador | 0.0 /100 | #333 | Tragic 40.5% |
| Immigrants | Trinidad and Tobago | 0.0 /100 | #334 | Tragic 40.3% |
| Immigrants | Bangladesh | 0.0 /100 | #335 | Tragic 38.8% |
| Vietnamese | 0.0 /100 | #336 | Tragic 38.5% |
| Barbadians | 0.0 /100 | #337 | Tragic 38.3% |
| Immigrants | Uzbekistan | 0.0 /100 | #338 | Tragic 37.9% |
| Immigrants | Barbados | 0.0 /100 | #339 | Tragic 35.8% |
| British West Indians | 0.0 /100 | #340 | Tragic 35.4% |
| Guyanese | 0.0 /100 | #341 | Tragic 35.4% |
| Dominicans | 0.0 /100 | #342 | Tragic 35.3% |
| Immigrants | Guyana | 0.0 /100 | #343 | Tragic 35.0% |
| Yup'ik | 0.0 /100 | #344 | Tragic 34.9% |
Demographics Similar to Austrians by 2 or more Vehicles in Household
In terms of 2 or more vehicles in household, the demographic groups most similar to Austrians are Bangladeshi (58.4%, a difference of 0.030%), Italian (58.4%, a difference of 0.050%), Bolivian (58.3%, a difference of 0.12%), Immigrants from Afghanistan (58.3%, a difference of 0.13%), and Pennsylvania German (58.5%, a difference of 0.16%).
| Demographics | Rating | Rank | 2 or more Vehicles in Household |
| Immigrants | Central America | 99.7 /100 | #65 | Exceptional 58.6% |
| Croatians | 99.7 /100 | #66 | Exceptional 58.6% |
| Laotians | 99.7 /100 | #67 | Exceptional 58.6% |
| Canadians | 99.7 /100 | #68 | Exceptional 58.6% |
| Pennsylvania Germans | 99.7 /100 | #69 | Exceptional 58.5% |
| Italians | 99.6 /100 | #70 | Exceptional 58.4% |
| Bangladeshis | 99.6 /100 | #71 | Exceptional 58.4% |
| Austrians | 99.6 /100 | #72 | Exceptional 58.4% |
| Bolivians | 99.6 /100 | #73 | Exceptional 58.3% |
| Immigrants | Afghanistan | 99.6 /100 | #74 | Exceptional 58.3% |
| Poles | 99.5 /100 | #75 | Exceptional 58.3% |
| Creek | 99.5 /100 | #76 | Exceptional 58.3% |
| Slovenes | 99.5 /100 | #77 | Exceptional 58.3% |
| Lithuanians | 99.5 /100 | #78 | Exceptional 58.2% |
| Delaware | 99.4 /100 | #79 | Exceptional 58.2% |